 🏷️ Likely Rental
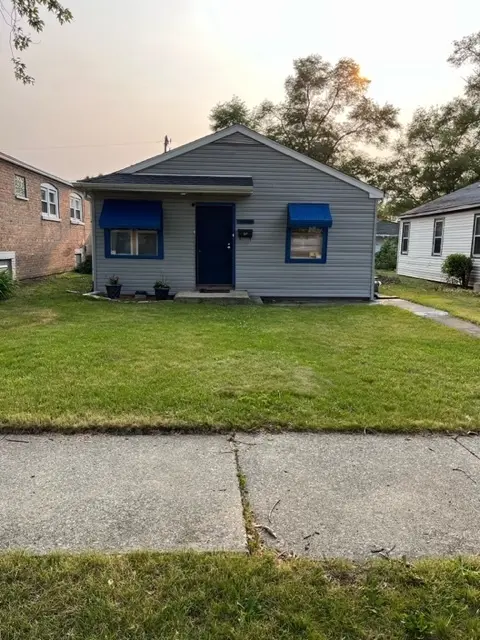
14606 Myrtle Ave · Harvey, IL
Flood risk 1/10 · Minimal
- FEMA flood zone
- X (unshaded)
- Chance of flooding over 30 yrs
- 0.0%
- Est. flood insurance / yr
- $473 – $860
Fire risk 1/10 · Minimal
- Est. fire insurance / yr
- $804 – $1,492
Heat risk 3/10 · Minor
- Hot days now (above 102°F)
- 7 days/yr
- Hot days in 30 yrs
- 15 days/yr
Wind risk 2/10 · Minimal
- Chance of severe wind over 30 yrs
- —
Air-quality risk 3/10 · Minor
- Unhealthy air days now
- 4 days/yr
- Unhealthy air days in 30 yrs
- 4 days/yr
Risk factors via First Street. Map © Google.
Why this score? — see what drove the A- grade
The composite is a weighted blend of 9 inputs, each scored 0–100. Each bar is that input's sub-score; the figure is the points it added to the 100-point composite (weight × sub-score).
- Cash flow +30.0/30.0
- ARV discount +15.0/15.0
- 1% rule +10.0/10.0
- DSCR +10.0/10.0
- Appreciation +10.0/10.0
- Livability +3.4/5.0
- Rent growth +2.5/5.0
- Condition / age +2.5/5.0
- Schools +0.7/10.0
$69,900
🖨 Deal sheet (PDF) 📄 Offer letter ✓ Due diligence
Listing remarks
Cash-Flowing Harvey Rental - Tenant in Place, 12-Month Home Warranty + Owner Financing Available. Turnkey 2-bed/1-bath investment property delivering income from day one. Current tenant paying $1,200/month on a lease through June 2026 - your debt service is covered before keys change hands, with a short runway to reset rent to market or retain a paying tenant. Owner financing available to qualified investors - bypass conventional underwriting, preserve cash for other deals, close fast. Seller is also including a 12-month home warranty at closing for added peace of mind on mechanicals. Substantial capital improvements completed within the last 24 months including new roof, new windows, new v
Key facts
- Modernized plumbing
- New vinyl siding
- New roof
Tags
Neighborhood map
What this means for you Summary
Snapshot
- This is a 2-bed/1.0-bath single-family listed at $70k.
Deal economics
- At list price, monthly cash flow is $464 ($6k/yr) — positive.
- The deal already cash-flows at list — no discount required.
- Meets the 1% rule at list price ($1k rent vs $70k).
- Recommended offer: $69k (1.5% below list) — sets the bar for market timing.
- Cap rate 14.3% vs local median 9.3% in Harvey — top-decile yield for the area; either an underpriced asset or a hidden risk that comps aren't pricing in. Stress-test before assuming the spread holds.
Location & tenants
- Location reads 67/100 on livability (#539 in IL) — a middle-class / working-renter tenant base. Strengths: commute A+, cost of living A+, housing A-; Watch: health & safety D+, schools F, crime F.
- Thornton Twp Hsd 205 (suburban): math 7% / reading 8% proficiency, ranked #594 of 620 in IL (top 96%) — low school quality limits family demand, transient renter base, plan for 1-2y turnover.
- Market conditions: 133 active listings in the ZIP; 2 comparable units currently listed for rent nearby; 6,272 units permitted in Cook County in 2024 (4,658 in 5+ unit buildings).
Forward outlook
- In year one you build about $7k of equity ($483 loan paydown + $7k appreciation (10.0% local appreciation)).
- At projected returns (10.0% appreciation + 3.0% rent growth), your $20k cash investment doubles in ~2 years — after that, you're playing with house money.
- By year 5, paydown + projected appreciation supports a ~$35k cash-out refi (75% LTV) — recoverable capital for the next deal without selling this one.
Negotiation context
- It's been on market 30 days — a 2% lower offer ($69k) is reasonable based on typical stale-listing flexibility.
- 4 sale attempts since 8y ago with the ask held roughly flat each time — persistent listings suggest the price (not the market) is what's stuck; bring a comps-based counter.
- Current owner paid $8k; list at $70k implies a 774% gain — meaningful room to come down on a strong offer.
Risks & watch-outs
- Watch-outs: property tax is 4.3% of price; built in 1955 — expect roof / HVAC / electrical / plumbing capex.
Questions for the listing agent
- Built in 1955 — when were the roof, HVAC, electrical panel, plumbing, and water heater last replaced?
- Property tax is high relative to price — has the assessment been appealed recently, and will the sale trigger a re-assessment?
- Is there a deadline driving the sale (1031 exchange, divorce, estate, relocation)? That informs how much negotiation room exists.
- Schools are F-rated, which usually means shorter tenancies and higher turnover. Who's the typical renter profile here, and what's been the actual vacancy rate?
- Crime grade is F in this area — have there been break-ins, vandalism, or insurance claims at this property in the last 3 years? What carrier currently insures it and at what premium?
- What's the average days-on-market for RENTAL listings here right now (not sales)? A rising rental-DOM trend means longer vacancies and softer asking-rent achievability than the comps imply.
- What's the recent tenant-quality profile in this submarket — average credit score on applications, eviction rate, late-payment / NSF rate, and stable-employment percentage? A property-management company in the area should have these aggregated.
- How much new for-sale + rental construction is in the pipeline within 1–3 miles? Heavy new supply typically softens prices + rents 12–24 months out; constrained supply supports both.
Investment metrics
- 1% rule
- 2.01% ✓
- Cap rate
- 14.25%
- Cash-on-cash
- 28.42%
- DSCR
- 2.26
- GRM
- 4.1
CMA / ARV
- ARV (on-the-fly)
- $112,320
- Comps found
- 12
Show comp detail 12 sales within ~0.75 mi
| Address | Dist | Beds/Ba | Sqft | Sold | Price | $/sf | Match |
|---|---|---|---|---|---|---|---|
| 14630 Loomis Ave | 0.08mi | 2/1.0 | 936 (+8%) | 10mo | $127,000 | $136 | 74 |
| 14727 Wood St | 0.45mi | 3/1.5 (+1) | 900 (+4%) | 6mo | $60,000 | $67 | 60 |
| 14817 Lexington Ave | 0.33mi | 3/1.0 (+1) | 946 (+10%) | 5mo | $110,000 | $116 | 60 |
| 14911 Page Ave | 0.51mi | 3/1.5 (+1) | 923 (+7%) | 2mo | $110,000 | $119 | 56 |
| 14827 Marshfield Ave | 0.37mi | 3/1.5 (+1) | 923 (+7%) | 10mo | $120,000 | $130 | 56 |
| 15125 Marshfield Ave S | 0.70mi | 3/1.0 (+1) | 900 (+4%) | 3mo | $127,500 | $142 | 53 |
| 14921 Lincoln Ave | 0.67mi | 3/1.0 (+1) | 900 (+4%) | 6mo | $149,900 | $167 | 52 |
| 15112 Vine Ave | 0.65mi | 3/1.0 (+1) | 912 (+6%) | 7mo | $43,000 | $47 | 50 |
| 102 E 150th St | 0.51mi | 3/1.5 (+1) | 750 (-13%) | 0mo | $95,000 | $127 | 47 |
| 34 W 142nd St | 0.53mi | 3/1.0 (+1) | 960 (+11%) | 9mo | $175,000 | $182 | 44 |
| 14508 Des Plaines St | 0.70mi | 3/3.0 (+1) | 904 (+5%) | 8mo | $59,000 | $65 | 40 |
| 14103 Marshfield Ave | 0.65mi | 3/1.0 (+1) | 960 (+11%) | 8mo | $177,000 | $184 | 39 |
Match score weights: distance 35% · size 25% · config 20% · recency 20%. Top-matched comps best support the ARV.
Projected returns pro-forma
10.0% appreciation · 3.0% rent growth · sell at horizon
- IRR
- 45.9%
- Equity multiple
- 4.46×
- Total profit
- $67,714
- Equity at exit
- $62,971
- IRR
- 39.8%
- Equity multiple
- 10.01×
- Total profit
- $176,431
- Equity at exit
- $135,800
Cash invested: $19,572 (down + closing). Projections, not guarantees.
Landlord ↔ Tenant lean methodology
- Overall (STATE)
- 43 Moderately Tenant-Leaning
- State Illinois
- 43 Moderately Tenant-Leaning · D+7
- County
- — inherits STATE
- City
- — inherits STATE
ZIP-level market 60426
- Home prices YoY
- 6.9%
- Active inventory
- 133
- Price-to-rent
- 4.1×
Monthly cashflow live
- Estimated rent
- $1,405 medium interval (Pro) →
- Mortgage (P&I)
- −$367
- Tax from tax record
- −$251 /mo · $3,006/yr
- Insurance
- −$29
- HOA
- −$0
- Vacancy / Maint / Mgmt
- −$295
- Net cashflow
- $464
Break-even live
Sensitivity live
| Price | -10% $503 | -5% $483 | +0% $464 | +5% $444 | +10% $424 |
|---|---|---|---|---|---|
| Rent | -10% $353 | -5% $408 | +0% $464 | +5% $519 | +10% $575 |
| Rate | -1.0pp $499 | -0.5pp $481 | base $464 | +0.5pp $445 | +1.0pp $427 |
UW: 25.0% down · 7.5% · 30yr · 1.5% tax · 5.0% vac · 8.0% maint · 8.0% mgmt
Financing live
Cash to close
- Down payment
- $17,475
- Closing costs
- $2,097
- Reserves months
- —
- Total cash needed
- —
Loan-product check · same deal, 3 products live
Conventional
25% down · 7.5% · 30yr
- Down + closing
- —
- Monthly P&I
- —
- Monthly cashflow
- —
- DSCR
- —
- Eligible?
- —
Personal DTI + credit; lowest rate.
DSCR
20% down · 8.5% · 30yr
- Down + closing
- —
- Monthly P&I
- —
- Monthly cashflow
- —
- DSCR
- —
- Eligible?
- —
No personal income docs; deal must DSCR.
Hard money
10% down · 12.0% · 12mo
- Down + closing
- —
- Monthly P&I
- —
- Monthly cashflow
- —
- DSCR
- —
- Eligible?
- —
Short-term bridge; refi at stabilization.
Rent comps 2 comps
| Address | Beds | Baths | Sqft | Rent | $/sqft | DOM | Units | Dist |
|---|---|---|---|---|---|---|---|---|
| 14629 Hoyne Ave Dixmoor, IL | 3.0 | 1.0 | 920 | $1,495 | $1.62 | 25d | 1 | 0.77mi |
| 455 W 144th St Unit 2W Riverdale, IL | 1.0 | 1.0 | 750 | $1,250 | $1.67 | 0d | 1 | 1.22mi |
Listing history 31 events
-
2026-06-21days on market $69,900 Active 30 DOM
-
2026-06-18days on market $69,900 Active 27 DOM
-
2026-06-17days on market $69,900 Active 26 DOM
-
2026-06-16days on market $69,900 Active 25 DOM
-
2026-06-15days on market $69,900 Active 24 DOM
-
2026-06-13days on market $69,900 Active 22 DOM
-
2026-06-13days on market $69,900 Active 21 DOM
-
2026-06-09days on market $69,900 Active 18 DOM
-
2026-06-08days on market $69,900 Active 17 DOM
-
2026-06-07days on market $69,900 Active 16 DOM
-
2026-06-04days on market $69,900 Active 13 DOM
-
2026-06-03days on market $69,900 Active 12 DOM
-
2026-06-02days on market $69,900 Active 11 DOM
-
2026-06-01days on market $69,900 Active 10 DOM
-
2026-05-31days on market $69,900 Active 9 DOM
-
2026-05-22$69,900 Active
-
2024-10-20historical
-
2024-09-27price
-
2024-09-23price
-
2024-09-20price
-
2024-09-07price
-
2024-08-23price
-
2024-08-15price
-
2024-08-04Active
-
2023-11-13historical
-
2023-10-16Active
-
2023-06-21historical
-
2018-10-26soldstatus $8,001 Closed Sale
-
2018-09-11status Pending
-
2018-09-06$7,000 New
-
1985-03-07soldstatus $30,000
ⓘ Source: listings_history table (triggers on properties + properties_extension) + one-shot
backfill from property_details.listing_events for pre-trigger history.
Tax reassessment forecast IL · Partial reset (capped growth)
- Current annual tax
- $3,006 · $251/mo
- Projected year-2 tax
- $3,006 · $251/mo
- Expected delta
- $0/yr ($0/mo · 0.0%)
ⓘ Screening estimate from a state-policy table — verify with the county assessor before closing.
Climate risk First Street
- Flood 1/10 Low FEMA zone X (unshaded) · 0% chance over 30 yrs
- Wildfire 1/10 Low
- Heat 3/10 Moderate 7 d/yr ≥102°F today · 15 d/yr by 30 yrs out
- Wind 2/10 Low
- Air quality 3/10 Moderate 4 unhealthy d/yr today · 4 by 30 yrs out
Nearby sold comps map
Loading sold comps map…
Walkable amenities ~0.75 mi
Loading nearby amenities…
Taxation est. · year 1
- Rental income
- $16,857
- − Mortgage interest
- −$3,915
- − Property taxes
- −$3,006
- − Insurance
- −$350
- − Repairs & maintenance
- −$1,349
- − Management
- −$1,349
- − Depreciation
- −$2,033
- Taxable income
- $4,855
- Est. tax owed @ 24.0%
- −$1,165
- After-tax cash flow
- $4,397/yr
For passive investors: Depreciation is non-cash, so a rental often shows a tax loss while cash-flowing — sheltering income. Rental losses are passive: they offset passive income freely, and up to $25,000/yr can offset ordinary (W-2) income if you actively participate and your MAGI is under $100k (phasing out to $0 by $150k); unused losses carry forward. On sale, claimed depreciation is recaptured at up to 25%, and gains may owe capital-gains tax (a 1031 exchange can defer both). Figures are a year-1 estimate at your 24.0% rate — not tax advice; consult a CPA.
Schools (NCES district)
- District
- Thornton Twp Hsd 205
- NCES district ID
- 1738970
- Math proficiency
- 7% ▬ 0.00%
- Reading proficiency
- 8% ▼ -2.00%
- Median HH income
- $43,392
- Composite
- 6.92/100
- National rank
- #9976
- State rank
- #594 of 620 in IL
Livability — Harvey
- Score
- 67/100
- State rank
- #539
- US rank
- #11162
Category grades
Schools grade is shown separately in the Schools card above.
Census & demographics
- Census place
- Harvey, IL
- City population
- 23,066
- Population (ZIP)
- 23,066
Population outlook (Cook County) Hauer SSP2
- Today (2025)
- 5,347,519 people
- By 2030
- 5,357,703 · +0.2%
- By 2040
- 5,324,924 · -0.4%
- By 2050
- 5,230,762 · -2.2%
- By 2075
- 4,785,735 · -10.5%
- By 2100
- 4,188,836 · -21.7%
Race, ethnicity, and origin ACS 2023
- Neighborhood character
- Majority Black (59%)
- Race & ethnicity
- Black 59% Hispanic / Latino 33% Two or more races 12% White 3% Asian 2%
- Hispanic origin (detail)
- Mexican 31%
- Foreign-born
- 17% · Canada
- Languages at home
- 67% English-only · Spanish 30% Other Indo-European 2% French/Haitian/Cajun 1%
Political lean MEDSL · Cook
- 2024 margin
- Solid D (+42.0) · D 70.4% · R 28.4% · Other 1.2%
- 2008→2024 swing
- -11.4pp toward R · 2008: 53.4pp · 2024: 42.0pp
- All cycles
- 2024: D+42.0 2020: D+50.3 2016: D+53.0 2012: D+49.4 2008: D+53.4
Not yet ingested
- Civics
- —
Market trends
- HPI YoY
- ▲ 20.36%
- Current HPI
- 313.7895
- Rent YoY
- —
- Metro
- —
- State GDP YoY
- ▲ 1.59%
- F500 in state
- 60
Industry mix (Fortune 500 HQ in IL)
| Industry | F500 HQs | Revenue |
|---|---|---|
| Insurance | 4 | $201B |
|
||
| Consumer Goods | 4 | $87B |
|
||
| Industrial Machinery | 3 | $64B |
|
||
| Healthcare | 2 | $55B |
|
||
| Retail / Pharmacy | 1 | $148B |
|
||
| Agriculture / Food | 1 | $86B |
|
||
Price history
+133.0% since first listed16 events — show timeline
- 2026-05-22 Listed $69,900 MRED as Distributed by MLS Grid
- 2024-10-20 Listing Removed — MRED as Distributed by MLS Grid
- 2024-09-27 Price Changed — MRED as Distributed by MLS Grid
- 2024-09-23 Price Changed — MRED as Distributed by MLS Grid
- 2024-09-20 Price Changed — MRED as Distributed by MLS Grid
- 2024-09-07 Price Changed — MRED as Distributed by MLS Grid
- 2024-08-23 Price Changed — MRED as Distributed by MLS Grid
- 2024-08-15 Price Changed — MRED as Distributed by MLS Grid
- 2024-08-04 Listed — MRED as Distributed by MLS Grid
- 2023-11-13 Listing Removed — MRED as Distributed by MLS Grid
- 2023-10-16 Listed — MRED as Distributed by MLS Grid
- 2023-06-21 Rental Removed — MRED
- 2018-10-26 Sold (MLS) $8,001 MRED as Distributed by MLS Grid
- 2018-09-11 Pending — MRED as Distributed by MLS Grid
- 2018-09-06 Listed $7,000 MRED as Distributed by MLS Grid
- 1985-03-07 Sold (Public Records) $30,000 Public Records
Property tax history
+2.3%/yrLatest (2023): $3,006 · +14.5% YoY. Source: county tax records.
Cash-flow waterfall
monthlySold comps — $/sqft
last 12 mo · ≤1 miLoading sold comps…