 Fourplex
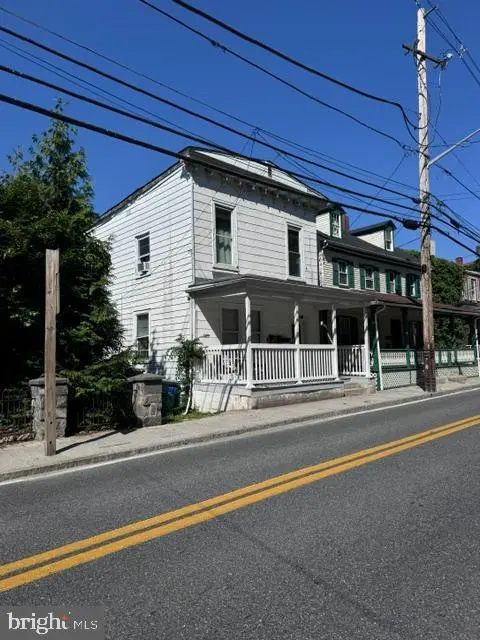
35 N Main St · Port Deposit, MD
Flood risk 10/10 · Severe
- FEMA flood zone
- AE
- Chance of flooding over 30 yrs
- 0.99%
- Est. flood insurance / yr
- $2,026 – $9,024
Fire risk 3/10 · Minor
- Est. fire insurance / yr
- $755 – $1,403
Heat risk 8/10 · Major
- Hot days now (above 105°F)
- 7 days/yr
- Hot days in 30 yrs
- 16 days/yr
Wind risk 6/10 · Moderate
- Chance of severe wind over 30 yrs
- 27.0%
Air-quality risk 3/10 · Minor
- Unhealthy air days now
- 2 days/yr
- Unhealthy air days in 30 yrs
- 3 days/yr
Risk factors via First Street. Map © Google.
Why this score? — see what drove the B- grade
The composite is a weighted blend of 9 inputs, each scored 0–100. Each bar is that input's sub-score; the figure is the points it added to the 100-point composite (weight × sub-score).
- Cash flow +30.0/30.0
- 1% rule +10.0/10.0
- DSCR +10.0/10.0
- ARV discount +7.5/15.0
- Livability +2.8/5.0
- Rent growth +2.5/5.0
- Condition / age +2.5/5.0
- Schools +2.2/10.0
- Appreciation +0.0/10.0
$349,000
🖨 Deal sheet 📄 Offer letter ✓ Due diligence
Multi-family units
County records classify this as Multi-Family (5+ Unit). Listing-text estimate: 4 units. estimate disagrees with records
5+ unit building — per-unit beds/baths from public records are typically unavailable; the breakdown below (if shown) is an estimate from the listing text.
Listing remarks MLS
Great Opportunity to own this 4 unit Multi Family Property in the heart of down town Port Deposit. Walk to the waterfront, coffee & restaurants. All 4 units currently have tenants in place. All units have their own electric meter. The owner currently receives $710.00, $750.00,$620.00 & $850.00 per month. Water/Sewer & Trash, averages between $300 to $400 per quarter. The property is in a flood zone.
Key facts
- 4,185 sq ft lot
- Built 1900
- Listed 28 days
Property features AI
Finance
- Other: Located in Port Deposit (in city limits)
- Financial info: Land assessed value reported; Improvement assessed value reported; Tax assessed value and recent tax year available
Exterior
- Utilities: Public water; Public sewer; Hot water: Other; Heating fuel: Other
- Home design: Multifamily property (4 total units)
- Construction: Above-grade finished area: 3,270; Below-grade unfinished area: 810; Fee simple ownership
- Exterior features: Total below-grade area: 810 (unfinished)
Interior
- Bedrooms: Three one-bedroom units; One three-bedroom unit
- Heating & cooling: Forced air heating
- Interior features: Four-unit building (multifamily)
Neighborhood map
What this means for you Summary
Snapshot
- This is a 1×3bd/1ba + 3×1bd/1ba units multifamily listed at $349k.
Deal economics
- At list price, monthly cash flow is $2k ($21k/yr) — positive. Per door: $433/mo.
- The deal already cash-flows at list — no discount required.
- Meets the 1% rule at list price ($6k rent vs $349k).
- Recommended offer: $344k (1.5% below list) — sets the bar for market timing.
- Cap rate 13.8% vs local median 2.8% in Port Deposit — top-decile yield for the area; either an underpriced asset or a hidden risk that comps aren't pricing in. Stress-test before assuming the spread holds.
Location & tenants
- Location reads 56/100 on livability (#406 in MD) — a working-class tenant base; expect higher turnover. Strengths: housing A+, cost of living A, employment B+; Watch: schools F, crime F, amenities F.
- Cecil County Public Schools (rural): math 15% / reading 30% proficiency, ranked #15 of 24 in MD (top 62%) — low school quality limits family demand, transient renter base, plan for 1-2y turnover.
- Market conditions: 26 active listings in the ZIP; 563 units permitted in Cecil County in 2024 (330 in 5+ unit buildings).
Forward outlook
- Local home prices are declining (-3.0%/yr); year-one equity from $2k of loan paydown is wiped out by about $10k of value loss. Plan a longer hold.
- At projected returns (-3.0% appreciation + 3.0% rent growth), your $98k cash investment doubles in ~6 years — after that, you're playing with house money.
Negotiation context
- It's been on market 29 days — a 2% lower offer ($344k) is reasonable based on typical stale-listing flexibility.
- 17 sale attempts since 21y ago with the ask held roughly flat each time — persistent listings suggest the price (not the market) is what's stuck; bring a comps-based counter.
- Current owner paid $150k; list at $349k implies a 133% gain — meaningful room to come down on a strong offer.
Risks & watch-outs
- Watch-outs: flood insurance adds $460/mo; built in 1900 — expect roof / HVAC / electrical / plumbing capex.
- Climate carrying-cost: in FEMA flood zone AE (mandatory federal flood insurance); major wind risk, 27% chance of damaging wind over 30y; extreme-heat days projected 7→16/yr by 2055 (HVAC capex compounding) — expect insurance premiums to compound above CPI over the hold.
Questions for the listing agent
- Can we see the unit-by-unit rent roll, current vacancy, and any below-market leases? What's the average tenancy length?
- What capital expenditures (roof, boiler, parking lot, exteriors) have been made in the last 5 years, and what's planned in the next 2?
- Built in 1900 — when were the roof, HVAC, electrical panel, plumbing, and water heater last replaced?
- What's the actual annual flood-insurance premium (NFIP or private), and is the property in a SFHA with mandatory coverage?
- Is there a deadline driving the sale (1031 exchange, divorce, estate, relocation)? That informs how much negotiation room exists.
- Schools are F-rated, which usually means shorter tenancies and higher turnover. Who's the typical renter profile here, and what's been the actual vacancy rate?
- Crime grade is F in this area — have there been break-ins, vandalism, or insurance claims at this property in the last 3 years? What carrier currently insures it and at what premium?
- What's the average days-on-market for RENTAL listings here right now (not sales)? A rising rental-DOM trend means longer vacancies and softer asking-rent achievability than the comps imply.
- What's the recent tenant-quality profile in this submarket — average credit score on applications, eviction rate, late-payment / NSF rate, and stable-employment percentage? A property-management company in the area should have these aggregated.
- How much new apartment / multifamily construction is in the pipeline within 1–3 miles? Heavy new supply (>2% of stock underway) typically softens rents 12–24 months out; light construction supports rent growth.
Investment metrics
- 1% rule
- 1.68% ✓
- Cap rate
- 13.83%
- Cash-on-cash
- 26.93%
- DSCR
- 2.20
- GRM
- 5.0
CMA / ARV
No comps found within radius.
Projected returns pro-forma
-3.0% appreciation · 3.0% rent growth · sell at horizon
- IRR
- 13.9%
- Equity multiple
- 1.55×
- Total profit
- $54,157
- Equity at exit
- $52,037
- IRR
- 22.7%
- Equity multiple
- 2.95×
- Total profit
- $190,782
- Equity at exit
- $30,175
Cash invested: $97,720 (down + closing). Projections, not guarantees.
Landlord ↔ Tenant lean methodology
- Overall (STATE)
- 27 Tenant-Leaning
- State Maryland
- 27 Tenant-Leaning · D+14
- County
- — inherits STATE
- City
- — inherits STATE
ZIP-level market 21904
- Home prices YoY
- -35.0%
- Active inventory
- 26
- Price-to-rent
- 20.8×
Monthly cashflow live
- Estimated rent
- $5,856 medium interval (Pro) →
- Mortgage (P&I)
- −$1,830
- Tax from tax record
- −$458 /mo · $5,496/yr
- Insurance
- −$145
- Flood insurance flood zone
- −$460 /mo · $5,525/yr
- HOA
- −$0
- Vacancy / Maint / Mgmt
- −$1,230
- Net cashflow
- $1,732
Break-even live
4-unit breakdown (identical units grouped — click to expand)
| Units | Beds | Baths | Est. rent |
|---|---|---|---|
| 1× unit | 3 | 1 | $1,400 |
| 3× units | 1 | 1 | $4,455 |
| #2 | 1 | 1 | $1,485 |
| #3 | 1 | 1 | $1,485 |
| #4 | 1 | 1 | $1,485 |
| Total (4 units) | $5,856 | ||
UW: 25.0% down · 7.5% · 30yr · 1.5% tax · 5.0% vac · 8.0% maint · 8.0% mgmt
Financing live
Cash to close
- Down payment
- $87,250
- Closing costs
- $10,470
- Reserves months
- —
- Total cash needed
- —
Loan-product check · same deal, 3 products live
Conventional
25% down · 7.5% · 30yr
- Down + closing
- —
- Monthly P&I
- —
- Monthly cashflow
- —
- DSCR
- —
- Eligible?
- —
Personal DTI + credit; lowest rate.
DSCR
20% down · 8.5% · 30yr
- Down + closing
- —
- Monthly P&I
- —
- Monthly cashflow
- —
- DSCR
- —
- Eligible?
- —
No personal income docs; deal must DSCR.
Hard money
10% down · 12.0% · 12mo
- Down + closing
- —
- Monthly P&I
- —
- Monthly cashflow
- —
- DSCR
- —
- Eligible?
- —
Short-term bridge; refi at stabilization.
Listing history 50 events
-
2026-06-18days on market $349,000 Active 29 DOM
-
2026-06-17days on market $349,000 Active 28 DOM
-
2026-06-16days on market $349,000 Active 27 DOM
-
2026-06-15days on market $349,000 Active 26 DOM
-
2026-06-13days on market $349,000 Active 24 DOM
-
2026-06-09days on market $349,000 Active 20 DOM
-
2026-06-08days on market $349,000 Active 19 DOM
-
2026-06-07days on market $349,000 Active 18 DOM
-
2026-06-04days on market $349,000 Active 15 DOM
-
2026-06-03days on market $349,000 Active 14 DOM
-
2026-06-02days on market $349,000 Active 13 DOM
-
2026-06-01days on market $349,000 Active 12 DOM
-
2026-05-31days on market $349,000 Active 11 DOM
-
2026-05-20$349,000 Active
-
2022-03-28soldstatus $150,000
-
2022-02-23soldstatus $150,000 Closed 422-char remark
Show marketing remark (422 chars)
Great Opportunity to own this 4 unit Multi Family Property in the heart of down town Port Deposit. Walk to the waterfront, coffee & restaurants. All 4 units currently have tenants in place. All units have their own electric meter. The owner currently receives $710.00, $750.00,$620.00 & $850.00 per month. Water/Sewer & Trash, averages between $300 to $400 per quarter. The property is in a flood zone.
-
2022-02-11historical Active Under Contract 422-char remark
Show marketing remark (422 chars)
Great Opportunity to own this 4 unit Multi Family Property in the heart of down town Port Deposit. Walk to the waterfront, coffee & restaurants. All 4 units currently have tenants in place. All units have their own electric meter. The owner currently receives $710.00, $750.00,$620.00 & $850.00 per month. Water/Sewer & Trash, averages between $300 to $400 per quarter. The property is in a flood zone.
-
2022-01-23$179,900 Active 422-char remark
Show marketing remark (422 chars)
Great Opportunity to own this 4 unit Multi Family Property in the heart of down town Port Deposit. Walk to the waterfront, coffee & restaurants. All 4 units currently have tenants in place. All units have their own electric meter. The owner currently receives $710.00, $750.00,$620.00 & $850.00 per month. Water/Sewer & Trash, averages between $300 to $400 per quarter. The property is in a flood zone.
-
2014-09-03historical Expired
-
2014-09-03historical
-
2014-06-07Active
-
2014-06-07$215,000
-
2010-09-23historical Expired
-
2010-09-23historical Expired
-
2010-09-23historical
-
2010-09-22historical
-
2010-09-22historical
-
2010-09-22historical
-
2010-03-01price
-
2010-03-01price
-
2009-09-25Active
-
2009-09-25$224,900
-
2009-09-24Active
-
2009-09-24$224,900
-
2009-09-23$224,900
-
2009-09-23$224,900
-
2008-09-01historical
-
2008-01-24
-
2007-05-21historical
-
2007-05-21historical
-
2006-10-13
-
2006-08-19
-
2006-04-15historical
-
2006-04-07historical
-
2006-02-06historical
-
2005-12-09
-
2005-12-01historical
-
2005-11-30$249,900
-
2005-06-23
-
2005-06-22$249,000
ⓘ Source: listings_history table (triggers on properties + properties_extension) + one-shot
backfill from property_details.listing_events for pre-trigger history.
Tax reassessment forecast MD · Partial reset (capped growth)
- Current annual tax
- $5,496 · $458/mo
- Projected year-2 tax
- $5,496 · $458/mo
- Expected delta
- $0/yr ($0/mo · 0.0%)
ⓘ Screening estimate from a state-policy table — verify with the county assessor before closing.
Climate risk First Street
- Flood 10/10 Extreme FEMA zone AE · 99% chance over 30 yrs
- Wildfire 3/10 Moderate
- Heat 8/10 Severe 7 d/yr ≥105°F today · 16 d/yr by 30 yrs out
- Wind 6/10 Major 27% chance of damaging wind over 30 yrs
- Air quality 3/10 Moderate 2 unhealthy d/yr today · 3 by 30 yrs out
Nearby sold comps map
Loading sold comps map…
Walkable amenities ~0.75 mi
Loading nearby amenities…
Taxation est. · year 1
- Rental income
- $70,272
- − Mortgage interest
- −$19,549
- − Property taxes
- −$5,496
- − Insurance
- −$7,270
- − Repairs & maintenance
- −$5,622
- − Management
- −$5,622
- − Depreciation
- −$10,153
- Taxable income
- $16,560
- Est. tax owed @ 24.0%
- −$3,974
- After-tax cash flow
- $16,812/yr
For passive investors: Depreciation is non-cash, so a rental often shows a tax loss while cash-flowing — sheltering income. Rental losses are passive: they offset passive income freely, and up to $25,000/yr can offset ordinary (W-2) income if you actively participate and your MAGI is under $100k (phasing out to $0 by $150k); unused losses carry forward. On sale, claimed depreciation is recaptured at up to 25%, and gains may owe capital-gains tax (a 1031 exchange can defer both). Figures are a year-1 estimate at your 24.0% rate — not tax advice; consult a CPA.
Schools (NCES district)
- District
- Cecil County Public Schools
- NCES district ID
- 2400240
- Math proficiency
- 15% ▼ -21.00%
- Reading proficiency
- 30% ▼ -15.00%
- Median HH income
- $66,544
- Composite
- 21.51/100
- National rank
- #8322
- State rank
- #15 of 24 in MD
Livability — Port Deposit
- Score
- 56/100
- State rank
- #406
- US rank
- #22434
Category grades
Schools grade is shown separately in the Schools card above.
Census & demographics
- Census place
- Port Deposit, MD
- Population (ZIP)
- 6,401
Population outlook (Cecil County) Hauer SSP2
- Today (2025)
- 105,877 people
- By 2030
- 106,905 · +1.0%
- By 2040
- 107,156 · +1.2%
- By 2050
- 104,170 · -1.6%
- By 2075
- 95,771 · -9.5%
- By 2100
- 82,381 · -22.2%
Race, ethnicity, and origin ACS 2023
- Neighborhood character
- Predominantly White (84%)
- Race & ethnicity
- White 84% Hispanic / Latino 9% Two or more races 6% Black 6%
- Hispanic origin (detail)
- Mexican 8%
- Common ancestry
- Romanian 3% Italian 3% Serbian 2%
- Foreign-born
- 3% · Canada, Guatemala
- Languages at home
- 95% English-only · Spanish 3% Other Indo-European 1% German/W. Germanic 1%
Political lean MEDSL · Cecil
- 2024 margin
- Solid R (+30.9) · D 33.5% · R 64.4% · Other 2.1%
- 2008→2024 swing
- -16.3pp toward R · 2008: -14.6pp · 2024: -30.9pp
- All cycles
- 2024: R+30.9 2020: R+26.6 2016: R+35.3 2012: R+20.4 2008: R+14.6
Not yet ingested
- Civics
- —
Market trends
- HPI YoY
- ▼ -134.21%
- Current HPI
- 249.2215
- Rent YoY
- —
- Metro
- —
- State GDP YoY
- ▲ 2.97%
- F500 in state
- 12
Industry mix (Fortune 500 HQ in MD)
| Industry | F500 HQs | Revenue |
|---|---|---|
| Aerospace / Defense | 1 | $71B |
|
||
| Utilities | 1 | $25B |
|
||
| Hotels | 1 | $24B |
|
||
| Consumer Goods | 1 | $7B |
|
||
| Real Estate | 1 | $6B |
|
||
| Chemicals | 1 | $2B |
|
||
Price history
+571.2% since first listed38 events — show timeline
- 2026-05-20 Listed $349,000 BRIGHT MLS
- 2022-03-28 Sold (Public Records) $150,000 Public Records
- 2022-02-23 Sold (MLS) $150,000 BRIGHT MLS
- 2022-02-11 Contingent — BRIGHT MLS
- 2022-01-23 Listed $179,900 BRIGHT MLS
- 2014-09-03 Delisted — MRIS
- 2014-09-03 Listing Removed — BRIGHT MLS
- 2014-06-07 Listed — MRIS
- 2014-06-07 Listed $215,000 BRIGHT MLS
- 2010-09-23 Delisted — MRIS
- 2010-09-23 Delisted — MRIS
- 2010-09-23 Listing Removed — BRIGHT MLS
- 2010-09-22 Listing Removed — BRIGHT MLS
- 2010-09-22 Listing Removed — BRIGHT MLS
- 2010-09-22 Listing Removed — BRIGHT MLS
- 2010-03-01 Price Changed — MRIS
- 2010-03-01 Price Changed — MRIS
- 2009-09-25 Listed — MRIS
- 2009-09-25 Listed $224,900 BRIGHT MLS
- 2009-09-24 Listed — MRIS
- 2009-09-24 Listed $224,900 BRIGHT MLS
- 2009-09-23 Listed $224,900 BRIGHT MLS
- 2009-09-23 Listed $224,900 BRIGHT MLS
- 2008-09-01 Delisted — MRIS
- 2008-01-24 Listed — MRIS
- 2007-05-21 Delisted — MRIS
- 2007-05-21 Delisted — MRIS
- 2006-10-13 Listed — MRIS
- 2006-08-19 Listed — MRIS
- 2006-04-15 Delisted — MRIS
- 2006-04-07 Listing Removed — BRIGHT MLS
- 2006-02-06 Delisted — MRIS
- 2005-12-09 Listed — MRIS
- 2005-12-01 Listing Removed — BRIGHT MLS
- 2005-11-30 Listed $249,900 BRIGHT MLS
- 2005-06-23 Listed — MRIS
- 2005-06-22 Listed $249,000 BRIGHT MLS
- 1988-02-11 Sold (Public Records) $52,000 Public Records
Property tax history
+4.0%/yrLatest (2025): $5,496 · +11.6% YoY. Source: county tax records.
Cash-flow waterfall
monthlySold comps — $/sqft
last 12 mo · ≤1 miLoading sold comps…