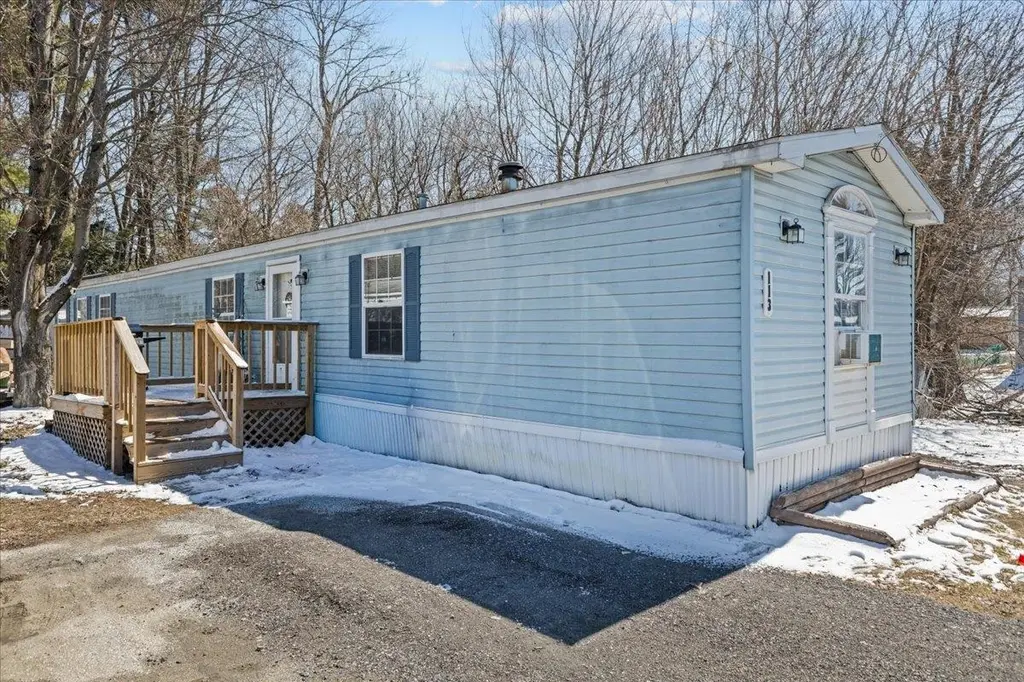
113 Rita Way · Milton, VT
Flood risk 1/10 · Minimal
- FEMA flood zone
- X (unshaded)
- Chance of flooding over 30 yrs
- 0.0%
- Est. flood insurance / yr
- $507 – $1,088
Fire risk 1/10 · Minimal
- Est. fire insurance / yr
- $480 – $892
Heat risk 3/10 · Minor
- Hot days now (above 91°F)
- 7 days/yr
- Hot days in 30 yrs
- 15 days/yr
Wind risk 2/10 · Minimal
- Chance of severe wind over 30 yrs
- 1.0%
Air-quality risk 4/10 · Minor
- Unhealthy air days now
- 3 days/yr
- Unhealthy air days in 30 yrs
- 5 days/yr
Risk factors via First Street. Map © Google.
Why this score? — see what drove the C+ grade
The composite is a weighted blend of 9 inputs, each scored 0–100. Each bar is that input's sub-score; the figure is the points it added to the 100-point composite (weight × sub-score).
- Cash flow +30.0/30.0
- 1% rule +10.0/10.0
- DSCR +10.0/10.0
- Schools +5.0/10.0
- Livability +3.1/5.0
- Rent growth +2.5/5.0
- Condition / age +2.5/5.0
- ARV discount +0.0/15.0
- Appreciation +0.0/10.0
$97,900
🖨 Deal sheet (PDF) 📄 Offer letter ✓ Due diligence
Listing remarks
Great opportunity to own your own 3-bedroom, 2-bath mobile home. Very well maintained with many new updated including new flooring, new fuel tank, new furnace and more. This home has 3 shed grandfathered into the property for additional storage. Central location with quick access to the Town of Milton and interstate I-89.
Key facts
- New furnace
- New fuel tank
- New flooring
Tags
Neighborhood map
What this means for you Summary
Snapshot
- This is a 3-bed/2.5-bath manufactured listed at $98k.
Deal economics
- At list price, monthly cash flow is $901 ($11k/yr) — positive.
- The deal already cash-flows at list — no discount required.
- Meets the 1% rule at list price ($2k rent vs $98k).
- Cap rate 17.3% vs local median 2.1% in Milton — top-decile yield for the area; either an underpriced asset or a hidden risk that comps aren't pricing in. Stress-test before assuming the spread holds.
Location & tenants
- Location reads 61/100 on livability (#88 in VT) — a middle-class / working-renter tenant base. Strengths: crime A, housing A-; Watch: employment C-, amenities F, commute F.
- Zoned schools: Milton Elementary School (math 20% / reading 32%, grade F, #160 of 192 statewide, top 84%, 631 students, 29% FRL); Milton Middle School (math 17% / reading 40%, grade F, #20 of 26 statewide, top 76%, 389 students, 28% FRL); Milton Senior High School (math 22% / reading 52%, grade F, #25 of 48 statewide, top 53%, 439 students, 20% FRL).
- Market conditions: 115 active listings in the ZIP; 898 units permitted in Chittenden County in 2024 (554 in 5+ unit buildings).
Forward outlook
- Local home prices are declining (-3.0%/yr); year-one equity from $677 of loan paydown is wiped out by about $3k of value loss. Plan a longer hold.
- Chittenden County population projected at +8% by 2050 — modest demand growth; plan on rents tracking national, not racing it.
- At projected returns (-3.0% appreciation + 3.0% rent growth), your $27k cash investment doubles in ~3 years — after that, you're playing with house money.
Negotiation context
- Only 2 days on market — expect competitive offers; lowballing is unlikely to land.
- 2 sale attempts since 4y ago with the ask held roughly flat each time — persistent listings suggest the price (not the market) is what's stuck; bring a comps-based counter.
- Current owner paid $42k; list at $98k implies a 133% gain — meaningful room to come down on a strong offer.
Questions for the listing agent
- Is there a deadline driving the sale (1031 exchange, divorce, estate, relocation)? That informs how much negotiation room exists.
- Schools are D-rated, which usually means shorter tenancies and higher turnover. Who's the typical renter profile here, and what's been the actual vacancy rate?
- What's the average days-on-market for RENTAL listings here right now (not sales)? A rising rental-DOM trend means longer vacancies and softer asking-rent achievability than the comps imply.
- What's the recent tenant-quality profile in this submarket — average credit score on applications, eviction rate, late-payment / NSF rate, and stable-employment percentage? A property-management company in the area should have these aggregated.
- How much new for-sale + rental construction is in the pipeline within 1–3 miles? Heavy new supply typically softens prices + rents 12–24 months out; constrained supply supports both.
Investment metrics
- 1% rule
- 1.96% ✓
- Cap rate
- 17.34%
- Cash-on-cash
- 39.44%
- DSCR
- 2.75
- GRM
- 4.2
CMA / ARV
- ARV (on-the-fly)
- $75,544
- Comps found
- 9
Show comp detail 9 sales within ~0.75 mi
| Address | Dist | Beds/Ba | Sqft | Sold | Price | $/sf | Match |
|---|---|---|---|---|---|---|---|
| 113 Rita Way | 0.00mi | 3/2.0 | 1,064 (0%) | 1mo | $90,000 | $85 | 97 |
| 174 Rita Way | 0.15mi | 3/2.0 | 1,120 (+5%) | 13mo | $80,000 | $71 | 71 |
| 52 Rita Way | 0.06mi | 3/1.5 | 924 (-13%) | 7mo | $58,000 | $63 | 65 |
| 79 Rita Way | 0.02mi | 2/2.0 (-1) | 924 (-13%) | 7mo | $140,000 | $152 | 64 |
| 63 Kapica Ln | 0.08mi | 2/2.0 (-1) | 924 (-13%) | 4mo | $77,000 | $83 | 64 |
| 49 Kapica Ln | 0.04mi | 2/1.0 (-1) | 924 (-13%) | 8mo | $60,000 | $65 | 58 |
| 43 Pecor Ave | 0.14mi | 2/1.0 (-1) | 924 (-13%) | 11mo | $48,000 | $52 | 52 |
| 34 Pecor Ave | 0.13mi | 3/1.0 | 924 (-13%) | 19mo | $40,000 | $43 | 50 |
| 54 Pecor Ave | 0.11mi | 2/1.0 (-1) | 924 (-13%) | 18mo | $124,900 | $135 | 47 |
Match score weights: distance 35% · size 25% · config 20% · recency 20%. Top-matched comps best support the ARV.
Projected returns pro-forma
-3.0% appreciation · 3.0% rent growth · sell at horizon
- IRR
- 35.7%
- Equity multiple
- 2.51×
- Total profit
- $41,514
- Equity at exit
- $14,597
- IRR
- 42.4%
- Equity multiple
- 5.01×
- Total profit
- $110,013
- Equity at exit
- $8,465
Cash invested: $27,412 (down + closing). Projections, not guarantees.
Landlord ↔ Tenant lean methodology
- Overall (STATE)
- 41 Moderately Tenant-Leaning
- State Vermont
- 41 Moderately Tenant-Leaning · D+15
- County
- — inherits STATE
- City
- — inherits STATE
ZIP-level market 05468
- Home prices YoY
- -30.4%
- Active inventory
- 115
- Price-to-rent
- 4.2×
Monthly cashflow live
- Estimated rent
- $1,922 medium interval (Pro) →
- Mortgage (P&I)
- −$513
- Tax from tax record
- −$63 /mo · $761/yr
- Insurance
- −$41
- HOA
- −$0
- Vacancy / Maint / Mgmt
- −$404
- Net cashflow
- $901
Break-even live
Sensitivity live
| Price | -10% $956 | -5% $929 | +0% $901 | +5% $873 | +10% $846 |
|---|---|---|---|---|---|
| Rent | -10% $749 | -5% $825 | +0% $901 | +5% $977 | +10% $1,053 |
| Rate | -1.0pp $950 | -0.5pp $926 | base $901 | +0.5pp $876 | +1.0pp $850 |
UW: 25.0% down · 7.5% · 30yr · 1.5% tax · 5.0% vac · 8.0% maint · 8.0% mgmt
Financing live
Cash to close
- Down payment
- $24,475
- Closing costs
- $2,937
- Reserves months
- —
- Total cash needed
- —
Loan-product check · same deal, 3 products live
Conventional
25% down · 7.5% · 30yr
- Down + closing
- —
- Monthly P&I
- —
- Monthly cashflow
- —
- DSCR
- —
- Eligible?
- —
Personal DTI + credit; lowest rate.
DSCR
20% down · 8.5% · 30yr
- Down + closing
- —
- Monthly P&I
- —
- Monthly cashflow
- —
- DSCR
- —
- Eligible?
- —
No personal income docs; deal must DSCR.
Hard money
10% down · 12.0% · 12mo
- Down + closing
- —
- Monthly P&I
- —
- Monthly cashflow
- —
- DSCR
- —
- Eligible?
- —
Short-term bridge; refi at stabilization.
Listing history 5 events
-
2026-04-16status Pending
-
2026-04-13$97,900 Active
-
2022-02-03soldstatus $42,000
-
2022-01-31soldstatus $42,000
-
2022-01-31$42,000
ⓘ Source: listings_history table (triggers on properties + properties_extension) + one-shot
backfill from property_details.listing_events for pre-trigger history.
Tax reassessment forecast VT · Partial reset (capped growth)
- Current annual tax
- $761 · $63/mo
- Projected year-2 tax
- $1,311 · $109/mo
- Expected delta
- +$550/yr (+$46/mo · 72.2%)
ⓘ Screening estimate from a state-policy table — verify with the county assessor before closing.
Climate risk First Street
- Flood 1/10 Low FEMA zone X (unshaded) · 0% chance over 30 yrs
- Wildfire 1/10 Low
- Heat 3/10 Moderate 7 d/yr ≥91°F today · 15 d/yr by 30 yrs out
- Wind 2/10 Low 100% chance of damaging wind over 30 yrs
- Air quality 4/10 Moderate 3 unhealthy d/yr today · 5 by 30 yrs out
Nearby sold comps map
Loading sold comps map…
Walkable amenities ~0.75 mi
Loading nearby amenities…
Taxation est. · year 1
- Rental income
- $23,067
- − Mortgage interest
- −$5,484
- − Property taxes
- −$761
- − Insurance
- −$490
- − Repairs & maintenance
- −$1,845
- − Management
- −$1,845
- − Depreciation
- −$2,848
- Taxable income
- $9,794
- Est. tax owed @ 24.0%
- −$2,351
- After-tax cash flow
- $8,461/yr
For passive investors: Depreciation is non-cash, so a rental often shows a tax loss while cash-flowing — sheltering income. Rental losses are passive: they offset passive income freely, and up to $25,000/yr can offset ordinary (W-2) income if you actively participate and your MAGI is under $100k (phasing out to $0 by $150k); unused losses carry forward. On sale, claimed depreciation is recaptured at up to 25%, and gains may owe capital-gains tax (a 1031 exchange can defer both). Figures are a year-1 estimate at your 24.0% rate — not tax advice; consult a CPA.
Schools (NCES district)
No district data.
Livability — Milton
- Score
- 61/100
- State rank
- #88
- US rank
- #18271
Category grades
Schools grade is shown separately in the Schools card above.
Census & demographics
- Census place
- Milton, VT
- Population (ZIP)
- 13,347
Population outlook (Chittenden County) Hauer SSP2
- Today (2025)
- 170,769 people
- By 2030
- 174,716 · +2.3%
- By 2040
- 180,337 · +5.6%
- By 2050
- 183,768 · +7.6%
- By 2075
- 194,646 · +14.0%
- By 2100
- 194,933 · +14.2%
Race, ethnicity, and origin ACS 2023
- Neighborhood character
- Predominantly White (93%)
- Race & ethnicity
- White 93% Two or more races 4% Black 2% Hispanic / Latino 2%
- Common ancestry
- Lithuanian 14% Slovak 3% Romanian 3%
- Foreign-born
- 3% · Canada
- Languages at home
- 97% English-only · Russian/Polish/Slavic 1% Spanish 1% French/Haitian/Cajun 1%
Political lean MEDSL · Chittenden
- 2024 margin
- Solid D (+53.6) · D 75.4% · R 21.7% · Other 2.9%
- 2008→2024 swing
- +8.9pp toward D · 2008: 44.8pp · 2024: 53.6pp
- All cycles
- 2024: D+53.6 2020: D+54.5 2016: D+46.8 2012: D+41.9 2008: D+44.8
Not yet ingested
- Civics
- —
Market trends
- HPI YoY
- ▼ -127.34%
- Current HPI
- 291.4868
- Rent YoY
- —
- Metro
- —
- State GDP YoY
- —
- F500 in state
- 0
Price history
+133.1% since first listed5 events — show timeline
- 2026-04-16 Pending — PrimeMLS
- 2026-04-13 Listed $97,900 PrimeMLS
- 2022-02-03 Sold (Public Records) $42,000 Public Records
- 2022-01-31 Listed $42,000 PrimeMLS
- 2022-01-31 Sold (MLS) $42,000 PrimeMLS
Property tax history
-1.4%/yrLatest (2024): $761 · +11.3% YoY. Source: county tax records.
Cash-flow waterfall
monthlySold comps — $/sqft
last 12 mo · ≤1 miLoading sold comps…