106 Hardrick Dr · Moncks Corner, SC
Flood risk 1/10 · Minimal
- FEMA flood zone
- X (unshaded)
- Chance of flooding over 30 yrs
- 0.0%
- Est. flood insurance / yr
- $507 – $1,088
Fire risk 4/10 · Minor
- Est. fire insurance / yr
- $783 – $1,453
Heat risk 8/10 · Major
- Hot days now (above 109°F)
- 7 days/yr
- Hot days in 30 yrs
- 17 days/yr
Wind risk 8/10 · Major
- Chance of severe wind over 30 yrs
- 97.0%
Air-quality risk 2/10 · Minimal
- Unhealthy air days now
- 2 days/yr
- Unhealthy air days in 30 yrs
- 2 days/yr
Risk factors via First Street. Map © Google.
Why this score? — see what drove the B grade
The composite is a weighted blend of 9 inputs, each scored 0–100. Each bar is that input's sub-score; the figure is the points it added to the 100-point composite (weight × sub-score).
- Cash flow +30.0/30.0
- 1% rule +10.0/10.0
- DSCR +10.0/10.0
- ARV discount +7.5/15.0
- Schools +3.6/10.0
- Livability +3.4/5.0
- Rent growth +3.2/5.0
- Condition / age +2.5/5.0
- Appreciation +0.0/10.0
$150,000
🖨 Deal sheet (PDF) 📄 Offer letter ✓ Due diligence
Listing remarks
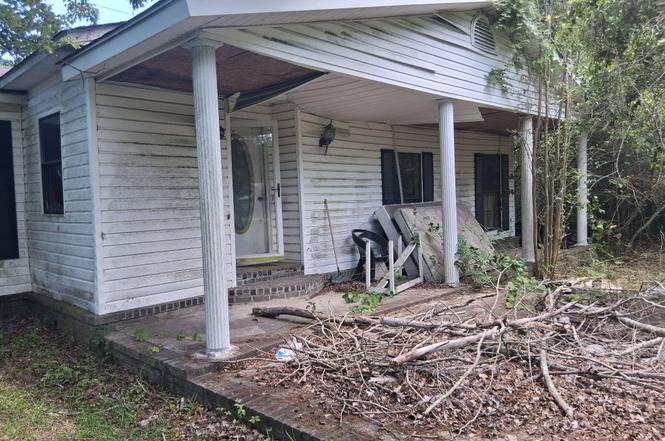
This 4 bedroom 2 bath home is sold AS-IS without appliance and HVAC system!!!!!
Key facts
- 0.43 acre lot
- Built 1986
- Listed 3 days
Property features AI
Finance
- Financial info: Investor-friendly: vacant 3-bed, 2-bath sold as-is with renovation/rental/resale potential
Exterior
- Utilities: Public sewer; Electric service: Berkeley Electric Co-Op
- Home design: Single-family detached residence; One and one-half levels; Ground-level entry
- Construction: No additional structures
- Exterior features: Asphalt roof; Lot under 0.5 acre
Interior
- Bedrooms: 3 bedrooms; Primary bedroom on lower level
- Flooring: Laminate flooring; Vinyl flooring; Wood flooring
- Bathrooms: 2 bathrooms
- Heating & cooling: Cooling: Other; Heating: See remarks
- Interior features: Living/dining combo; Upstairs section provides additional living space and flexibility
Neighborhood map
What this means for you Summary
Snapshot
- This is a 4-bed/2.0-bath single-family listed at $150k.
Deal economics
- At list price, monthly cash flow is $1k ($13k/yr) — positive.
- The deal already cash-flows at list — no discount required.
- Meets the 1% rule at list price ($3k rent vs $150k).
- Cap rate 15.0% vs local median 4.2% in Moncks Corner — top-decile yield for the area; either an underpriced asset or a hidden risk that comps aren't pricing in. Stress-test before assuming the spread holds.
Location & tenants
- Location reads 67/100 on livability (#99 in SC) — a middle-class / working-renter tenant base. Strengths: housing A+, health & safety A+, cost of living A; Watch: crime C-, amenities F, commute F.
- Berkeley 01 (suburban): math 35% / reading 48% proficiency, ranked #30 of 80 in SC (top 38%) — families likely to look elsewhere, expect single-tenant / working-renter base with shorter leases.
- Zoned schools: Moncks Corner Elementary (math 27% / reading 26%, grade F, #435 of 597 statewide, top 73%, 597 students, 100% FRL); Berkeley Middle (math 19% / reading 32%, grade F, #162 of 229 statewide, top 71%, 1,403 students, 57% FRL); Berkeley High (math 36% / reading 83%, grade C+, #110 of 196 statewide, top 58%, 1,776 students, 50% FRL) — zoned schools average 69% FRL vs 48% district-wide (21 pts higher); higher-poverty schools than district average — tighter screening recommended.
- Market conditions: Rents rising (+2.8%/yr); 644 active listings in the ZIP; 3 comparable units currently listed for rent nearby; rentals at typical pace (median 25d on market — plan ~3-4 weeks tenant-placement turnaround); solid renter incomes; 3,183 units permitted in Berkeley County in 2024 (580 in 5+ unit buildings).
- This rent runs 38% of the median local income ($83k/yr) — at the standard rent-burdened threshold; future hikes will face affordability resistance.
Forward outlook
- Local home prices are declining (-3.0%/yr); year-one equity from $1k of loan paydown is wiped out by about $4k of value loss. Plan a longer hold.
- Berkeley County population projected at +48% by 2050 — long-run rental-demand tailwind backs the buy-and-hold thesis.
- At projected returns (-3.0% appreciation + 2.8% rent growth), your $42k cash investment doubles in ~4 years — after that, you're playing with house money.
Negotiation context
- Only 4 days on market — expect competitive offers; lowballing is unlikely to land.
Risks & watch-outs
- Climate carrying-cost: severe wind risk, 97% chance of damaging wind over 30y; extreme-heat days projected 7→17/yr by 2055 (HVAC capex compounding) — expect insurance premiums to compound above CPI over the hold.
Questions for the listing agent
- Is there a deadline driving the sale (1031 exchange, divorce, estate, relocation)? That informs how much negotiation room exists.
- Schools are D-rated, which usually means shorter tenancies and higher turnover. Who's the typical renter profile here, and what's been the actual vacancy rate?
- What's the average days-on-market for RENTAL listings here right now (not sales)? A rising rental-DOM trend means longer vacancies and softer asking-rent achievability than the comps imply.
- What's the recent tenant-quality profile in this submarket — average credit score on applications, eviction rate, late-payment / NSF rate, and stable-employment percentage? A property-management company in the area should have these aggregated.
- How much new for-sale + rental construction is in the pipeline within 1–3 miles? Heavy new supply typically softens prices + rents 12–24 months out; constrained supply supports both.
Investment metrics
- 1% rule
- 1.73% ✓
- Cap rate
- 15.01%
- Cash-on-cash
- 31.14%
- DSCR
- 2.39
- GRM
- 4.8
CMA / ARV
- ARV (on-the-fly)
- $383,292
- Comps found
- 12
Show comp detail 12 sales within ~0.75 mi
| Address | Dist | Beds/Ba | Sqft | Sold | Price | $/sf | Match |
|---|---|---|---|---|---|---|---|
| 406 Peachwood Ln | 0.73mi | 4/2.0 | 2,032 (+0%) | 8mo | $412,400 | $203 | 59 |
| 409 Peachwood Ln | 0.68mi | 4/2.0 | 2,032 (+0%) | 14mo | $398,470 | $196 | 56 |
| 380 Willows Crescent Dr | 0.73mi | 4/2.0 | 2,032 (+0%) | 13mo | $419,900 | $207 | 55 |
| 185 Morning View Way | 0.71mi | 4/2.5 | 2,174 (+7%) | 6mo | $401,945 | $185 | 48 |
| 378 Willows Crescent Dr | 0.73mi | 4/2.5 | 2,174 (+7%) | 6mo | $401,945 | $185 | 47 |
| 355 Willows Crescent Dr | 0.63mi | 4/2.5 | 2,203 (+9%) | 11mo | $380,000 | $172 | 46 |
| 376 Willows Crescent Dr | 0.72mi | 4/3.0 | 1,882 (-7%) | 9mo | $440,085 | $234 | 43 |
| 384 Willows Crescent Dr | 0.74mi | 4/2.5 | 2,174 (+7%) | 12mo | $404,945 | $186 | 42 |
| 193 Morning View Way | 0.68mi | 4/3.0 | 2,270 (+12%) | 5mo | $429,900 | $189 | 41 |
| 205 Camellia Dr | 0.74mi | 3/3.0 (-1) | 1,973 (-3%) | 14mo | $515,000 | $261 | 40 |
| 306 Fairlawn Dr | 0.64mi | 3/1.5 (-1) | 1,810 (-11%) | 13mo | $318,000 | $176 | 34 |
| 382 Willows Crescent Dr | 0.74mi | 4/3.0 | 2,270 (+12%) | 12mo | $419,900 | $185 | 32 |
Match score weights: distance 35% · size 25% · config 20% · recency 20%. Top-matched comps best support the ARV.
Projected returns pro-forma
-3.0% appreciation · 2.77% rent growth · sell at horizon
- IRR
- 25.7%
- Equity multiple
- 2.06×
- Total profit
- $44,497
- Equity at exit
- $22,365
- IRR
- 33.2%
- Equity multiple
- 3.99×
- Total profit
- $125,641
- Equity at exit
- $12,969
Cash invested: $42,000 (down + closing). Projections, not guarantees.
Landlord ↔ Tenant lean methodology
- Overall (STATE)
- 90 Strongly Landlord-Friendly
- State South Carolina
- 90 Strongly Landlord-Friendly · R+6
- County
- — inherits STATE
- City
- — inherits STATE
ZIP-level market 29461
- Home prices YoY
- -13.9%
- Rents YoY
- 2.8%
- Active inventory
- 644
- Price-to-rent
- 4.8×
Monthly cashflow live
- Estimated rent
- $2,589 medium interval (Pro) →
- Mortgage (P&I)
- −$787
- Tax from tax record
- −$106 /mo · $1,275/yr
- Insurance
- −$62
- HOA
- −$0
- Vacancy / Maint / Mgmt
- −$544
- Net cashflow
- $1,090
Break-even live
Sensitivity live
| Price | -10% $1,175 | -5% $1,132 | +0% $1,090 | +5% $1,047 | +10% $1,005 |
|---|---|---|---|---|---|
| Rent | -10% $885 | -5% $988 | +0% $1,090 | +5% $1,192 | +10% $1,294 |
| Rate | -1.0pp $1,165 | -0.5pp $1,128 | base $1,090 | +0.5pp $1,051 | +1.0pp $1,011 |
UW: 25.0% down · 7.5% · 30yr · 1.5% tax · 5.0% vac · 8.0% maint · 8.0% mgmt
Financing live
Cash to close
- Down payment
- $37,500
- Closing costs
- $4,500
- Reserves months
- —
- Total cash needed
- —
Loan-product check · same deal, 3 products live
Conventional
25% down · 7.5% · 30yr
- Down + closing
- —
- Monthly P&I
- —
- Monthly cashflow
- —
- DSCR
- —
- Eligible?
- —
Personal DTI + credit; lowest rate.
DSCR
20% down · 8.5% · 30yr
- Down + closing
- —
- Monthly P&I
- —
- Monthly cashflow
- —
- DSCR
- —
- Eligible?
- —
No personal income docs; deal must DSCR.
Hard money
10% down · 12.0% · 12mo
- Down + closing
- —
- Monthly P&I
- —
- Monthly cashflow
- —
- DSCR
- —
- Eligible?
- —
Short-term bridge; refi at stabilization.
Rent comps 3 comps
| Address | Beds | Baths | Sqft | Rent | $/sqft | DOM | Units | Dist |
|---|---|---|---|---|---|---|---|---|
| 151 Morning View Way Moncks Corner, SC | 3.0 | 3.0 | 2209 | $2,350 | $1.06 | 24d | 1 | 0.79mi |
| 255 Mitton Rd Moncks Corner, SC | 3.0 | 2.0 | 1680 | $2,200 | $1.31 | 24d | 1 | 0.97mi |
| 121 Marigny St Moncks Corner, SC | 3.0–4.0 | 2.5 | 1875 | $2,435 | $1.30 | 3d | 9 | 1.14mi |
Listing history 4 events
-
2026-06-21remarks 79-char remark
-
2026-06-21statusdays on market $150,000 Active Under Contract 4 DOM
-
2026-06-18remarks 78-char remark
-
2026-06-18$150,000 Active 1 DOM
ⓘ Source: listings_history table (triggers on properties + properties_extension) + one-shot
backfill from property_details.listing_events for pre-trigger history.
Tax reassessment forecast SC · Resets to sale price
- Current annual tax
- $1,275 · $106/mo
- Projected year-2 tax
- $1,275 · $106/mo
- Expected delta
- $0/yr ($0/mo · 0.0%)
ⓘ Screening estimate from a state-policy table — verify with the county assessor before closing.
Climate risk First Street
- Flood 1/10 Low FEMA zone X (unshaded) · 0% chance over 30 yrs
- Wildfire 4/10 Moderate
- Heat 8/10 Severe 7 d/yr ≥109°F today · 17 d/yr by 30 yrs out
- Wind 8/10 Severe 97% chance of damaging wind over 30 yrs
- Air quality 2/10 Low 2 unhealthy d/yr today · 2 by 30 yrs out
Nearby sold comps map
Loading sold comps map…
Walkable amenities ~0.75 mi
Loading nearby amenities…
Taxation est. · year 1
- Rental income
- $31,067
- − Mortgage interest
- −$8,402
- − Property taxes
- −$1,275
- − Insurance
- −$750
- − Repairs & maintenance
- −$2,485
- − Management
- −$2,485
- − Depreciation
- −$4,364
- Taxable income
- $11,305
- Est. tax owed @ 24.0%
- −$2,713
- After-tax cash flow
- $10,365/yr
For passive investors: Depreciation is non-cash, so a rental often shows a tax loss while cash-flowing — sheltering income. Rental losses are passive: they offset passive income freely, and up to $25,000/yr can offset ordinary (W-2) income if you actively participate and your MAGI is under $100k (phasing out to $0 by $150k); unused losses carry forward. On sale, claimed depreciation is recaptured at up to 25%, and gains may owe capital-gains tax (a 1031 exchange can defer both). Figures are a year-1 estimate at your 24.0% rate — not tax advice; consult a CPA.
Schools (NCES district)
- District
- Berkeley 01
- NCES district ID
- 4501170
- Math proficiency
- 35% ▼ -8.00%
- Reading proficiency
- 48% ▼ -2.00%
- Median HH income
- $52,724
- Composite
- 35.95/100
- National rank
- #4799
- State rank
- #30 of 80 in SC
Livability — Moncks Corner
- Score
- 67/100
- State rank
- #99
- US rank
- #10812
Category grades
Schools grade is shown separately in the Schools card above.
Census & demographics
- Census place
- Moncks Corner, SC
- County
- Berkeley County · 198,768 people
- City population
- 43,816
- Metro
- Charleston-North Charleston, SC
- Population (ZIP)
- 43,816
- Household income
- $82,666
- Rent vs Own
- Severe rent burden
- 815.0
Population outlook (Berkeley County) Hauer SSP2
- Today (2025)
- 254,184 people
- By 2030
- 279,677 · +10.0%
- By 2040
- 329,379 · +29.6%
- By 2050
- 375,557 · +47.8%
- By 2075
- 476,740 · +87.6%
- By 2100
- 535,945 · +110.8%
Race, ethnicity, and origin ACS 2023
- Neighborhood character
- Majority White (61%)
- Race & ethnicity
- White 61% Black 29% Hispanic / Latino 6% Two or more races 5%
- Hispanic origin (detail)
- Mexican 2% Puerto Rican 2%
- Common ancestry
- Lithuanian 1% Slovak 1% Romanian 1%
- Foreign-born
- 3% · Canada
- Languages at home
- 96% English-only · Spanish 3%
Political lean MEDSL · Berkeley
- 2024 margin
- R (+16.3) · D 41.1% · R 57.4% · Other 1.4%
- 2008→2024 swing
- -3.2pp toward R · 2008: -13.1pp · 2024: -16.3pp
- All cycles
- 2024: R+16.3 2020: R+11.7 2016: R+17.4 2012: R+18.9 2008: R+13.1
Not yet ingested
- Civics
- —
Market trends
- HPI YoY
- ▼ -52.95%
- Current HPI
- 328.7212
- Rent YoY
- ▲ 2.77%
- Metro
- Charleston-North Charleston, SC
- State GDP YoY
- ▲ 4.51%
- F500 in state
- 2
Industry mix (Fortune 500 HQ in SC)
| Industry | F500 HQs | Revenue |
|---|---|---|
| Packaging | 1 | $7B |
|
||
Price history
1 event — show timeline
- 2026-06-17 Listed $150,000 Charleston Trident MLS
Property tax history
+9.3%/yrLatest (2025): $1,275 · +5.9% YoY. Source: county tax records.
Cash-flow waterfall
monthlySold comps — $/sqft
last 12 mo · ≤1 miLoading sold comps…