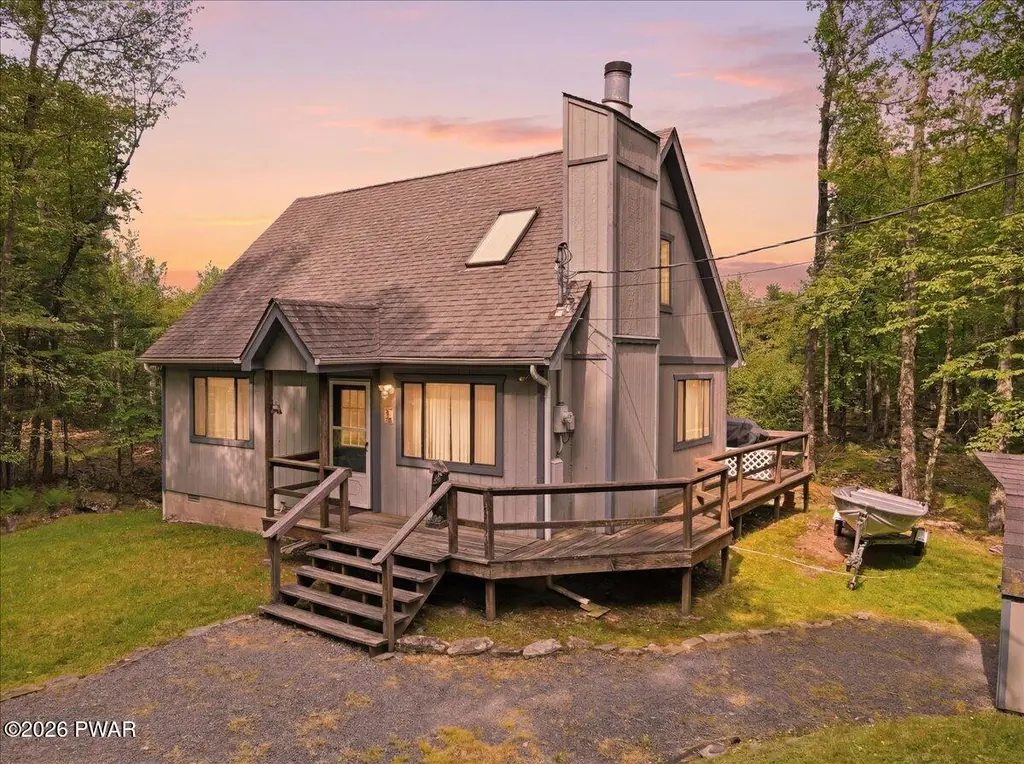
171 Fawn Rd · The Hideout, PA
Flood risk 4/10 · Minor
- FEMA flood zone
- X (unshaded)
- Chance of flooding over 30 yrs
- 0.2%
- Est. flood insurance / yr
- $507 – $1,088
Fire risk 1/10 · Minimal
- Est. fire insurance / yr
- $511 – $949
Heat risk 2/10 · Minimal
- Hot days now (above 90°F)
- 7 days/yr
- Hot days in 30 yrs
- 16 days/yr
Wind risk 2/10 · Minimal
- Chance of severe wind over 30 yrs
- 3.0%
Air-quality risk 2/10 · Minimal
- Unhealthy air days now
- 1 days/yr
- Unhealthy air days in 30 yrs
- 2 days/yr
Risk factors via First Street. Map © Google.
Why this score? — see what drove the B+ grade
The composite is a weighted blend of 9 inputs, each scored 0–100. Each bar is that input's sub-score; the figure is the points it added to the 100-point composite (weight × sub-score).
- Cash flow +25.1/30.0
- ARV discount +15.0/15.0
- Appreciation +10.0/10.0
- DSCR +8.2/10.0
- 1% rule +7.0/10.0
- Schools +4.4/10.0
- Livability +3.6/5.0
- Rent growth +2.5/5.0
- Condition / age +2.5/5.0
$180,000
🖨 Deal sheet 📄 Offer letter ✓ Due diligence
Listing remarks
This charming retreat is perfectly situated on a beautifully wooded lot, balancing peaceful seclusion with effortless accessibility to Lake Wallenpaupack area recreation. Whether you are searching for a permanent home or a serene weekend getaway, this property is designed to be your private sanctuary. Step inside to an inviting layout where warm, natural light complements a cozy mountain aesthetic. The spacious main living room serves as the central hub of the home, flowing seamlessly into a well-appointed kitchen and dining space that is ideal for entertaining. Generously sized bedroom and an additional large loft bedroom offer peaceful views of the surrounding mature trees, ensuring every
Key facts
- Quiet country road
- Wooded lot
- Swimming beaches
Tags
Property features AI
Finance
- HOA & community: Homeowners association with annual fee ($900, approximately $75/month); HOA includes snow removal; Community amenities: clubhouse, playground, park, lake; Association amenities include beach rights, recreation facilities, party room, playground
Exterior
- Utilities: Private well water; Septic tank (mound septic)
- Home design: Single Family Residence; Two levels
- Construction: Block foundation
- Exterior features: Asphalt roof; Shed(s); Has a view; Private maintained road with road maintenance agreement
Interior
- Flooring: Combination flooring
- Bathrooms: 1 full bathroom
- Heating & cooling: Baseboard heating; Electric heating
- Interior features: Combination flooring; Fireplace (1); Crawl space basement; Total of 4 rooms
Neighborhood map
What this means for you Summary
Snapshot
- This is a 2-bed/1.0-bath single-family listed at $180k.
Deal economics
- At list price, monthly cash flow is $398 ($5k/yr) — positive.
- The deal already cash-flows at list — no discount required.
- Meets the 1% rule at list price ($2k rent vs $180k).
- Cap rate 8.9% vs local median 5.0% in The Hideout — top-decile yield for the area; either an underpriced asset or a hidden risk that comps aren't pricing in. Stress-test before assuming the spread holds.
Location & tenants
- Location reads 72/100 on livability (#668 in PA) — a middle-class / working-renter tenant base. Strengths: crime A+, employment A+, cost of living A+; Watch: schools D, amenities F, commute F.
- Western Wayne SD (rural): math 39% / reading 63% proficiency, ranked #165 of 539 in PA (top 31%) — acceptable for families but not a draw, mixed tenant base, ~2y average lease.
- Market conditions: 371 active listings in the ZIP; 177 units permitted in Wayne County in 2024 (0 in 5+ unit buildings).
Forward outlook
- In year one you build about $19k of equity ($1k loan paydown + $18k appreciation (10.0% local appreciation)).
- Wayne County population projected at -17% by 2050 — secular population decline; favor cash flow + early exit over multi-decade hold.
- At projected returns (10.0% appreciation + 3.0% rent growth), your $50k cash investment doubles in ~2 years — after that, you're playing with house money.
- By year 2, paydown + projected appreciation supports a ~$31k cash-out refi (75% LTV) — recoverable capital for the next deal without selling this one.
Negotiation context
- Only 5 days on market — expect competitive offers; lowballing is unlikely to land.
- Current owner paid $56k; list at $180k implies a 224% gain — meaningful room to come down on a strong offer.
Questions for the listing agent
- What does the HOA fee cover, when was the last increase, and are there any pending special assessments or reserve-fund shortfalls?
- Is there a deadline driving the sale (1031 exchange, divorce, estate, relocation)? That informs how much negotiation room exists.
- Schools are D-rated, which usually means shorter tenancies and higher turnover. Who's the typical renter profile here, and what's been the actual vacancy rate?
- What's the average days-on-market for RENTAL listings here right now (not sales)? A rising rental-DOM trend means longer vacancies and softer asking-rent achievability than the comps imply.
- What's the recent tenant-quality profile in this submarket — average credit score on applications, eviction rate, late-payment / NSF rate, and stable-employment percentage? A property-management company in the area should have these aggregated.
- How much new for-sale + rental construction is in the pipeline within 1–3 miles? Heavy new supply typically softens prices + rents 12–24 months out; constrained supply supports both.
Investment metrics
- 1% rule
- 1.20% ✓
- Cap rate
- 8.94%
- Cash-on-cash
- 9.47%
- DSCR
- 1.42
- GRM
- 6.9
CMA / ARV
- ARV (on-the-fly)
- $264,600
- Comps found
- 12
Show comp detail 12 sales within ~0.75 mi
| Address | Dist | Beds/Ba | Sqft | Sold | Price | $/sf | Match |
|---|---|---|---|---|---|---|---|
| 300 S Fairway Dr | 0.13mi | 3/2.0 (+1) | 1,300 (+3%) | 12mo | $285,000 | $219 | 70 |
| 233 S Fairway Dr | 0.28mi | 3/2.0 (+1) | 1,252 (-1%) | 22mo | $215,000 | $172 | 58 |
| 37 Bear Dr | 0.71mi | 2/2.0 | 1,272 (+1%) | 6mo | $295,000 | $232 | 56 |
| 95 N Fairway Dr | 0.55mi | 2/2.0 | 1,288 (+2%) | 12mo | $270,000 | $210 | 56 |
| 174 N Fairway Dr | 0.19mi | 2/1.0 | 1,391 (+10%) | 23mo | $238,000 | $171 | 54 |
| 26 Navaho Ln | 0.47mi | 2/1.5 | 1,335 (+6%) | 22mo | $199,900 | $150 | 48 |
| 43 Bear Dr | 0.70mi | 3/2.0 (+1) | 1,235 (-2%) | 10mo | $299,900 | $243 | 46 |
| 16 Par Ct | 0.30mi | 3/2.0 (+1) | 1,444 (+15%) | 9mo | $250,000 | $173 | 45 |
| 75 Wedge Dr | 0.53mi | 3/1.0 (+1) | 1,209 (-4%) | 23mo | $160,000 | $132 | 44 |
| 31 Navaho Ln | 0.49mi | 3/2.0 (+1) | 1,116 (-11%) | 9mo | $265,000 | $237 | 42 |
| 36 Fawn Rd | 0.37mi | 3/1.5 (+1) | 1,100 (-13%) | 15mo | $235,000 | $214 | 42 |
| 19 Navaho Ln | 0.53mi | 3/2.0 (+1) | 1,315 (+4%) | 23mo | $209,000 | $159 | 40 |
Match score weights: distance 35% · size 25% · config 20% · recency 20%. Top-matched comps best support the ARV.
Projected returns pro-forma
10.0% appreciation · 3.0% rent growth · sell at horizon
- IRR
- 31.2%
- Equity multiple
- 3.45×
- Total profit
- $123,442
- Equity at exit
- $162,158
- IRR
- 27.0%
- Equity multiple
- 7.82×
- Total profit
- $343,745
- Equity at exit
- $349,700
Cash invested: $50,400 (down + closing). Projections, not guarantees.
Landlord ↔ Tenant lean methodology
- Overall (STATE)
- 62 Landlord-Friendly
- State Pennsylvania
- 62 Landlord-Friendly · EVEN
- County
- — inherits STATE
- City
- — inherits STATE
ZIP-level market 18428
- Home prices YoY
- 9.2%
- Active inventory
- 371
- Price-to-rent
- 6.9×
Monthly cashflow live
- Estimated rent
- $2,167 medium interval (Pro) →
- Mortgage (P&I)
- −$944
- Tax from tax record
- −$220 /mo · $2,641/yr
- Insurance
- −$75
- HOA
- −$75
- Vacancy / Maint / Mgmt
- −$455
- Net cashflow
- $398
Break-even live
UW: 25.0% down · 7.5% · 30yr · 1.5% tax · 5.0% vac · 8.0% maint · 8.0% mgmt
Financing live
Cash to close
- Down payment
- $45,000
- Closing costs
- $5,400
- Reserves months
- —
- Total cash needed
- —
Loan-product check · same deal, 3 products live
Conventional
25% down · 7.5% · 30yr
- Down + closing
- —
- Monthly P&I
- —
- Monthly cashflow
- —
- DSCR
- —
- Eligible?
- —
Personal DTI + credit; lowest rate.
DSCR
20% down · 8.5% · 30yr
- Down + closing
- —
- Monthly P&I
- —
- Monthly cashflow
- —
- DSCR
- —
- Eligible?
- —
No personal income docs; deal must DSCR.
Hard money
10% down · 12.0% · 12mo
- Down + closing
- —
- Monthly P&I
- —
- Monthly cashflow
- —
- DSCR
- —
- Eligible?
- —
Short-term bridge; refi at stabilization.
HOA detail
- Monthly dues
- $75 · $900/yr
Listing history 5 events
-
2026-06-15statusdays on market $180,000 Pending 5 DOM
-
2026-06-14days on market $180,000 Active 4 DOM
-
2026-06-13days on market $180,000 Active 3 DOM
-
2026-06-10remarks 699-char remark
-
2026-06-10$180,000 Active 1 DOM
ⓘ Source: listings_history table (triggers on properties + properties_extension) + one-shot
backfill from property_details.listing_events for pre-trigger history.
Tax reassessment forecast PA · Partial reset (capped growth)
- Current annual tax
- $2,641 · $220/mo
- Projected year-2 tax
- $2,743 · $229/mo
- Expected delta
- +$101/yr (+$8/mo · 3.8%)
ⓘ Screening estimate from a state-policy table — verify with the county assessor before closing.
Climate risk First Street
- Flood 4/10 Moderate FEMA zone X (unshaded) · 20% chance over 30 yrs
- Wildfire 1/10 Low
- Heat 2/10 Low 7 d/yr ≥90°F today · 16 d/yr by 30 yrs out
- Wind 2/10 Low 3% chance of damaging wind over 30 yrs
- Air quality 2/10 Low 1 unhealthy d/yr today · 2 by 30 yrs out
Nearby sold comps map
Loading sold comps map…
Walkable amenities ~0.75 mi
Loading nearby amenities…
Taxation est. · year 1
- Rental income
- $26,002
- − Mortgage interest
- −$10,083
- − Property taxes
- −$2,641
- − Insurance
- −$900
- − Repairs & maintenance
- −$2,080
- − Management
- −$2,080
- − HOA
- −$900
- − Depreciation
- −$5,236
- Taxable income
- $2,081
- Est. tax owed @ 24.0%
- −$500
- After-tax cash flow
- $4,274/yr
For passive investors: Depreciation is non-cash, so a rental often shows a tax loss while cash-flowing — sheltering income. Rental losses are passive: they offset passive income freely, and up to $25,000/yr can offset ordinary (W-2) income if you actively participate and your MAGI is under $100k (phasing out to $0 by $150k); unused losses carry forward. On sale, claimed depreciation is recaptured at up to 25%, and gains may owe capital-gains tax (a 1031 exchange can defer both). Figures are a year-1 estimate at your 24.0% rate — not tax advice; consult a CPA.
Schools (NCES district)
- District
- Western Wayne SD
- NCES district ID
- 4226070
- Math proficiency
- 39% ▼ -12.00%
- Reading proficiency
- 63% ▼ -6.00%
- Median HH income
- $51,358
- Composite
- 43.65/100
- National rank
- #2964
- State rank
- #165 of 539 in PA
Livability — The Hideout
- Score
- 72/100
- State rank
- #668
- US rank
- #6516
Category grades
Schools grade is shown separately in the Schools card above.
Census & demographics
- Population (ZIP)
- 12,446
Population outlook (Wayne County) Hauer SSP2
- Today (2025)
- 47,924 people
- By 2030
- 46,191 · -3.6%
- By 2040
- 42,815 · -10.7%
- By 2050
- 39,873 · -16.8%
- By 2075
- 34,556 · -27.9%
- By 2100
- 28,358 · -40.8%
Race, ethnicity, and origin ACS 2023
- Neighborhood character
- Predominantly White (85%)
- Race & ethnicity
- White 85% Hispanic / Latino 8% Two or more races 6% Black 1% Asian 1%
- Hispanic origin (detail)
- Puerto Rican 5%
- Common ancestry
- Romanian 5% Portuguese 3% Italian 2%
- Foreign-born
- 5% · Canada
- Languages at home
- 91% English-only · Spanish 5% Russian/Polish/Slavic 1% Other Asian/Pacific 1%
Political lean MEDSL · Wayne
- 2024 margin
- Solid R (+37.1) · D 31.1% · R 68.2%
- 2008→2024 swing
- -24.8pp toward R · 2008: -12.3pp · 2024: -37.1pp
- All cycles
- 2024: R+37.1 2020: R+33.6 2016: R+39.7 2012: R+20.9 2008: R+12.3
Not yet ingested
- Civics
- —
Market trends
- HPI YoY
- ▲ 28.60%
- Current HPI
- 340.8254
- Rent YoY
- —
- Metro
- —
- State GDP YoY
- ▲ 1.68%
- F500 in state
- 34
Industry mix (Fortune 500 HQ in PA)
| Industry | F500 HQs | Revenue |
|---|---|---|
| Healthcare | 2 | $309B |
|
||
| Insurance | 2 | $27B |
|
||
| Telecommunications / Media | 1 | $124B |
|
||
| Industrial Distribution | 1 | $22B |
|
||
| Financial Services | 1 | $20B |
|
||
| Chemicals / Materials | 1 | $18B |
|
||
Price history
+224.3% since first listed2 events — show timeline
- 2026-06-09 Listed $180,000 PWMLS
- 1995-09-01 Sold (Public Records) $55,500 Public Records
Property tax history
+3.1%/yrLatest (2026): $2,641 · +3.0% YoY. Source: county tax records.
Cash-flow waterfall
monthlySold comps — $/sqft
last 12 mo · ≤1 miLoading sold comps…