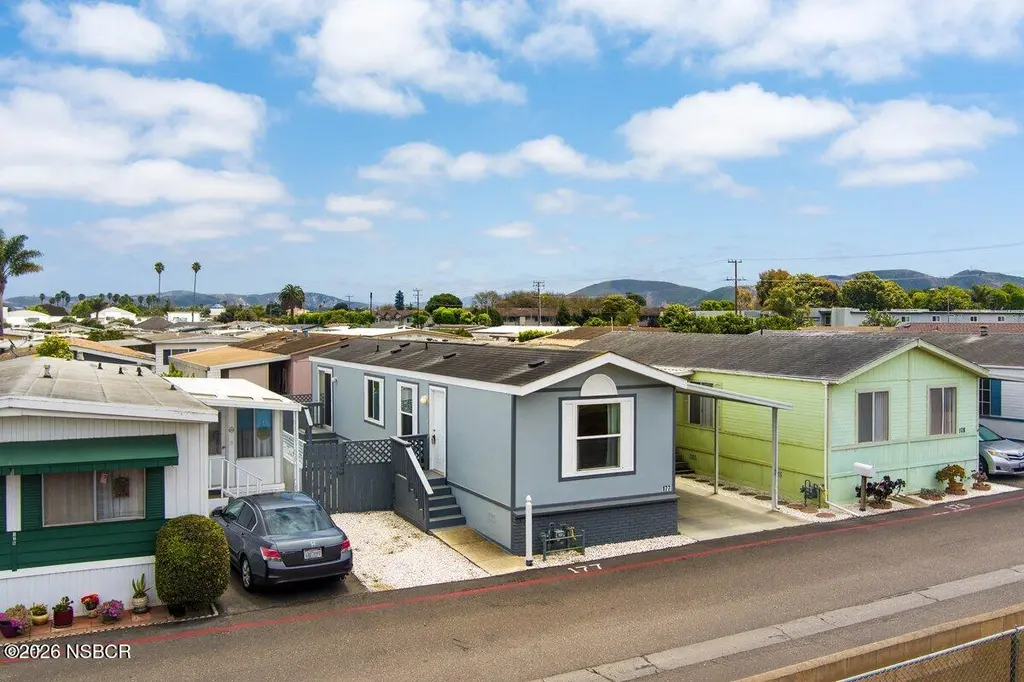
321 W North Ave #177 · Lompoc, CA
Flood risk 1/10 · Minimal
- FEMA flood zone
- X (shaded)
- Chance of flooding over 30 yrs
- 0.0%
- Est. flood insurance / yr
- $507 – $1,088
Fire risk 4/10 · Minor
- Est. fire insurance / yr
- $659 – $1,223
Heat risk 2/10 · Minimal
- Hot days now (above 84°F)
- 7 days/yr
- Hot days in 30 yrs
- 17 days/yr
Wind risk 1/10 · Minimal
- Chance of severe wind over 30 yrs
- —
Air-quality risk 6/10 · Moderate
- Unhealthy air days now
- 9 days/yr
- Unhealthy air days in 30 yrs
- 9 days/yr
Risk factors via First Street. Map © Google.
Why this score? — see what drove the C- grade
The composite is a weighted blend of 9 inputs, each scored 0–100. Each bar is that input's sub-score; the figure is the points it added to the 100-point composite (weight × sub-score).
- Cash flow +20.3/30.0
- 1% rule +8.5/10.0
- ARV discount +7.5/15.0
- DSCR +6.4/10.0
- Schools +3.4/10.0
- Rent growth +3.3/5.0
- Livability +2.8/5.0
- Condition / age +2.5/5.0
- Appreciation +0.0/10.0
$155,000
🖨 Deal sheet (PDF) 📄 Offer letter ✓ Due diligence
Listing remarks MLS
Newer Family park mobile home for sale !!!, built in 2009 this 756 square foot 1 bedroom 1 bath mobile features a large living and dining area.The master bedroom is large and spacious with a walk in closet and the master bathroom features a walk shower and tub. and shed will stay without warranty.There is also a very spacious carport!!! Del Norte Mobile Home Estates offers on-site management during the day, a pool, club house and is walking distance to convenience stores and elementary schools. Hurry this home will not last!
Key facts
- Sling glass door
- Laminate flooring
- Linen closet
Tags
Property features AI
Finance
- HOA & community: Association with monthly fee of $533; Association covers property management and common area maintenance; Community amenities include pool and clubhouse; Pets allowed with restrictions; Land lease $533
Exterior
- Parking: No street parking (other parking); Carport parking available (per directions)
- Utilities: Public water; Public sewer
- Home design: Manufactured home; Single-story (manufactured unit); Model: Golden Pacific; Make: CMH MFG WEST; Approx. length 54 ft, width 34 ft
- Construction: Axles foundation
- Exterior features: Shingle roof; Tool shed
Interior
- Flooring: Laminate flooring
- Bathrooms: 1 full bathroom
- Heating & cooling: Forced air heating; Natural gas heating
- Interior features: Breakfast bar
- Laundry & utility: Washer included; Dryer included; Refrigerator included
Neighborhood map
What this means for you Summary
Snapshot
- This is a 1-bed/1.0-bath manufactured listed at $155k.
Deal economics
- At list price, monthly cash flow is $197 ($2k/yr) — positive.
- The deal already cash-flows at list — no discount required.
- Meets the 1% rule at list price ($2k rent vs $155k).
- Recommended offer: $153k (1.5% below list) — sets the bar for market timing.
- Cap rate 7.8% vs local median 2.9% in Lompoc — top-decile yield for the area; either an underpriced asset or a hidden risk that comps aren't pricing in. Stress-test before assuming the spread holds.
Location & tenants
- Location reads 56/100 on livability (#786 in CA) — a working-class tenant base; expect higher turnover. Strengths: housing B+; Watch: crime D, amenities F, commute F.
- Lompoc Unified (suburban): math 29% / reading 44% proficiency, ranked #818 of 1,400 in CA (top 58%) — families likely to look elsewhere, expect single-tenant / working-renter base with shorter leases.
- Zoned schools: La Canada Elementary (592 students, 78% FRL); Lompoc Valley Middle (math 24% / reading 24%, grade F, #277 of 498 statewide, top 73%, 807 students, 74% FRL); Lompoc High (math 24% / reading 75%, grade D+, #332 of 1,170 statewide, top 30%, 1,690 students, 61% FRL) — zoned schools average 71% FRL vs 52% district-wide (19 pts higher); higher-poverty schools than district average — tighter screening recommended.
- Market conditions: Rents rising (+3.3%/yr); 155 active listings in the ZIP; 15 comparable units currently listed for rent nearby; rentals at typical pace (median 25d on market — plan ~3-4 weeks tenant-placement turnaround); solid renter incomes; 719 units permitted in Santa Barbara County in 2024 (217 in 5+ unit buildings).
- This rent runs 31% of the median local income ($80k/yr) — at the standard rent-burdened threshold; future hikes will face affordability resistance.
Forward outlook
- Local home prices are declining (-3.0%/yr); year-one equity from $1k of loan paydown is wiped out by about $5k of value loss. Plan a longer hold.
- Santa Barbara County population projected at +20% by 2050 — long-run rental-demand tailwind backs the buy-and-hold thesis.
Negotiation context
- It's been on market 16 days — a 2% lower offer ($153k) is reasonable based on typical stale-listing flexibility.
- 2 sale attempts since 3y ago; this cycle's ask has dropped $15k (9%) from the opening price — seller is motivated, your offer sets the floor, not the list.
- Current owner paid $105k; 48% above their basis — modest negotiation headroom, anchor on the comps not their cost.
Risks & watch-outs
- Watch-outs: HOA is 26% of rent.
Questions for the listing agent
- What does the HOA fee cover, when was the last increase, and are there any pending special assessments or reserve-fund shortfalls?
- Is there a deadline driving the sale (1031 exchange, divorce, estate, relocation)? That informs how much negotiation room exists.
- Schools are F-rated, which usually means shorter tenancies and higher turnover. Who's the typical renter profile here, and what's been the actual vacancy rate?
- Crime grade is D in this area — have there been break-ins, vandalism, or insurance claims at this property in the last 3 years? What carrier currently insures it and at what premium?
- What's the average days-on-market for RENTAL listings here right now (not sales)? A rising rental-DOM trend means longer vacancies and softer asking-rent achievability than the comps imply.
- What's the recent tenant-quality profile in this submarket — average credit score on applications, eviction rate, late-payment / NSF rate, and stable-employment percentage? A property-management company in the area should have these aggregated.
- How much new for-sale + rental construction is in the pipeline within 1–3 miles? Heavy new supply typically softens prices + rents 12–24 months out; constrained supply supports both.
Investment metrics
- 1% rule
- 1.35% ✓
- Cap rate
- 7.82%
- Cash-on-cash
- 5.46%
- DSCR
- 1.24
- GRM
- 6.2
CMA / ARV
No comps found within radius.
Projected returns pro-forma
-3.0% appreciation · 3.31% rent growth · sell at horizon
- IRR
- -7.2%
- Equity multiple
- 0.73×
- Total profit
- $-11,630
- Equity at exit
- $23,111
- IRR
- 3.1%
- Equity multiple
- 1.23×
- Total profit
- $9,834
- Equity at exit
- $13,402
Cash invested: $43,400 (down + closing). Projections, not guarantees.
Landlord ↔ Tenant lean methodology
- Overall (STATE)
- 18 Strongly Tenant-Friendly
- State California
- 18 Strongly Tenant-Friendly · D+13
- County
- — inherits STATE
- City
- — inherits STATE
ZIP-level market 93436
- Rents YoY
- 3.3%
- Active inventory
- 155
- Price-to-rent
- 6.2×
Monthly cashflow live
- Estimated rent
- $2,089 high interval (Pro) →
- Mortgage (P&I)
- −$813
- Tax from tax record
- −$43 /mo · $511/yr
- Insurance
- −$65
- HOA
- −$533
- Vacancy / Maint / Mgmt
- −$439
- Net cashflow
- $197
Break-even live
Sensitivity live
| Price | -10% $285 | -5% $241 | +0% $197 | +5% $153 | +10% $110 |
|---|---|---|---|---|---|
| Rent | -10% $32 | -5% $115 | +0% $197 | +5% $280 | +10% $362 |
| Rate | -1.0pp $275 | -0.5pp $237 | base $197 | +0.5pp $157 | +1.0pp $116 |
UW: 25.0% down · 7.5% · 30yr · 1.5% tax · 5.0% vac · 8.0% maint · 8.0% mgmt
Financing live
Cash to close
- Down payment
- $38,750
- Closing costs
- $4,650
- Reserves months
- —
- Total cash needed
- —
Loan-product check · same deal, 3 products live
Conventional
25% down · 7.5% · 30yr
- Down + closing
- —
- Monthly P&I
- —
- Monthly cashflow
- —
- DSCR
- —
- Eligible?
- —
Personal DTI + credit; lowest rate.
DSCR
20% down · 8.5% · 30yr
- Down + closing
- —
- Monthly P&I
- —
- Monthly cashflow
- —
- DSCR
- —
- Eligible?
- —
No personal income docs; deal must DSCR.
Hard money
10% down · 12.0% · 12mo
- Down + closing
- —
- Monthly P&I
- —
- Monthly cashflow
- —
- DSCR
- —
- Eligible?
- —
Short-term bridge; refi at stabilization.
Rent comps 15 comps
| Address | Beds | Baths | Sqft | Rent | $/sqft | DOM | Units | Dist |
|---|---|---|---|---|---|---|---|---|
| 404 W Barton Ave Unit 2 Lompoc, CA | 2.0 | 1.5 | 878 | $2,200 | $2.51 | 45d | 1 | 0.21mi |
| 401 W Pine Ave Lompoc, CA | 1.0–2.0 | 1.0 | 734 | $1,905 | $2.59 | 15d | 1 | 0.22mi |
| 804 W Nectarine Ave Lompoc, CA | 2.0 | 1.0 | 850 | $2,200 | $2.59 | 45d | 1 | 0.40mi |
| 423 N N St Lompoc, CA | 2.0 | 1.0 | 900 | $2,200 | $2.44 | 45d | 1 | 0.65mi |
| 321 N L St Unit C Lompoc, CA | 2.0 | 1.0 | 1100 | $2,400 | $2.18 | 25d | 1 | 0.74mi |
| 812 W Laurel Ave Lompoc, CA | 2.0 | 1.0 | 800 | $2,170 | $2.71 | 15d | 2 | 0.78mi |
| 324 W Chestnut Ave Lompoc, CA | 2.0 | 2.5 | 940 | $2,600 | $2.77 | 25d | 1 | 0.83mi |
| 925 W Chestnut Ave Lompoc, CA | 2.0 | 1.0 | 699 | $2,070 | $2.96 | 15d | 3 | 0.85mi |
| 960 W Chestnut Ave Unit 946-D Lompoc, CA | 2.0 | 1.0 | 800 | $2,050 | $2.56 | 25d | 1 | 0.90mi |
| 218 N C St Lompoc, CA | 2.0 | 1.0 | 950 | $1,875 | $1.97 | 25d | 1 | 1.10mi |
| 2220 Briar Creek Way Unit 2-107 Lompoc, CA | 1.0 | 1.0 | 655 | $2,200 | $3.36 | 45d | 1 | 1.20mi |
| 604 N 4th St Unit N604B Lompoc, CA | 2.0 | 1.0 | 800 | $2,300 | $2.88 | 45d | 1 | 1.20mi |
| 1113 W Cypress Ave Lompoc, CA | 2.0 | 1.5 | 953 | $2,500 | $2.62 | 15d | 1 | 1.24mi |
| 214 S F St #2 Lompoc, CA | 2.0 | 1.5 | 946 | $2,500 | $2.64 | 25d | 1 | 1.27mi |
| 505 N Sixth St Unit A Lompoc, CA | 2.0 | 1.0 | 600 | $2,000 | $3.33 | 15d | 1 | 1.34mi |
HOA detail
- Monthly dues
- $533 · $6,396/yr
- Likely covers
- pool
Listing history 12 events
-
2026-06-21pricedays on market $155,000 Active 16 DOM
-
2026-06-18days on market $170,000 Active 13 DOM
-
2026-06-17days on market $170,000 Active 12 DOM
-
2026-06-16days on market $170,000 Active 11 DOM
-
2026-06-15days on market $170,000 Active 10 DOM
-
2026-06-14days on market $170,000 Active 8 DOM
-
2026-06-13days on market $170,000 Active 7 DOM
-
2026-06-10days on market $170,000 Active 5 DOM
-
2026-06-09days on market $170,000 Active 4 DOM
-
2026-06-08days on market $170,000 Active 3 DOM
-
2026-06-07remarks 608-char remark
-
2026-06-07$170,000 Active 2 DOM
ⓘ Source: listings_history table (triggers on properties + properties_extension) + one-shot
backfill from property_details.listing_events for pre-trigger history.
Tax reassessment forecast CA · Resets to sale price
- Current annual tax
- $511 · $43/mo
- Projected year-2 tax
- $1,178 · $98/mo
- Expected delta
- +$667/yr (+$56/mo · 130.3%)
ⓘ Screening estimate from a state-policy table — verify with the county assessor before closing.
Climate risk First Street
- Flood 1/10 Low FEMA zone X (shaded) · 0% chance over 30 yrs
- Wildfire 4/10 Moderate
- Heat 2/10 Low 7 d/yr ≥84°F today · 17 d/yr by 30 yrs out
- Wind 1/10 Low
- Air quality 6/10 Major 9 unhealthy d/yr today · 9 by 30 yrs out
Nearby sold comps map
Loading sold comps map…
Walkable amenities ~0.75 mi
Loading nearby amenities…
Taxation est. · year 1
- Rental income
- $25,068
- − Mortgage interest
- −$8,682
- − Property taxes
- −$511
- − Insurance
- −$775
- − Repairs & maintenance
- −$2,005
- − Management
- −$2,005
- − HOA
- −$6,396
- − Depreciation
- −$4,509
- Taxable income
- $184
- Est. tax owed @ 24.0%
- −$44
- After-tax cash flow
- $2,324/yr
For passive investors: Depreciation is non-cash, so a rental often shows a tax loss while cash-flowing — sheltering income. Rental losses are passive: they offset passive income freely, and up to $25,000/yr can offset ordinary (W-2) income if you actively participate and your MAGI is under $100k (phasing out to $0 by $150k); unused losses carry forward. On sale, claimed depreciation is recaptured at up to 25%, and gains may owe capital-gains tax (a 1031 exchange can defer both). Figures are a year-1 estimate at your 24.0% rate — not tax advice; consult a CPA.
Schools (NCES district)
- District
- Lompoc Unified
- NCES district ID
- 0622410
- Math proficiency
- 29% ▲ 3.00%
- Reading proficiency
- 44% ▼ -2.00%
- Median HH income
- $53,716
- Composite
- 34.49/100
- National rank
- #10135
- State rank
- #818 of 1400 in CA
Livability — Lompoc
- Score
- 56/100
- State rank
- #786
- US rank
- #22552
Category grades
Schools grade is shown separately in the Schools card above.
Census & demographics
- Census place
- Lompoc, CA
- County
- Santa Barbara County · 410,380 people
- City population
- 55,820
- Metro
- Santa Maria-Santa Barbara, CA
- Population (ZIP)
- 55,820
- Household income
- $80,097
- Rent vs Own
- Severe rent burden
- 1845.0
Population outlook (Santa Barbara County) Hauer SSP2
- Today (2025)
- 484,679 people
- By 2030
- 505,323 · +4.3%
- By 2040
- 545,783 · +12.6%
- By 2050
- 584,263 · +20.5%
- By 2075
- 682,586 · +40.8%
- By 2100
- 723,188 · +49.2%
Race, ethnicity, and origin ACS 2023
- Neighborhood character
- Diverse neighborhood (Simpson 0.57)
- Race & ethnicity
- Hispanic / Latino 56% White 34% Two or more races 25% Black 3% Asian 3% Native American 2%
- Hispanic origin (detail)
- Mexican 49%
- Common ancestry
- Italian 2% Slovak 1% Lithuanian 1%
- Foreign-born
- 21% · Canada
- Languages at home
- 59% English-only · Spanish 37% Other Asian/Pacific 1% Tagalog/Filipino 1%
Political lean MEDSL · Santa Barbara
- 2024 margin
- Strong D (+26.7) · D 61.8% · R 35.1% · Other 3.1%
- 2008→2024 swing
- +3.8pp toward D · 2008: 22.9pp · 2024: 26.7pp
- All cycles
- 2024: D+26.7 2020: D+32.1 2016: D+28.2 2012: D+17.1 2008: D+22.9
Not yet ingested
- Civics
- —
Market trends
- HPI YoY
- ▼ -574.83%
- Current HPI
- 310.2366
- Rent YoY
- ▲ 3.31%
- Metro
- Santa Maria-Santa Barbara, CA
- State GDP YoY
- ▲ 3.21%
- F500 in state
- 116
Industry mix (Fortune 500 HQ in CA)
| Industry | F500 HQs | Revenue |
|---|---|---|
| Technology | 27 | $1,492B |
|
||
| Financial Services | 3 | $174B |
|
||
| Retail | 3 | $44B |
|
||
| Insurance | 3 | $26B |
|
||
| Media / Entertainment | 2 | $115B |
|
||
| Pharmaceuticals / Biotech | 2 | $62B |
|
||
Price history
+54.5% since first listed4 events — show timeline
- 2026-06-05 Listed $170,000 NSBCRMLS
- 2023-08-11 Sold (MLS) $105,000 NSBCRMLS
- 2023-07-22 Pending — NSBCRMLS
- 2023-06-21 Listed $110,000 NSBCRMLS
Property tax history
-2.8%/yrLatest (2025): $511 · +5.7% YoY. Source: county tax records.
Cash-flow waterfall
monthlySold comps — $/sqft
last 12 mo · ≤1 miLoading sold comps…