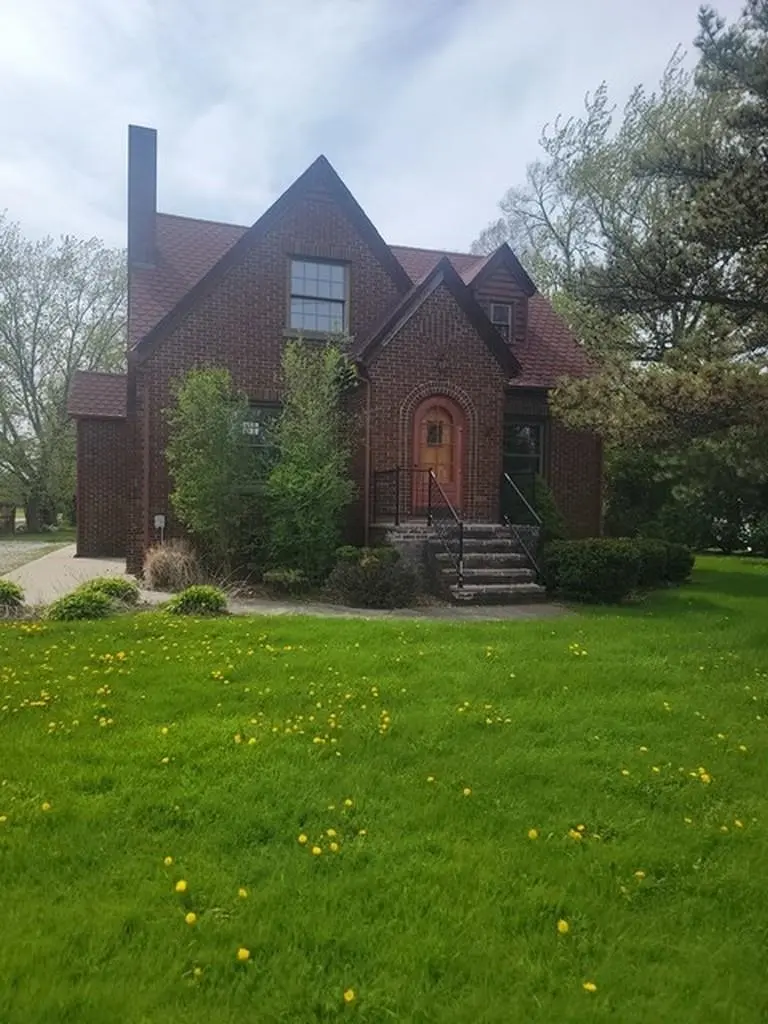
1910 S Reese Rd · Reese, MI
Flood risk 1/10 · Minimal
- FEMA flood zone
- X (unshaded)
- Chance of flooding over 30 yrs
- 0.0%
- Est. flood insurance / yr
- $473 – $860
Fire risk 1/10 · Minimal
- Est. fire insurance / yr
- $784 – $1,456
Heat risk 2/10 · Minimal
- Hot days now (above 98°F)
- 7 days/yr
- Hot days in 30 yrs
- 14 days/yr
Wind risk 1/10 · Minimal
- Chance of severe wind over 30 yrs
- —
Air-quality risk 2/10 · Minimal
- Unhealthy air days now
- 1 days/yr
- Unhealthy air days in 30 yrs
- 2 days/yr
Risk factors via First Street. Map © Google.
Why this score? — see what drove the B+ grade
The composite is a weighted blend of 9 inputs, each scored 0–100. Each bar is that input's sub-score; the figure is the points it added to the 100-point composite (weight × sub-score).
- Cash flow +30.0/30.0
- ARV discount +15.0/15.0
- 1% rule +10.0/10.0
- DSCR +10.0/10.0
- Schools +3.7/10.0
- Livability +3.6/5.0
- Rent growth +2.5/5.0
- Condition / age +2.5/5.0
- Appreciation +0.0/10.0
$80,000
🖨 Deal sheet (PDF) 📄 Offer letter ✓ Due diligence
Listing remarks
3 bedroom Tudor style home in Reese, Blumfield Township. 1403 sq ft of living space. Full basement and DEtached Garage for storage. Some wood floors Boiler system currently not functional. Stove, dishwasher. Reese schools. WWW. hudhomestore.com This home sold in AS-is Condition with NO repairs.
Key facts
- 0.68 acre lot
- Garage
- Built 1947
Property features AI
Exterior
- Parking: Detached garage with 1 parking space
- Utilities: Public water; Public sanitary sewer; Natural gas
- Home design: Residential 2-story home built in 1947; Basement entry/foundation
- Construction: Brick construction; Basement foundation; Built in 1947
- Exterior features: Brick exterior; Road frontage
Interior
- Kitchen: Main-level kitchen (16 x 10) with vinyl flooring
- Bedrooms: First-floor bedroom (11 x 10) with wood flooring; Second-floor bedroom (15 x 10) with wood flooring; Second-floor bedroom (approx. width 9) with wood flooring
- Flooring: Wood flooring in living room and bedrooms; Carpet in dining room; Vinyl in kitchen
- Bathrooms: One full bathroom; One additional lavatory (total two baths/lavatories)
- Heating & cooling: Boiler heating; Natural gas fuel
- Interior features: Fireplace in the family room; Full basement
- Laundry & utility: Basement utility access
Neighborhood map
What this means for you Summary
Snapshot
- This is a 3-bed/1.5-bath single-family listed at $80k.
Deal economics
- At list price, monthly cash flow is $430 ($5k/yr) — positive.
- The deal already cash-flows at list — no discount required.
- Meets the 1% rule at list price ($1k rent vs $80k).
Location & tenants
- Location reads 71/100 on livability (#284 in MI) — a middle-class / working-renter tenant base. Strengths: crime A+, cost of living A+, housing A+; Watch: health & safety C-, amenities F, commute F.
- Reese Public Schools (rural): math 38% / reading 49% proficiency, ranked #164 of 540 in MI (top 30%) — families likely to look elsewhere, expect single-tenant / working-renter base with shorter leases.
- Zoned schools: Reese Elementary School (math 47% / reading 47%, grade D-, #433 of 1,397 statewide, top 34%, 342 students, 64% FRL); Reese Middle School (math 32% / reading 42%, grade F, #248 of 493 statewide, top 53%, 148 students, 50% FRL); Reese High School (math 37% / reading 62%, grade D, #154 of 713 statewide, top 25%, 257 students, 47% FRL).
- Market conditions: 14 active listings in the ZIP; 154 units permitted in Saginaw County in 2024 (0 in 5+ unit buildings).
Forward outlook
- Local home prices are declining (-3.0%/yr); year-one equity from $553 of loan paydown is wiped out by about $2k of value loss. Plan a longer hold.
- Saginaw County population projected at -25% by 2050 — secular population decline; favor cash flow + early exit over multi-decade hold.
- At projected returns (-3.0% appreciation + 3.0% rent growth), your $22k cash investment doubles in ~6 years — after that, you're playing with house money.
Negotiation context
- Only 9 days on market — expect competitive offers; lowballing is unlikely to land.
- 6 sale attempts since 8y ago with the ask held roughly flat each time — persistent listings suggest the price (not the market) is what's stuck; bring a comps-based counter.
Risks & watch-outs
- Watch-outs: built in 1947 — expect roof / HVAC / electrical / plumbing capex.
Questions for the listing agent
- Built in 1947 — when were the roof, HVAC, electrical panel, plumbing, and water heater last replaced?
- Is there a deadline driving the sale (1031 exchange, divorce, estate, relocation)? That informs how much negotiation room exists.
- Schools are B-rated — typically a magnet for longer-tenancy family renters. What's the average tenant stay here, and is there a school-zone premium baked into asking?
- What's the average days-on-market for RENTAL listings here right now (not sales)? A rising rental-DOM trend means longer vacancies and softer asking-rent achievability than the comps imply.
- What's the recent tenant-quality profile in this submarket — average credit score on applications, eviction rate, late-payment / NSF rate, and stable-employment percentage? A property-management company in the area should have these aggregated.
- How much new for-sale + rental construction is in the pipeline within 1–3 miles? Heavy new supply typically softens prices + rents 12–24 months out; constrained supply supports both.
Investment metrics
- 1% rule
- 1.51% ✓
- Cap rate
- 12.74%
- Cash-on-cash
- 23.04%
- DSCR
- 2.03
- GRM
- 5.5
CMA / ARV
- ARV (median comp)
- $151,614
- List price
- $80,000
- Delta
- -47.23%
- Verdict
- UNDERPRICED
- Comps
- 20 within 1.0 mi
Show comp detail 9 sales within ~0.75 mi
| Address | Dist | Beds/Ba | Sqft | Sold | Price | $/sf | Match |
|---|---|---|---|---|---|---|---|
| 1910 S Reese Rd | 0.00mi | 3/1.5 | 1,403 (0%) | 0mo | $102,250 | $73 | 100 |
| 12895 E Washington Rd | 0.15mi | 3/1.0 | 1,370 (-2%) | 3mo | $220,000 | $161 | 85 |
| 9926 Center St | 0.18mi | 3/2.0 | 1,292 (-8%) | 1mo | $139,900 | $108 | 76 |
| 9978 Camp St | 0.27mi | 3/2.0 | 1,394 (-1%) | 12mo | $187,500 | $135 | 75 |
| 9981 North St | 0.10mi | 4/2.0 (+1) | 1,475 (+5%) | 12mo | $240,000 | $163 | 70 |
| 9920 Woodruff St | 0.27mi | 2/1.0 (-1) | 1,297 (-8%) | 16mo | $139,900 | $108 | 55 |
| 12890 Wadsworth Rd | 0.23mi | 2/1.0 (-1) | 1,248 (-11%) | 12mo | $145,000 | $116 | 54 |
| 1800 Meridian St | 0.47mi | 3/1.0 | 1,500 (+7%) | 23mo | $53,500 | $36 | 45 |
| 1703 Meridian St | 0.60mi | 3/1.0 | 1,300 (-7%) | 15mo | $167,500 | $129 | 45 |
Match score weights: distance 35% · size 25% · config 20% · recency 20%. Top-matched comps best support the ARV.
Projected returns pro-forma
-3.0% appreciation · 3.0% rent growth · sell at horizon
- IRR
- 16.0%
- Equity multiple
- 1.64×
- Total profit
- $14,426
- Equity at exit
- $11,928
- IRR
- 24.6%
- Equity multiple
- 3.14×
- Total profit
- $47,831
- Equity at exit
- $6,917
Cash invested: $22,400 (down + closing). Projections, not guarantees.
Landlord ↔ Tenant lean methodology
- Overall (STATE)
- 62 Landlord-Friendly
- State Michigan
- 62 Landlord-Friendly · EVEN
- County
- — inherits STATE
- City
- — inherits STATE
ZIP-level market 48757
- Home prices YoY
- -25.6%
- Active inventory
- 14
- Price-to-rent
- 5.5×
Monthly cashflow live
- Estimated rent
- $1,208 medium interval (Pro) →
- Mortgage (P&I)
- −$420
- Tax from tax record
- −$71 /mo · $854/yr
- Insurance
- −$33
- HOA
- −$0
- Vacancy / Maint / Mgmt
- −$254
- Net cashflow
- $430
Break-even live
Sensitivity live
| Price | -10% $475 | -5% $453 | +0% $430 | +5% $407 | +10% $385 |
|---|---|---|---|---|---|
| Rent | -10% $335 | -5% $382 | +0% $430 | +5% $478 | +10% $525 |
| Rate | -1.0pp $470 | -0.5pp $450 | base $430 | +0.5pp $409 | +1.0pp $388 |
UW: 25.0% down · 7.5% · 30yr · 1.5% tax · 5.0% vac · 8.0% maint · 8.0% mgmt
Financing live
Cash to close
- Down payment
- $20,000
- Closing costs
- $2,400
- Reserves months
- —
- Total cash needed
- —
Loan-product check · same deal, 3 products live
Conventional
25% down · 7.5% · 30yr
- Down + closing
- —
- Monthly P&I
- —
- Monthly cashflow
- —
- DSCR
- —
- Eligible?
- —
Personal DTI + credit; lowest rate.
DSCR
20% down · 8.5% · 30yr
- Down + closing
- —
- Monthly P&I
- —
- Monthly cashflow
- —
- DSCR
- —
- Eligible?
- —
No personal income docs; deal must DSCR.
Hard money
10% down · 12.0% · 12mo
- Down + closing
- —
- Monthly P&I
- —
- Monthly cashflow
- —
- DSCR
- —
- Eligible?
- —
Short-term bridge; refi at stabilization.
Listing history 16 events
-
2026-05-15status Pending 296-char remark
-
2026-05-04$80,000 Active 296-char remark
-
2022-05-24soldstatus $140,000
-
2020-06-13historical
-
2020-06-13historical
-
2019-11-12price $139,900
-
2019-11-11price $139,900
-
2019-07-24price $144,900
-
2019-07-24price $144,900
-
2019-06-13$149,900 Active
-
2019-06-13$149,900 Active
-
2019-03-28historical
-
2019-03-28historical
-
2018-12-30$157,500 Active
-
2018-12-30$157,500 Active
-
2011-07-27soldstatus $110,000
ⓘ Source: listings_history table (triggers on properties + properties_extension) + one-shot
backfill from property_details.listing_events for pre-trigger history.
Tax reassessment forecast MI · Partial reset (capped growth)
- Current annual tax
- $854 · $71/mo
- Projected year-2 tax
- $1,043 · $87/mo
- Expected delta
- +$189/yr (+$16/mo · 22.1%)
ⓘ Screening estimate from a state-policy table — verify with the county assessor before closing.
Climate risk First Street
- Flood 1/10 Low FEMA zone X (unshaded) · 0% chance over 30 yrs
- Wildfire 1/10 Low
- Heat 2/10 Low 7 d/yr ≥98°F today · 14 d/yr by 30 yrs out
- Wind 1/10 Low
- Air quality 2/10 Low 1 unhealthy d/yr today · 2 by 30 yrs out
Nearby sold comps map
Loading sold comps map…
Walkable amenities ~0.75 mi
Loading nearby amenities…
Taxation est. · year 1
- Rental income
- $14,492
- − Mortgage interest
- −$4,481
- − Property taxes
- −$854
- − Insurance
- −$400
- − Repairs & maintenance
- −$1,159
- − Management
- −$1,159
- − Depreciation
- −$2,327
- Taxable income
- $4,111
- Est. tax owed @ 24.0%
- −$987
- After-tax cash flow
- $4,174/yr
For passive investors: Depreciation is non-cash, so a rental often shows a tax loss while cash-flowing — sheltering income. Rental losses are passive: they offset passive income freely, and up to $25,000/yr can offset ordinary (W-2) income if you actively participate and your MAGI is under $100k (phasing out to $0 by $150k); unused losses carry forward. On sale, claimed depreciation is recaptured at up to 25%, and gains may owe capital-gains tax (a 1031 exchange can defer both). Figures are a year-1 estimate at your 24.0% rate — not tax advice; consult a CPA.
Schools (NCES district)
- District
- Reese Public Schools
- NCES district ID
- 2629520
- Math proficiency
- 38% ▼ -4.00%
- Reading proficiency
- 49% ▲ 2.00%
- Median HH income
- $47,888
- Composite
- 37.16/100
- National rank
- #4481
- State rank
- #164 of 540 in MI
Livability — Reese
- Score
- 71/100
- State rank
- #284
- US rank
- #7001
Category grades
Schools grade is shown separately in the Schools card above.
Census & demographics
- Population (ZIP)
- 3,680
Population outlook (Saginaw County) Hauer SSP2
- Today (2025)
- 180,568 people
- By 2030
- 172,302 · -4.6%
- By 2040
- 153,919 · -14.8%
- By 2050
- 135,519 · -24.9%
- By 2075
- 97,199 · -46.2%
- By 2100
- 65,037 · -64.0%
Race, ethnicity, and origin ACS 2023
- Neighborhood character
- Predominantly White (95%)
- Race & ethnicity
- White 95% Two or more races 3% Hispanic / Latino 2%
- Common ancestry
- Romanian 12% Lithuanian 5% Italian 2%
- Foreign-born
- 0%
- Languages at home
- 96% English-only · German/W. Germanic 3%
Political lean MEDSL · Saginaw
- 2024 margin
- Toss-up / Even · D 47.7% · R 51.0% · Other 1.4%
- 2008→2024 swing
- -20.6pp toward R · 2008: 17.3pp · 2024: -3.3pp
- All cycles
- 2024: R+3.3 2020: D+0.3 2016: R+1.1 2012: D+11.9 2008: D+17.3
Not yet ingested
- Civics
- —
Market trends
- HPI YoY
- ▼ -73.05%
- Current HPI
- 211.8754
- Rent YoY
- —
- Metro
- —
- State GDP YoY
- ▲ 1.37%
- F500 in state
- 28
Industry mix (Fortune 500 HQ in MI)
| Industry | F500 HQs | Revenue |
|---|---|---|
| Automotive Parts | 3 | $48B |
|
||
| Automotive | 2 | $372B |
|
||
| Chemicals | 1 | $45B |
|
||
| Automotive Retail | 1 | $29B |
|
||
| Healthcare / Medical Devices | 1 | $23B |
|
||
| Automotive Technology | 1 | $20B |
|
||
Price history
-7.0% since first listed19 events — show timeline
- 2026-06-16 Sold (MLS) $102,250 MiRealSource-MiMLS
- 2026-05-27 Pending — MiRealSource-MiMLS
- 2026-05-27 Relisted — MiRealSource-MiMLS
- 2026-05-15 Pending — MiRealSource-MiMLS
- 2026-05-04 Listed $80,000 MiRealSource-MiMLS
- 2022-05-24 Sold (Public Records) $140,000 Public Records
- 2020-06-13 Listing Removed — REALCOMP
- 2020-06-13 Listing Removed — MiRealSource-MiMLS
- 2019-11-12 Price Changed $139,900 MiRealSource-MiMLS
- 2019-11-11 Price Changed $139,900 REALCOMP
- 2019-07-24 Price Changed $144,900 MiRealSource-MiMLS
- 2019-07-24 Price Changed $144,900 REALCOMP
- 2019-06-13 Listed $149,900 MiRealSource-MiMLS
- 2019-06-13 Listed $149,900 REALCOMP
- 2019-03-28 Listing Removed — REALCOMP
- 2019-03-28 Listing Removed — MiRealSource-MiMLS
- 2018-12-30 Listed $157,500 MiRealSource-MiMLS
- 2018-12-30 Listed $157,500 REALCOMP
- 2011-07-27 Sold (Public Records) $110,000 Public Records
Property tax history
-5.1%/yrLatest (2025): $854 · -64.8% YoY. Source: county tax records.
Cash-flow waterfall
monthlySold comps — $/sqft
last 12 mo · ≤1 miLoading sold comps…