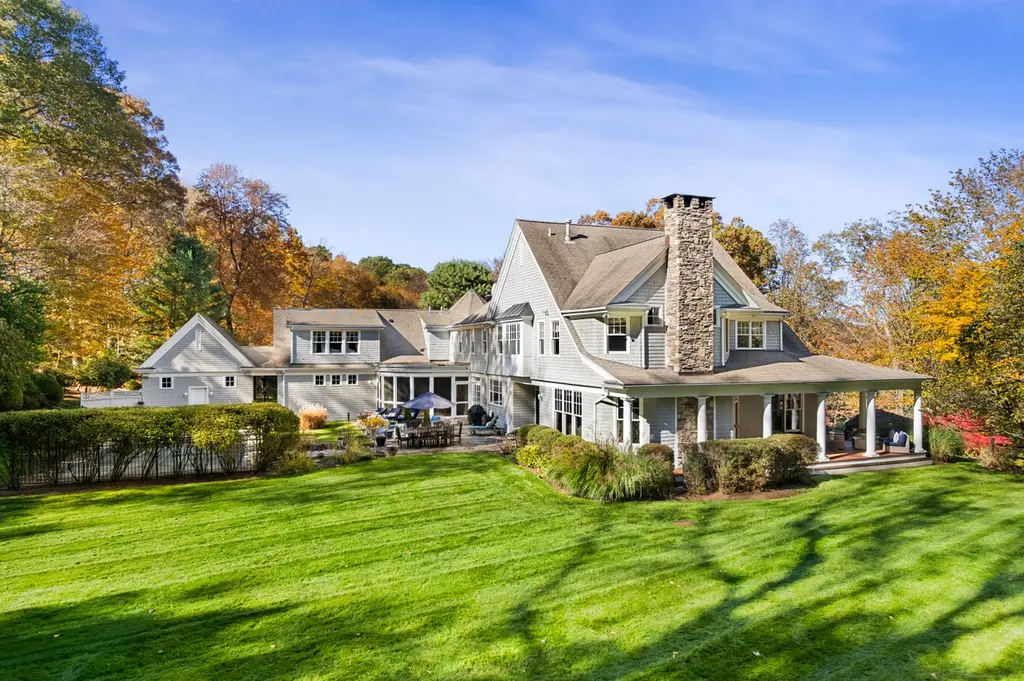
6 Winthrop Hls · Weston, CT
Flood risk No data
- FEMA flood zone
- —
- Chance of flooding over 30 yrs
- —
- Est. flood insurance / yr
- —
Fire risk No data
- Est. fire insurance / yr
- —
Heat risk No data
- Hot days now (above threshold)
- —
- Hot days in 30 yrs
- —
Wind risk No data
- Chance of severe wind over 30 yrs
- —
Air-quality risk No data
- Unhealthy air days now
- —
- Unhealthy air days in 30 yrs
- —
Risk factors via First Street. Map © Google.
Why this score? — see what drove the C- grade
The composite is a weighted blend of 9 inputs, each scored 0–100. Each bar is that input's sub-score; the figure is the points it added to the 100-point composite (weight × sub-score).
- Cash flow +22.1/30.0
- Schools +7.5/10.0
- DSCR +7.1/10.0
- 1% rule +5.7/10.0
- ARV discount +2.9/15.0
- Rent growth +2.5/5.0
- Livability +2.5/5.0
- Condition / age +2.5/5.0
- Appreciation +0.0/10.0
$2,350,000
🖨 Deal sheet (PDF) 📄 Offer letter ✓ Due diligence
Listing remarks
THANK YOU FOR YOUR INTEREST, SELLER REQUESTS HIGHEST/BEST OFFERS BY 5PM MONDAY 3/30. Welcome to this Modern Colonial, a sanctuary where luxury, comfort & tranquility converge on a premier cul-de-sac, conveniently located to the Merritt Parkway, Weston Center & the campus of award-winning schools and downtown Westport plus beaches. With 5 BRs plus a potential 6th BR/au-pair or in-law suite, this refined retreat offers elegant living & impressive entertaining. The newly reimagined kitchen is a showpiece of style & substance: a spacious island anchors the room, surrounded by premier appliances & abundant storage, all beautifully designed, expertly equipped, and re
Key facts
- 2.03 acre lot
- 4 garage spots
- Pool
Property features AI
Exterior
- Parking: Attached garage with 4 parking spaces
- Utilities: Private well water; Septic system; Oil hot water; Electric power (standard); Thermopane windows for energy efficiency
- Home design: Single-family home; Grey exterior
- Construction: Frame construction; Concrete foundation; Asphalt shingle roof; Wood and shingle siding
- Exterior features: Wrap-around porch including screened porch; Patio; Exterior lighting; Partially fenced, level lot on a cul-de-sac; Cleared and professionally landscaped; Beach rights; In-ground heated swimming pool
Interior
- Kitchen: Gas cooktop; Gas range; Microwave; Range hood; Refrigerator; Dishwasher
- Bedrooms: 5 bedrooms
- Bathrooms: 4 full bathrooms; 2 half bathrooms
- Heating & cooling: Central air with zoned cooling; Hot air heating; Oil-fired hot water; Above-ground fuel tank; Thermopane windows
- Interior features: Audio system; Cable available; Possible in-law apartment over the garage; Two fireplaces; Full, fully finished basement; 11 total rooms; Foyer, mud room, staff quarters
- Laundry & utility: Washer; Dryer; Upper-level laundry room
Neighborhood map
What this means for you Summary
Snapshot
- This is a 5-bed/5.0-bath single-family listed at $2.35M.
Deal economics
- At list price, monthly cash flow is $4k ($45k/yr) — positive.
- The deal already cash-flows at list — no discount required.
- Meets the 1% rule at list price ($25k rent vs $2.35M).
- Recommended offer: $2.28M (3.0% below list) — sets the bar for market timing.
- Cap rate 8.2% vs local median 2.9% in Weston — top-decile yield for the area; either an underpriced asset or a hidden risk that comps aren't pricing in. Stress-test before assuming the spread holds.
Location & tenants
- Location reads: area grade C — affects rentability + tenant quality, not the cash-flow math above.
- Weston School District (suburban): math 68% / reading 77% proficiency, ranked #4 of 153 in CT (top 3%) — strong family-tenant draw, lease renewals of 3-5y typical; only 1% free/reduced lunch — higher-income household profile.
- Zoned schools: Hurlbutt Elementary School (473 students, 1% FRL); Weston Middle School (math 60% / reading 73%, grade A-, #23 of 175 statewide, top 13%, 534 students, 1% FRL); Weston High School (math 82% / reading 87%, grade A, #1 of 194 statewide, top 1%, 722 students, 1% FRL) — zoned schools at 1% FRL track the district average.
- Market conditions: 73 active listings in the ZIP; 2 comparable units currently listed for rent nearby; 1,151 units permitted in Western Connecticut Planning Region in 2024 (714 in 5+ unit buildings).
Forward outlook
- Local home prices are declining (-3.0%/yr); year-one equity from $16k of loan paydown is wiped out by about $70k of value loss. Plan a longer hold.
Negotiation context
- It's been on market 55 days — a 3% lower offer ($2.28M) is reasonable based on typical stale-listing flexibility.
- 9 sale attempts since 21y ago with the ask held roughly flat each time — persistent listings suggest the price (not the market) is what's stuck; bring a comps-based counter.
Questions for the listing agent
- It's been on market 55 days. Have you received any prior offers? Is the seller open to a 3% concession, seller financing, or rate buy-down credit?
- Is there a deadline driving the sale (1031 exchange, divorce, estate, relocation)? That informs how much negotiation room exists.
- What's the average days-on-market for RENTAL listings here right now (not sales)? A rising rental-DOM trend means longer vacancies and softer asking-rent achievability than the comps imply.
- What's the recent tenant-quality profile in this submarket — average credit score on applications, eviction rate, late-payment / NSF rate, and stable-employment percentage? A property-management company in the area should have these aggregated.
- How much new for-sale + rental construction is in the pipeline within 1–3 miles? Heavy new supply typically softens prices + rents 12–24 months out; constrained supply supports both.
Investment metrics
- 1% rule
- 1.07% ✓
- Cap rate
- 8.22%
- Cash-on-cash
- 6.88%
- DSCR
- 1.31
- GRM
- 7.8
CMA / ARV
- ARV (on-the-fly)
- $2,132,196
- Comps found
- 5
Show comp detail 5 sales within ~0.75 mi
| Address | Dist | Beds/Ba | Sqft | Sold | Price | $/sf | Match |
|---|---|---|---|---|---|---|---|
| 6 Winthrop Hls | 0.00mi | 5/5.0 | 6,684 (0%) | 0mo | $2,400,000 | $359 | 100 |
| 10 Winthrop Hls | 0.01mi | 4/6.0 (-1) | 7,069 (+6%) | 13mo | $2,255,000 | $319 | 70 |
| 11 Winthrop Hls | 0.02mi | 5/5.0 | 6,131 (-8%) | 23mo | $2,006,000 | $327 | 66 |
| 17 Tannery Ln N | 0.37mi | 5/4.5 | 5,685 (-15%) | 12mo | $1,600,000 | $281 | 46 |
| 24 Oakwood Dr | 0.59mi | 6/7.0 (+1) | 6,891 (+3%) | 23mo | $1,775,000 | $258 | 35 |
Match score weights: distance 35% · size 25% · config 20% · recency 20%. Top-matched comps best support the ARV.
Projected returns pro-forma
-3.0% appreciation · 3.0% rent growth · sell at horizon
- IRR
- -5.7%
- Equity multiple
- 0.79×
- Total profit
- $-140,114
- Equity at exit
- $350,393
- IRR
- 3.9%
- Equity multiple
- 1.29×
- Total profit
- $188,656
- Equity at exit
- $203,185
Cash invested: $658,000 (down + closing). Projections, not guarantees.
Landlord ↔ Tenant lean methodology
- Overall (STATE)
- 27 Tenant-Leaning
- State Connecticut
- 27 Tenant-Leaning · D+7
- County
- — inherits STATE
- City
- — inherits STATE
ZIP-level market 06883
- Active inventory
- 73
- Price-to-rent
- 7.8×
Monthly cashflow live
- Estimated rent
- $25,106 medium interval (Pro) →
- Mortgage (P&I)
- −$12,324
- Tax from tax record
- −$2,756 /mo · $33,071/yr
- Insurance
- −$979
- HOA
- −$0
- Vacancy / Maint / Mgmt
- −$5,272
- Net cashflow
- $3,775
Break-even live
Sensitivity live
| Price | -10% $5,105 | -5% $4,440 | +0% $3,775 | +5% $3,110 | +10% $2,445 |
|---|---|---|---|---|---|
| Rent | -10% $1,791 | -5% $2,783 | +0% $3,775 | +5% $4,766 | +10% $5,758 |
| Rate | -1.0pp $4,958 | -0.5pp $4,373 | base $3,775 | +0.5pp $3,166 | +1.0pp $2,546 |
UW: 25.0% down · 7.5% · 30yr · 1.5% tax · 5.0% vac · 8.0% maint · 8.0% mgmt
Financing live
Cash to close
- Down payment
- $587,500
- Closing costs
- $70,500
- Reserves months
- —
- Total cash needed
- —
Loan-product check · same deal, 3 products live
Conventional
25% down · 7.5% · 30yr
- Down + closing
- —
- Monthly P&I
- —
- Monthly cashflow
- —
- DSCR
- —
- Eligible?
- —
Personal DTI + credit; lowest rate.
DSCR
20% down · 8.5% · 30yr
- Down + closing
- —
- Monthly P&I
- —
- Monthly cashflow
- —
- DSCR
- —
- Eligible?
- —
No personal income docs; deal must DSCR.
Hard money
10% down · 12.0% · 12mo
- Down + closing
- —
- Monthly P&I
- —
- Monthly cashflow
- —
- DSCR
- —
- Eligible?
- —
Short-term bridge; refi at stabilization.
Rent comps 2 comps
| Address | Beds | Baths | Sqft | Rent | $/sqft | DOM | Units | Dist |
|---|---|---|---|---|---|---|---|---|
| 29 Rogues Rdg Weston, CT | 6.0 | 6.5 | 7649 | $17,000 | $2.22 | 4d | 1 | 0.57mi |
| 37 Beaverbrook Rd Weston, CT | 5.0 | 4.5 | 6734 | $35,000 | $5.20 | 45d | 1 | 0.79mi |
Listing history 24 events
-
2026-05-21status Under Contract
-
2026-04-09historical Under Contract - Continue to Show
-
2026-03-27$2,350,000 Active
-
2026-03-19historical $2,350,000
-
2025-11-21historical
-
2025-10-23$2,099,000 Active
-
2025-07-22historical
-
2025-06-05price $2,190,000
-
2025-05-13price $2,300,000
-
2025-04-19$2,450,000 Active
-
2025-04-08historical
-
2024-11-02historical
-
2024-09-11historical $6,900
-
2024-07-13$2,385,000 Active
-
2024-07-10$6,900
-
2024-06-04historical $30,000
-
2024-06-03historical
-
2024-02-26$2,350,000 Active
-
2024-01-07$30,000
-
2024-01-07historical $7,500
-
2023-12-20$7,500
-
2005-09-19soldstatus $2,100,000
-
2005-09-19soldstatus $2,100,000
-
2005-04-21$2,225,000
ⓘ Source: listings_history table (triggers on properties + properties_extension) + one-shot
backfill from property_details.listing_events for pre-trigger history.
Tax reassessment forecast CT · Partial reset (capped growth)
- Current annual tax
- $33,071 · $2,756/mo
- Projected year-2 tax
- $41,680 · $3,473/mo
- Expected delta
- +$8,610/yr (+$717/mo · 26.0%)
ⓘ Screening estimate from a state-policy table — verify with the county assessor before closing.
Nearby sold comps map
Loading sold comps map…
Walkable amenities ~0.75 mi
Loading nearby amenities…
Taxation est. · year 1
- Rental income
- $301,269
- − Mortgage interest
- −$131,637
- − Property taxes
- −$33,071
- − Insurance
- −$11,750
- − Repairs & maintenance
- −$24,102
- − Management
- −$24,102
- − Depreciation
- −$68,364
- Taxable income
- $8,245
- Est. tax owed @ 24.0%
- −$1,979
- After-tax cash flow
- $43,319/yr
For passive investors: Depreciation is non-cash, so a rental often shows a tax loss while cash-flowing — sheltering income. Rental losses are passive: they offset passive income freely, and up to $25,000/yr can offset ordinary (W-2) income if you actively participate and your MAGI is under $100k (phasing out to $0 by $150k); unused losses carry forward. On sale, claimed depreciation is recaptured at up to 25%, and gains may owe capital-gains tax (a 1031 exchange can defer both). Figures are a year-1 estimate at your 24.0% rate — not tax advice; consult a CPA.
Schools (NCES district)
- District
- Weston School District
- NCES district ID
- 0905010
- Math proficiency
- 68% ▼ -6.00%
- Reading proficiency
- 77% ▼ -1.00%
- Median HH income
- $194,414
- Composite
- 75.21/100
- National rank
- #137
- State rank
- #4 of 153 in CT
Livability — Weston
No livability data for this city. (Only ~50 U.S. cities are tracked.)
Census & demographics
- Population (ZIP)
- 10,335
Population outlook (Western Connecticut County) Hauer SSP2
- By 2040
- 685,031
Race, ethnicity, and origin ACS 2023
- Neighborhood character
- Predominantly White (78%)
- Race & ethnicity
- White 78% Two or more races 10% Hispanic / Latino 9% Asian 5% Black 3%
- Hispanic origin (detail)
- Mexican 1% Puerto Rican 2% Dominican 1% Salvadoran 2%
- Common ancestry
- Romanian 7% Scotch-Irish 5% Italian 5%
- Foreign-born
- 16% · Canada, China, Dominican Republic
- Languages at home
- 83% English-only · Spanish 5% Chinese 3% Other Indo-European 3%
Political lean MEDSL · Western Connecticut
- 2024 margin
- D (+19.1) · D 58.8% · R 39.7% · Other 1.6%
- All cycles
- 2024: D+19.1
Not yet ingested
- Civics
- —
Market trends
- HPI YoY
- ▼ -316.44%
- Current HPI
- 208.835
- Rent YoY
- —
- Metro
- —
- State GDP YoY
- ▲ 1.06%
- F500 in state
- 38
Industry mix (Fortune 500 HQ in CT)
| Industry | F500 HQs | Revenue |
|---|---|---|
| Industrial Machinery | 4 | $38B |
|
||
| Insurance | 3 | $71B |
|
||
| Financial Services | 2 | $25B |
|
||
| Transportation / Logistics | 2 | $18B |
|
||
| Healthcare | 1 | $247B |
|
||
| Telecommunications | 1 | $55B |
|
||
Price history
+5.6% since first listed24 events — show timeline
- 2026-05-21 Pending — Smart MLS
- 2026-04-09 Contingent — Smart MLS
- 2026-03-27 Listed $2,350,000 Smart MLS
- 2026-03-19 Coming Soon $2,350,000 Smart MLS
- 2025-11-21 Listing Removed — Smart MLS
- 2025-10-23 Listed $2,099,000 Smart MLS
- 2025-07-22 Listing Removed — Smart MLS
- 2025-06-05 Price Changed $2,190,000 Smart MLS
- 2025-05-13 Price Changed $2,300,000 Smart MLS
- 2025-04-19 Listed $2,450,000 Smart MLS
- 2025-04-08 Coming Soon — Smart MLS
- 2024-11-02 Listing Removed — Smart MLS
- 2024-09-11 Rental Removed $6,900 SMARTMLS
- 2024-07-13 Listed $2,385,000 Smart MLS
- 2024-07-10 Listed for Rent $6,900 SMARTMLS
- 2024-06-04 Rental Removed $30,000 SMARTMLS
- 2024-06-03 Listing Removed — Smart MLS
- 2024-02-26 Listed $2,350,000 Smart MLS
- 2024-01-07 Listed for Rent $30,000 SMARTMLS
- 2024-01-07 Rental Removed $7,500 SMARTMLS
- 2023-12-20 Listed for Rent $7,500 SMARTMLS
- 2005-09-19 Sold (Public Records) $2,100,000 Public Records
- 2005-09-19 Sold (MLS) $2,100,000 Smart MLS
- 2005-04-21 Listed $2,225,000 Smart MLS
Property tax history
+0.6%/yrLatest (2023): $33,071 · +0.3% YoY. Source: county tax records.
Cash-flow waterfall
monthlySold comps — $/sqft
last 12 mo · ≤1 miLoading sold comps…