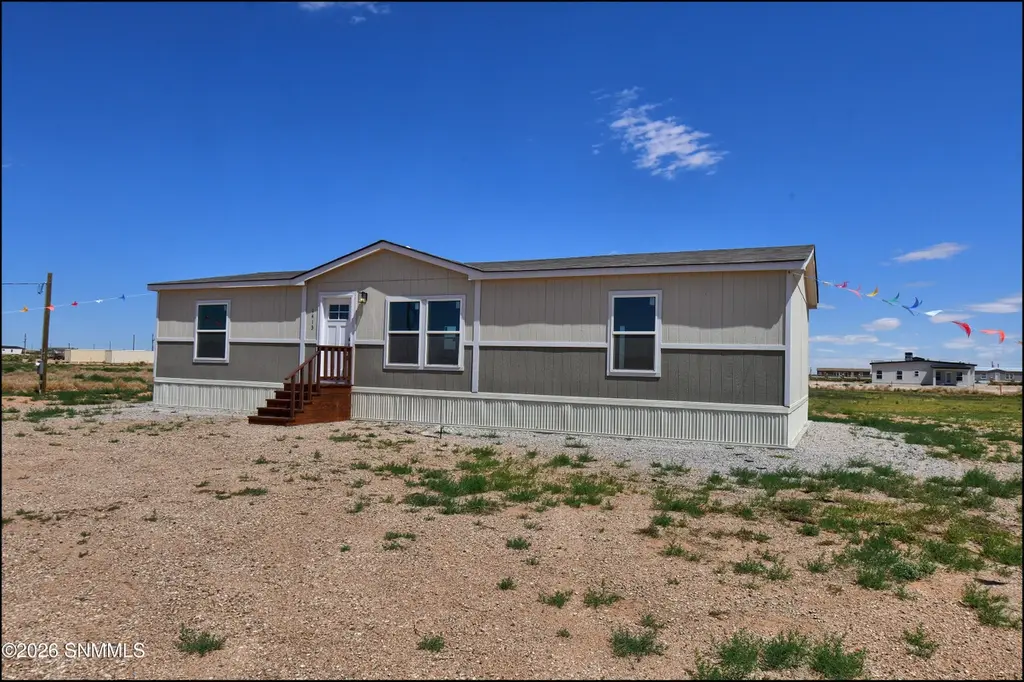
1413 Gobi Desert Dr · El Paso, TX
Flood risk 6/10 · Moderate
- FEMA flood zone
- X (shaded)
- Chance of flooding over 30 yrs
- 0.74%
- Est. flood insurance / yr
- $507 – $1,088
Fire risk 3/10 · Minor
- Est. fire insurance / yr
- $1,222 – $2,270
Heat risk 5/10 · Moderate
- Hot days now (above threshold)
- 4 days/yr
- Hot days in 30 yrs
- 4 days/yr
Wind risk 1/10 · Minimal
- Chance of severe wind over 30 yrs
- —
Air-quality risk 3/10 · Minor
- Unhealthy air days now
- 2 days/yr
- Unhealthy air days in 30 yrs
- 2 days/yr
Risk factors via First Street. Map © Google.
Why this score? — see what drove the D grade
The composite is a weighted blend of 9 inputs, each scored 0–100. Each bar is that input's sub-score; the figure is the points it added to the 100-point composite (weight × sub-score).
- Cash flow +13.7/30.0
- ARV discount +7.5/15.0
- Condition / age +4.2/5.0
- DSCR +4.1/10.0
- Livability +4.0/5.0
- 1% rule +3.8/10.0
- Schools +2.7/10.0
- Rent growth +2.5/5.0
- Appreciation +0.0/10.0
$249,500
🖨 Deal sheet (PDF) 📄 Offer letter ✓ Due diligence
Listing remarks
Great opportunity to own a never occupied PERMANENT double wide on concrete runners Wind Zone II Clayton Home on a 1.01 acre lot. Transferable Home Warranty until 2028! Featuring 3 bed, 2 bath, 1512 sq ft, a large open floor plan with living, dining and kitchen with a nice sized island and stainless-steel appliances, large laundry area, and a zoned primary bedroom. Primary bedroom has an ensuite with double sinks, garden tub and shower. All rooms have walk in closets. Refrigerated Air, natural gas furnace, natural gas water heater, energy smart package, low e Thermopane double pane windows, community water, septic system.
Key facts
- Double wide
- Never occupied
- Wind zone ii
Tags
Property features AI
Finance
- Other: Lot approximately 1.01 acres; Located in Chaparral Desert Hills subdivision
Exterior
- Utilities: Public water; Septic tank sewer
- Home design: Manufactured home (double wide); Single level
- Construction: Wood siding; Composition/asphalt shingle roof; Built by Clayton Homes
- Exterior features: Has a view; Horses allowed
Interior
- Kitchen: Dishwasher; Gas range; Refrigerator
- Bathrooms: 2 full bathrooms
- Heating & cooling: Central air conditioning; Forced air heating
- Interior features: Open floorplan; Breakfast bar; Eat-in kitchen; Kitchen island; Pantry; Walk-in closet(s); Double pane windows; Low emissivity windows
- Laundry & utility: Gas water heater
Neighborhood map
What this means for you Summary
Snapshot
- This is a 3-bed/2.0-bath manufactured listed at $250k. Condition is rated good.
Deal economics
- At list price, monthly cash flow is $16 ($195/yr) — positive.
- The deal already cash-flows at list — no discount required.
- To meet the 1% rule (rent ≥ 1% of price), the offer needs to be $220k (11.7% below list).
- Recommended offer: $220k (11.7% below list) — sets the bar for 1% rule.
Location & tenants
- Location reads 81/100 on livability (#23 in TX, #1,375 nationally) — a professional / high-income tenant draw. Strengths: commute A+, cost of living A+, housing A+; Watch: employment D+.
- El Paso ISD (urban): math 27% / reading 37% proficiency, ranked #591 of 826 in TX (top 72%) — families likely to look elsewhere, expect single-tenant / working-renter base with shorter leases; 65% free/reduced lunch — lower-income household profile, screen leases tightly.
- Zoned schools: Tippin El (math 53% / reading 60%, grade C+, #559 of 4,322 statewide, top 13%, 672 students, 31% FRL); Hornedo Middle (math 61% / reading 61%, grade B+, #145 of 1,662 statewide, top 9%, 1,296 students, 37% FRL); Franklin H S (math 45% / reading 63%, grade C-, #422 of 1,632 statewide, top 26%, 3,149 students, 54% FRL) — zoned schools average 41% FRL vs 65% district-wide (24 pts lower); this property's tenant base skews higher-income than the district average.
- Zoned-school proficiency averages 57% at this address vs 32% district-wide (+25 pts) — the actual schools serving this property are materially stronger than the El Paso ISD average implies; a family-tenant draw the district grade alone would hide.
- Market conditions: 47 active listings in the ZIP; 38 comparable units currently listed for rent nearby; rentals at typical pace (median 17d on market — plan ~3-4 weeks tenant-placement turnaround); 2,196 units permitted in El Paso County in 2024 (143 in 5+ unit buildings).
Forward outlook
- Local home prices are declining (-3.0%/yr); year-one equity from $2k of loan paydown is wiped out by about $7k of value loss. Plan a longer hold.
- El Paso County population projected at +10% by 2050 — modest demand growth; plan on rents tracking national, not racing it.
Negotiation context
- It's been on market 37 days — a 3% lower offer ($242k) is reasonable based on typical stale-listing flexibility.
Risks & watch-outs
- Climate carrying-cost: major flood risk — expect insurance premiums to compound above CPI over the hold.
Questions for the listing agent
- It's been on market 37 days. Have you received any prior offers? Is the seller open to a 12% concession, seller financing, or rate buy-down credit?
- Is there a deadline driving the sale (1031 exchange, divorce, estate, relocation)? That informs how much negotiation room exists.
- Schools are B-rated — typically a magnet for longer-tenancy family renters. What's the average tenant stay here, and is there a school-zone premium baked into asking?
- The area grade is low — what's the realistic commute time and amenity access for the typical tenant pool here? Any planned neighborhood developments (good or bad) we should know about?
- What's the average days-on-market for RENTAL listings here right now (not sales)? A rising rental-DOM trend means longer vacancies and softer asking-rent achievability than the comps imply.
- What's the recent tenant-quality profile in this submarket — average credit score on applications, eviction rate, late-payment / NSF rate, and stable-employment percentage? A property-management company in the area should have these aggregated.
- How much new for-sale + rental construction is in the pipeline within 1–3 miles? Heavy new supply typically softens prices + rents 12–24 months out; constrained supply supports both.
Investment metrics
- 1% rule
- 0.88% ✗
- Cap rate
- 6.37%
- Cash-on-cash
- 0.28%
- DSCR
- 1.01
- GRM
- 9.4
CMA / ARV
No comps found within radius.
Projected returns pro-forma
-3.0% appreciation · 3.0% rent growth · sell at horizon
- IRR
- -15.8%
- Equity multiple
- 0.44×
- Total profit
- $-39,362
- Equity at exit
- $37,201
- IRR
- -7.4%
- Equity multiple
- 0.53×
- Total profit
- $-32,809
- Equity at exit
- $21,572
Cash invested: $69,860 (down + closing). Projections, not guarantees.
Landlord ↔ Tenant lean methodology
- Overall (STATE)
- 87 Strongly Landlord-Friendly
- State Texas
- 87 Strongly Landlord-Friendly · R+5
- County
- — inherits STATE
- City
- — inherits STATE
ZIP-level market 79922
- Home prices YoY
- -11.5%
- Active inventory
- 47
- Price-to-rent
- 9.4×
Monthly cashflow live
- Estimated rent
- $2,203 high interval (Pro) →
- Mortgage (P&I)
- −$1,308
- Tax est. 1.5%
- −$312 /mo · $3,742/yr
- Insurance
- −$104
- HOA
- −$0
- Vacancy / Maint / Mgmt
- −$463
- Net cashflow
- $16
Break-even live
Sensitivity live
| Price | -10% $189 | -5% $102 | +0% $16 | +5% $-70 | +10% $-156 |
|---|---|---|---|---|---|
| Rent | -10% $-158 | -5% $-71 | +0% $16 | +5% $103 | +10% $190 |
| Rate | -1.0pp $142 | -0.5pp $80 | base $16 | +0.5pp $-48 | +1.0pp $-114 |
UW: 25.0% down · 7.5% · 30yr · 1.5% tax · 5.0% vac · 8.0% maint · 8.0% mgmt
Financing live
Cash to close
- Down payment
- $62,375
- Closing costs
- $7,485
- Reserves months
- —
- Total cash needed
- —
Loan-product check · same deal, 3 products live
Conventional
25% down · 7.5% · 30yr
- Down + closing
- —
- Monthly P&I
- —
- Monthly cashflow
- —
- DSCR
- —
- Eligible?
- —
Personal DTI + credit; lowest rate.
DSCR
20% down · 8.5% · 30yr
- Down + closing
- —
- Monthly P&I
- —
- Monthly cashflow
- —
- DSCR
- —
- Eligible?
- —
No personal income docs; deal must DSCR.
Hard money
10% down · 12.0% · 12mo
- Down + closing
- —
- Monthly P&I
- —
- Monthly cashflow
- —
- DSCR
- —
- Eligible?
- —
Short-term bridge; refi at stabilization.
Rent comps 38 comps
| Address | Beds | Baths | Sqft | Rent | $/sqft | DOM | Units | Dist |
|---|---|---|---|---|---|---|---|---|
| 1409 Black Ridge Dr El Paso, TX | 4.0 | 2.0 | 1860 | $2,500 | $1.34 | 45d | 1 | 0.14mi |
| 1316 Black Ridge Dr El Paso, TX | 3.0 | 2.5 | 1997 | $2,900 | $1.45 | 4d | 1 | 0.15mi |
| 6809 Pearl Ridge Dr El Paso, TX | 4.0 | 2.0 | 2217 | $2,450 | $1.11 | 12d | 1 | 0.27mi |
| 7125 Tierra Taos Dr El Paso, TX | 4.0 | 2.5 | 2159 | $2,000 | $0.93 | 25d | 1 | 0.32mi |
| 1229 Diamond Cove Pl El Paso, TX | 4.0 | 2.5 | 2082 | $2,700 | $1.30 | 45d | 1 | 0.32mi |
| 1521 Rosenbaum Ln El Paso, TX | 3.0 | 2.0 | 2120 | $2,100 | $0.99 | 4d | 1 | 0.38mi |
| 6763 Dakota Ridge Dr El Paso, TX | 4.0 | 2.5 | 1929 | $2,400 | $1.24 | 4d | 1 | 0.40mi |
| 7121 Luz de Espejo Dr El Paso, TX | 3.0 | 2.5 | 1863 | $2,150 | $1.15 | 21d | 1 | 0.41mi |
| 1120 Coyote Ln El Paso, TX | 3.0 | 2.0 | 1274 | $1,575 | $1.24 | 12d | 1 | 0.44mi |
| 7239 Desert Jewel Dr El Paso, TX | 3.0 | 2.0 | 1659 | $2,000 | $1.21 | 16d | 1 | 0.47mi |
| 1301 Tierra Roja St El Paso, TX | 4.0 | 2.5 | 2110 | $2,250 | $1.07 | 45d | 1 | 0.49mi |
| 1470 Senda del Sol El Paso, TX | 4.0 | 2.0 | 1572 | $2,000 | $1.27 | 45d | 1 | 0.53mi |
| 1101 Will Rand Dr El Paso, TX | 4.0 | 2.0 | 1491 | $1,950 | $1.31 | 13d | 1 | 0.68mi |
| 7311 Corona del Sol El Paso, TX | 3.0 | 2.5 | 2239 | $2,500 | $1.12 | 4d | 1 | 0.70mi |
| 1025 Jan Ellyn Ln El Paso, TX | 3.0 | 2.5 | 1860 | $1,895 | $1.02 | 45d | 1 | 0.70mi |
| 6700 Cabana del Sol El Paso, TX | 4.0 | 3.0 | 2124 | $2,445 | $1.15 | 5d | 1 | 0.71mi |
| 7243 Canyon Wren Ave El Paso, TX | 4.0 | 3.0 | 2027 | $2,355 | $1.16 | 45d | 1 | 0.73mi |
| 1549 Cherokee Ridge Dr El Paso, TX | 4.0 | 2.5 | 1892 | $2,250 | $1.19 | 4d | 1 | 0.83mi |
| 7324 Canyon Run Dr El Paso, TX | 3.0 | 2.0 | 1070 | $1,800 | $1.68 | 25d | 1 | 0.86mi |
| 6401 Franklin Ridge Dr El Paso, TX | 3.0 | 3.0 | 1499 | $2,300 | $1.53 | 12d | 1 | 0.93mi |
| 1485 Desierto Rico Ave El Paso, TX | 3.0 | 2.0 | 1787 | $1,850 | $1.04 | 5d | 1 | 1.03mi |
| 7445 Luz de Lumbre Ave El Paso, TX | 3.0 | 2.5 | 1543 | $2,300 | $1.49 | 16d | 1 | 1.08mi |
| 7448 Plaza Taurina Dr El Paso, TX | 3.0 | 2.5 | 1634 | $2,300 | $1.41 | 5d | 1 | 1.11mi |
| 926 Agua Caliente Dr Unit A El Paso, TX | 3.0 | 2.0 | 1480 | $1,700 | $1.15 | 5d | 1 | 1.13mi |
| 1529 Plaza Verde Dr El Paso, TX | 4.0 | 2.0 | 1721 | $1,950 | $1.13 | 25d | 1 | 1.17mi |
| 7528 Luz de Lumbre Ave El Paso, TX | 3.0 | 2.0 | 1772 | $1,790 | $1.01 | 5d | 1 | 1.21mi |
| 538 Olmeca Dr El Paso, TX | 3.0 | 2.5 | 1648 | $1,700 | $1.03 | 16d | 1 | 1.25mi |
| 7548 Plaza Taurina Dr El Paso, TX | 3.0 | 2.0 | 1454 | $2,050 | $1.41 | 16d | 1 | 1.26mi |
| 7316 Brays Landing Dr El Paso, TX | 4.0 | 3.0 | 2208 | $2,550 | $1.15 | 16d | 1 | 1.30mi |
| 727 Arredondo Dr El Paso, TX | 3.0 | 2.0 | 1051 | $1,790 | $1.70 | 45d | 1 | 1.36mi |
| 7399 Black Mesa Dr El Paso, TX | 3.0 | 3.5 | 2081 | $2,350 | $1.13 | 16d | 1 | 1.38mi |
| 712 Arredondo Dr El Paso, TX | 3.0 | 1.5 | 1265 | $1,500 | $1.19 | 5d | 1 | 1.41mi |
| 7049 Westwind Dr Apt 4022 El Paso, TX | 2.0 | 2.0 | 1181 | $1,256 | $1.06 | 25d | 1 | 1.42mi |
| 7049 Westwind Dr Apt 3008 El Paso, TX | 2.0 | 2.0 | 1181 | $1,280 | $1.08 | 5d | 1 | 1.42mi |
| 7049 Westwind Dr Apt 2024 El Paso, TX | 2.0 | 2.0 | 1181 | $1,200 | $1.02 | 45d | 1 | 1.42mi |
| 7049 Westwind Dr Apt 4020 El Paso, TX | 2.0 | 2.0 | 1181 | $1,255 | $1.06 | 45d | 1 | 1.42mi |
| 7049 Westwind Dr Apt 3006 El Paso, TX | 2.0 | 2.0 | 1181 | $1,350 | $1.14 | 45d | 1 | 1.42mi |
| 7379 Black Mesa Dr El Paso, TX | 3.0 | 2.0 | 1872 | $2,350 | $1.26 | 45d | 1 | 1.44mi |
Listing history 17 events
-
2026-06-21days on market $249,500 Active 37 DOM
-
2026-06-18days on market $249,500 Active 34 DOM
-
2026-06-17days on market $249,500 Active 33 DOM
-
2026-06-16days on market $249,500 Active 32 DOM
-
2026-06-15days on market $249,500 Active 31 DOM
-
2026-06-13days on market $249,500 Active 29 DOM
-
2026-06-13days on market $249,500 Active 28 DOM
-
2026-06-10days on market $249,500 Active 26 DOM
-
2026-06-09days on market $249,500 Active 25 DOM
-
2026-06-08days on market $249,500 Active 24 DOM
-
2026-06-07days on market $249,500 Active 23 DOM
-
2026-06-05days on market $249,500 Active 20 DOM
-
2026-06-03days on market $249,500 Active 19 DOM
-
2026-06-03days on market $249,500 Active 18 DOM
-
2026-06-01days on market $249,500 Active 17 DOM
-
2026-05-31days on market $249,500 Active 16 DOM
-
2026-05-15$249,500 Active 629-char remark
ⓘ Source: listings_history table (triggers on properties + properties_extension) + one-shot
backfill from property_details.listing_events for pre-trigger history.
Climate risk First Street
- Flood 6/10 Major FEMA zone X (shaded) · 74% chance over 30 yrs
- Wildfire 3/10 Moderate
- Heat 5/10 Major
- Wind 1/10 Low
- Air quality 3/10 Moderate 2 unhealthy d/yr today · 2 by 30 yrs out
Nearby sold comps map
Loading sold comps map…
Walkable amenities ~0.75 mi
Loading nearby amenities…
Taxation est. · year 1
- Rental income
- $26,438
- − Mortgage interest
- −$13,976
- − Property taxes
- −$3,742
- − Insurance
- −$1,248
- − Repairs & maintenance
- −$2,115
- − Management
- −$2,115
- − Depreciation
- −$7,258
- Taxable loss
- −$4,016
- Est. tax savings @ 24.0%
- +$964
- After-tax cash flow
- $1,159/yr
For passive investors: Depreciation is non-cash, so a rental often shows a tax loss while cash-flowing — sheltering income. Rental losses are passive: they offset passive income freely, and up to $25,000/yr can offset ordinary (W-2) income if you actively participate and your MAGI is under $100k (phasing out to $0 by $150k); unused losses carry forward. On sale, claimed depreciation is recaptured at up to 25%, and gains may owe capital-gains tax (a 1031 exchange can defer both). Figures are a year-1 estimate at your 24.0% rate — not tax advice; consult a CPA.
Condition & rehab AI · 30 photos
This home is in excellent condition with a modern kitchen and bathrooms, and is ready for immediate occupancy. It has a good condition score of 85 and is a great investment opportunity.
Value-add opportunities
- Both Painting the exterior and interior walls — Fresh paint can enhance curb appeal and interior aesthetics.
- Both Landscaping the front yard — Landscaping can improve curb appeal and add value to the property.
Renovation cost estimate screening
Value-add ROI direction
- Both Painting the exterior and interior walls — Fresh paint can enhance curb appeal and interior aesthetics. ↑
- Both Landscaping the front yard — Landscaping can improve curb appeal and add value to the property. ↑
ⓘ Cost ranges are severity-bucket heuristics (US national rule-of-thumb). Get contractor quotes + a written scope before underwriting a rehab budget.
Schools (NCES district)
- District
- El Paso ISD
- NCES district ID
- 4818300
- Math proficiency
- 27% ▼ -24.00%
- Reading proficiency
- 37% ▼ -7.00%
- Median HH income
- $38,704
- Composite
- 26.75/100
- National rank
- #7138
- State rank
- #591 of 826 in TX
Livability — El Paso
- Score
- 81/100
- State rank
- #23
- US rank
- #1375
Category grades
Schools grade is shown separately in the Schools card above.
Census & demographics
- Census place
- El Paso, TX
- City population
- 630,223
- Population (ZIP)
- 7,162
Population outlook (El Paso County) Hauer SSP2
- Today (2025)
- 897,899 people
- By 2030
- 922,694 · +2.8%
- By 2040
- 960,492 · +7.0%
- By 2050
- 982,919 · +9.5%
- By 2075
- 997,266 · +11.1%
- By 2100
- 900,630 · +0.3%
Race, ethnicity, and origin ACS 2023
- Neighborhood character
- Predominantly Hispanic (70%)
- Race & ethnicity
- Hispanic / Latino 70% Two or more races 37% White 26% Native American 1%
- Hispanic origin (detail)
- Mexican 66% Salvadoran 1%
- Common ancestry
- Slovak 2% Lithuanian 2% Dutch 1%
- Foreign-born
- 12% · Canada, Dominican Republic
- Languages at home
- 42% English-only · Spanish 57% Arabic 1%
Political lean MEDSL · El Paso
- 2024 margin
- D (+15.1) · D 57.0% · R 41.8% · Other 1.2%
- 2008→2024 swing
- -17.4pp toward R · 2008: 32.5pp · 2024: 15.1pp
- All cycles
- 2024: D+15.1 2020: D+35.1 2016: D+43.2 2012: D+32.6 2008: D+32.5
Not yet ingested
- Civics
- —
Market trends
- HPI YoY
- ▼ -35.14%
- Current HPI
- 271.3738
- Rent YoY
- —
- Metro
- —
- State GDP YoY
- ▲ 3.95%
- F500 in state
- 110
Industry mix (Fortune 500 HQ in TX)
| Industry | F500 HQs | Revenue |
|---|---|---|
| Energy | 16 | $1,198B |
|
||
| Technology | 5 | $198B |
|
||
| Engineering / Construction | 4 | $72B |
|
||
| Energy Services | 3 | $60B |
|
||
| Utilities | 3 | $41B |
|
||
| Healthcare | 2 | $330B |
|
||
Price history
1 event — show timeline
- 2026-05-15 Listed $249,500 SNMMLS as distributed by MLS GRID
Cash-flow waterfall
monthlySold comps — $/sqft
last 12 mo · ≤1 miLoading sold comps…