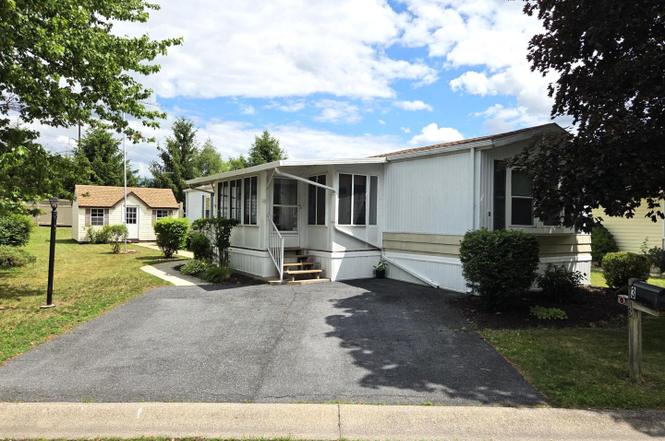
3 Meadow Run Pl · West Hanover, PA
Flood risk 1/10 · Minimal
- FEMA flood zone
- X (unshaded)
- Chance of flooding over 30 yrs
- 0.0%
- Est. flood insurance / yr
- $473 – $860
Fire risk 1/10 · Minimal
- Est. fire insurance / yr
- $511 – $949
Heat risk 5/10 · Moderate
- Hot days now (above 100°F)
- 7 days/yr
- Hot days in 30 yrs
- 15 days/yr
Wind risk 3/10 · Minor
- Chance of severe wind over 30 yrs
- 7.0%
Air-quality risk 3/10 · Minor
- Unhealthy air days now
- 2 days/yr
- Unhealthy air days in 30 yrs
- 4 days/yr
Risk factors via First Street. Map © Google.
Why this score? — see what drove the B- grade
The composite is a weighted blend of 9 inputs, each scored 0–100. Each bar is that input's sub-score; the figure is the points it added to the 100-point composite (weight × sub-score).
- Cash flow +30.0/30.0
- 1% rule +10.0/10.0
- DSCR +10.0/10.0
- ARV discount +7.5/15.0
- Schools +3.6/10.0
- Rent growth +2.9/5.0
- Livability +2.5/5.0
- Condition / age +2.5/5.0
- Appreciation +0.0/10.0
$64,900
🖨 Deal sheet (PDF) 📄 Offer letter ✓ Due diligence
Listing remarks MLS
Beautiful 55+ community. 2 spacious bedrooms, 2 bathrooms, and a bumped out living room for more space. New roof in 2017. Laundry area, storage shed, and 2 car driveway. Enjoy the outdoors on the enclosed sunroom or back deck. $475 lot rent includes water. $1000 towards carpet replacement and one year home warranty included.
Key facts
- Screened front porch
- Off street parking
- Water heater
Tags
Property features AI
Finance
- Financial info: Improvement assessed value noted by assessor
- HOA & community: Ground rent of $738 paid monthly; Senior community with 55+ age requirement; Property manager present; Pets allowed with number limit
Exterior
- Parking: Off-street parking for 2 vehicles (total 2 garage/parking spaces)
- Utilities: Public sewer; Community water; Electric service
- Home design: Manufactured home (single wide, Schultz); Assessor provided year built; Located in a 55+ senior community; Ground rent ownership
- Construction: Metal siding; Single wide mobile home — 14 ft by 70 ft
- Exterior features: Porch(es), including screened porch; Bump-outs; Shed
Interior
- Kitchen: Kitchen (appliances not specified)
- Bedrooms: 2 bedrooms on the main level
- Flooring: Luxury vinyl plank
- Bathrooms: 2 full bathrooms (both on the main level)
- Heating & cooling: Forced air heating (natural gas); Central air conditioning (electric); Electric hot water
- Interior features: Luxury vinyl plank flooring; Screened porch
- Laundry & utility: Main floor laundry
Neighborhood map
What this means for you Summary
Snapshot
- This is a 2-bed/1.0-bath manufactured listed at $65k.
Deal economics
- At list price, monthly cash flow is $754 ($9k/yr) — positive.
- The deal already cash-flows at list — no discount required.
- Meets the 1% rule at list price ($1k rent vs $65k).
Location & tenants
- Location reads: area grade B — affects rentability + tenant quality, not the cash-flow math above.
- Central Dauphin SD (suburban): math 30% / reading 52% proficiency, ranked #305 of 539 in PA (top 57%) — families likely to look elsewhere, expect single-tenant / working-renter base with shorter leases.
- Zoned schools: Central Dauphin Shs (math 71% / reading 24%, grade D, #164 of 437 statewide, top 38%, 1,975 students, 33% FRL) — zoned schools at 33% FRL track the district average.
- Market conditions: Rents rising (+1.6%/yr); 311 active listings in the ZIP; 2 comparable units currently listed for rent nearby; solid renter incomes; 540 units permitted in Dauphin County in 2024 (194 in 5+ unit buildings).
- This rent is only 17% of the median local income ($104k/yr) — well below the 30% rent-burden line; pricing power to push rent on renewal without tenant pushback.
Forward outlook
- Local home prices are declining (-3.0%/yr); year-one equity from $449 of loan paydown is wiped out by about $2k of value loss. Plan a longer hold.
- At projected returns (-3.0% appreciation + 1.6% rent growth), your $18k cash investment doubles in ~3 years — after that, you're playing with house money.
Negotiation context
- Only 3 days on market — expect competitive offers; lowballing is unlikely to land.
- 7 sale attempts since 22y ago with the ask held roughly flat each time — persistent listings suggest the price (not the market) is what's stuck; bring a comps-based counter.
- Current owner paid $28k; list at $65k implies a 136% gain — meaningful room to come down on a strong offer.
Risks & watch-outs
- Climate carrying-cost: extreme-heat days projected 7→15/yr by 2055 (HVAC capex compounding) — expect insurance premiums to compound above CPI over the hold.
Questions for the listing agent
- Is there a deadline driving the sale (1031 exchange, divorce, estate, relocation)? That informs how much negotiation room exists.
- What's the average days-on-market for RENTAL listings here right now (not sales)? A rising rental-DOM trend means longer vacancies and softer asking-rent achievability than the comps imply.
- What's the recent tenant-quality profile in this submarket — average credit score on applications, eviction rate, late-payment / NSF rate, and stable-employment percentage? A property-management company in the area should have these aggregated.
- How much new for-sale + rental construction is in the pipeline within 1–3 miles? Heavy new supply typically softens prices + rents 12–24 months out; constrained supply supports both.
Investment metrics
- 1% rule
- 2.23% ✓
- Cap rate
- 20.23%
- Cash-on-cash
- 49.79%
- DSCR
- 3.22
- GRM
- 3.7
CMA / ARV
No comps found within radius.
Projected returns pro-forma
-3.0% appreciation · 1.64% rent growth · sell at horizon
- IRR
- 46.0%
- Equity multiple
- 2.96×
- Total profit
- $35,535
- Equity at exit
- $9,677
- IRR
- 51.2%
- Equity multiple
- 5.67×
- Total profit
- $84,921
- Equity at exit
- $5,611
Cash invested: $18,172 (down + closing). Projections, not guarantees.
Landlord ↔ Tenant lean methodology
- Overall (STATE)
- 62 Landlord-Friendly
- State Pennsylvania
- 62 Landlord-Friendly · EVEN
- County
- — inherits STATE
- City
- — inherits STATE
ZIP-level market 17112
- Rents YoY
- 1.6%
- Active inventory
- 311
- Price-to-rent
- 3.7×
Monthly cashflow live
- Estimated rent
- $1,445 medium interval (Pro) →
- Mortgage (P&I)
- −$340
- Tax from tax record
- −$20 /mo · $244/yr
- Insurance
- −$27
- HOA
- −$0
- Vacancy / Maint / Mgmt
- −$303
- Net cashflow
- $754
Break-even live
Sensitivity live
| Price | -10% $791 | -5% $772 | +0% $754 | +5% $736 | +10% $717 |
|---|---|---|---|---|---|
| Rent | -10% $640 | -5% $697 | +0% $754 | +5% $811 | +10% $868 |
| Rate | -1.0pp $787 | -0.5pp $770 | base $754 | +0.5pp $737 | +1.0pp $720 |
UW: 25.0% down · 7.5% · 30yr · 1.5% tax · 5.0% vac · 8.0% maint · 8.0% mgmt
Financing live
Cash to close
- Down payment
- $16,225
- Closing costs
- $1,947
- Reserves months
- —
- Total cash needed
- —
Loan-product check · same deal, 3 products live
Conventional
25% down · 7.5% · 30yr
- Down + closing
- —
- Monthly P&I
- —
- Monthly cashflow
- —
- DSCR
- —
- Eligible?
- —
Personal DTI + credit; lowest rate.
DSCR
20% down · 8.5% · 30yr
- Down + closing
- —
- Monthly P&I
- —
- Monthly cashflow
- —
- DSCR
- —
- Eligible?
- —
No personal income docs; deal must DSCR.
Hard money
10% down · 12.0% · 12mo
- Down + closing
- —
- Monthly P&I
- —
- Monthly cashflow
- —
- DSCR
- —
- Eligible?
- —
Short-term bridge; refi at stabilization.
Rent comps 2 comps
| Address | Beds | Baths | Sqft | Rent | $/sqft | DOM | Units | Dist |
|---|---|---|---|---|---|---|---|---|
| 25 Sarhelm Rd Unit E Harrisburg, PA | 2.0 | 1.0 | 900 | $1,200 | $1.33 | 44d | 1 | 0.21mi |
| 25 Sarhelm Rd Unit D Harrisburg, PA | 2.0 | 1.0 | 950 | $1,200 | $1.26 | 24d | 1 | 0.21mi |
Listing history 4 events
-
2026-06-18days on market $64,900 Active 3 DOM
-
2026-06-17days on market $64,900 Active 2 DOM
-
2026-06-15remarks 699-char remark
-
2026-06-15$64,900 Active 1 DOM
ⓘ Source: listings_history table (triggers on properties + properties_extension) + one-shot
backfill from property_details.listing_events for pre-trigger history.
Tax reassessment forecast PA · Partial reset (capped growth)
- Current annual tax
- $244 · $20/mo
- Projected year-2 tax
- $635 · $53/mo
- Expected delta
- +$391/yr (+$33/mo · 160.5%)
ⓘ Screening estimate from a state-policy table — verify with the county assessor before closing.
Climate risk First Street
- Flood 1/10 Low FEMA zone X (unshaded) · 0% chance over 30 yrs
- Wildfire 1/10 Low
- Heat 5/10 Major 7 d/yr ≥100°F today · 15 d/yr by 30 yrs out
- Wind 3/10 Moderate 7% chance of damaging wind over 30 yrs
- Air quality 3/10 Moderate 2 unhealthy d/yr today · 4 by 30 yrs out
Nearby sold comps map
Loading sold comps map…
Walkable amenities ~0.75 mi
Loading nearby amenities…
Taxation est. · year 1
- Rental income
- $17,341
- − Mortgage interest
- −$3,635
- − Property taxes
- −$244
- − Insurance
- −$324
- − Repairs & maintenance
- −$1,387
- − Management
- −$1,387
- − Depreciation
- −$1,888
- Taxable income
- $8,475
- Est. tax owed @ 24.0%
- −$2,034
- After-tax cash flow
- $7,013/yr
For passive investors: Depreciation is non-cash, so a rental often shows a tax loss while cash-flowing — sheltering income. Rental losses are passive: they offset passive income freely, and up to $25,000/yr can offset ordinary (W-2) income if you actively participate and your MAGI is under $100k (phasing out to $0 by $150k); unused losses carry forward. On sale, claimed depreciation is recaptured at up to 25%, and gains may owe capital-gains tax (a 1031 exchange can defer both). Figures are a year-1 estimate at your 24.0% rate — not tax advice; consult a CPA.
Schools (NCES district)
- District
- Central Dauphin SD
- NCES district ID
- 4205400
- Math proficiency
- 30% ▼ -12.00%
- Reading proficiency
- 52% ▼ -7.00%
- Median HH income
- $62,792
- Composite
- 36.46/100
- National rank
- #4664
- State rank
- #305 of 539 in PA
Livability — West Hanover
No livability data for this city. (Only ~50 U.S. cities are tracked.)
Census & demographics
- County
- Dauphin County · 247,857 people
- Metro
- Harrisburg-Carlisle, PA
- Population (ZIP)
- 38,502
- Household income
- $103,876
- Rent vs Own
- Severe rent burden
- 412.0
Population outlook (Dauphin County) Hauer SSP2
- Today (2025)
- 281,628 people
- By 2030
- 283,549 · +0.7%
- By 2040
- 285,385 · +1.3%
- By 2050
- 286,188 · +1.6%
- By 2075
- 291,053 · +3.3%
- By 2100
- 282,374 · +0.3%
Race, ethnicity, and origin ACS 2023
- Neighborhood character
- Predominantly White (78%)
- Race & ethnicity
- White 78% Black 8% Asian 7% Hispanic / Latino 4% Two or more races 3%
- Common ancestry
- Romanian 3% Iranian 2% Lithuanian 2%
- Foreign-born
- 9% · India, Canada, China
- Languages at home
- 90% English-only · Other Indo-European 3% Spanish 1% Other Asian/Pacific 1%
Political lean MEDSL · Dauphin
- 2024 margin
- Lean D (+5.9) · D 52.4% · R 46.5% · Other 1.1%
- 2008→2024 swing
- -3.1pp toward R · 2008: 9.1pp · 2024: 5.9pp
- All cycles
- 2024: D+5.9 2020: D+8.5 2016: D+2.8 2012: D+6.0 2008: D+9.1
Not yet ingested
- Civics
- —
Market trends
- HPI YoY
- ▼ -207.10%
- Current HPI
- 244.5366
- Rent YoY
- ▲ 1.64%
- Metro
- Harrisburg-Carlisle, PA
- State GDP YoY
- ▲ 1.68%
- F500 in state
- 34
Industry mix (Fortune 500 HQ in PA)
| Industry | F500 HQs | Revenue |
|---|---|---|
| Healthcare | 2 | $309B |
|
||
| Insurance | 2 | $27B |
|
||
| Telecommunications / Media | 1 | $124B |
|
||
| Industrial Distribution | 1 | $22B |
|
||
| Financial Services | 1 | $20B |
|
||
| Chemicals / Materials | 1 | $18B |
|
||
Price history
+86.0% since first listed20 events — show timeline
- 2026-06-15 Listed $64,900 BRIGHT MLS
- 2018-10-03 Listing Removed — BRIGHT MLS
- 2018-10-03 Pending — BRIGHT MLS
- 2018-10-02 Listing Removed — BRIGHT MLS
- 2018-05-02 Sold (MLS) $27,500 BRIGHT MLS
- 2018-04-03 Listing Removed — BRIGHT MLS
- 2018-02-25 Listed $34,000 BRIGHT MLS
- 2015-09-25 Sold (MLS) $12,000 BRIGHT MLS
- 2015-09-25 Listing Removed — BRIGHT MLS
- 2015-09-25 Listing Removed — BRIGHT MLS
- 2015-09-02 Listing Removed — BRIGHT MLS
- 2014-08-13 Listed $17,000 BRIGHT MLS
- 2014-08-13 Listed $17,000 BRIGHT MLS
- 2014-07-23 Listed $17,000 BRIGHT MLS
- 2010-05-20 Sold (MLS) $30,000 BRIGHT MLS
- 2010-04-21 Listing Removed — BRIGHT MLS
- 2010-01-26 Listed $33,900 BRIGHT MLS
- 2005-01-31 Sold (MLS) $26,500 BRIGHT MLS
- 2004-10-25 Listing Removed — BRIGHT MLS
- 2004-10-25 Listed $34,900 BRIGHT MLS
Property tax history
+2.2%/yrLatest (2026): $244 · +5.9% YoY. Source: county tax records.
Cash-flow waterfall
monthlySold comps — $/sqft
last 12 mo · ≤1 miLoading sold comps…