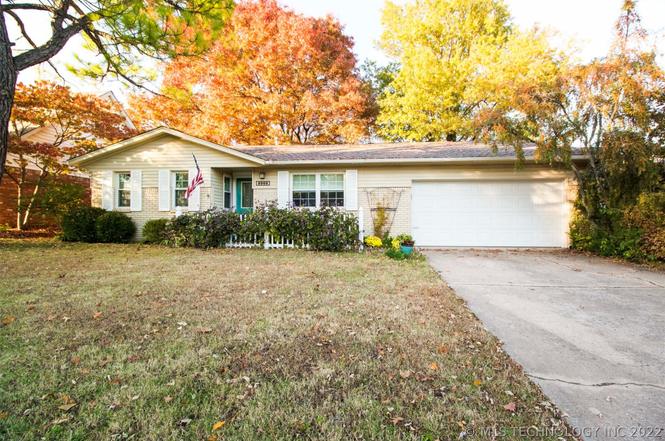
8909 E 58th St · Tulsa, OK
Flood risk 1/10 · Minimal
- FEMA flood zone
- X (unshaded)
- Chance of flooding over 30 yrs
- 0.0%
- Est. flood insurance / yr
- $473 – $860
Fire risk 1/10 · Minimal
- Est. fire insurance / yr
- $2,463 – $4,575
Heat risk 6/10 · Moderate
- Hot days now (above 110°F)
- 7 days/yr
- Hot days in 30 yrs
- 18 days/yr
Wind risk 2/10 · Minimal
- Chance of severe wind over 30 yrs
- 4.0%
Air-quality risk 2/10 · Minimal
- Unhealthy air days now
- 1 days/yr
- Unhealthy air days in 30 yrs
- 1 days/yr
Risk factors via First Street. Map © Google.
Why this score? — see what drove the D- grade
The composite is a weighted blend of 9 inputs, each scored 0–100. Each bar is that input's sub-score; the figure is the points it added to the 100-point composite (weight × sub-score).
- Cash flow +15.3/30.0
- DSCR +4.7/10.0
- Rent growth +4.2/5.0
- 1% rule +4.1/10.0
- Livability +3.8/5.0
- ARV discount +3.1/15.0
- Condition / age +2.5/5.0
- Schools +1.8/10.0
- Appreciation +0.0/10.0
$160,000
🖨 Deal sheet (PDF) 📄 Offer letter ✓ Due diligence
Listing remarks MLS
Cozy & move-in ready home with a great layout for entertaining and plenty of space. Beautifully maintained. Three bedrooms, two bathrooms with great closets. Large backyard with mature trees and gazebo. Union school district!
Key facts
- 7,936 sq ft lot
- 2 garage spots
- Built 1972
Neighborhood map
What this means for you Summary
Snapshot
- This is a 3-bed/2.0-bath single-family listed at $160k.
Deal economics
- At list price, monthly cash flow is $58 ($698/yr) — positive.
- The deal already cash-flows at list — no discount required.
- To meet the 1% rule (rent ≥ 1% of price), the offer needs to be $146k (8.9% below list).
- Recommended offer: $146k (8.9% below list) — sets the bar for 1% rule.
- Cap rate 6.7% vs local median 3.8% in Tulsa — top-decile yield for the area; either an underpriced asset or a hidden risk that comps aren't pricing in. Stress-test before assuming the spread holds.
Location & tenants
- Location reads 75/100 on livability (#13 in OK, #4,058 nationally) — a middle-class / working-renter tenant base. Strengths: amenities A+, commute A+, cost of living A+; Watch: crime F, employment D-.
- Union (urban): math 20% / reading 20% proficiency, ranked #160 of 270 in OK (top 59%) — low school quality limits family demand, transient renter base, plan for 1-2y turnover.
- Zoned schools: Grove Es (math 16% / reading 15%, grade F, #588 of 845 statewide, top 70%, 548 students, 0% FRL); Union 6Th-7Th Grade Ctr (math 18% / reading 17%, grade F, #186 of 345 statewide, top 55%, 2,182 students, 0% FRL); Union Hs (math 22% / reading 31%, grade F, #139 of 447 statewide, top 31%, 3,355 students, 0% FRL) — zoned schools average 0% FRL vs 51% district-wide (51 pts lower); this property's tenant base skews higher-income than the district average.
- Market conditions: Rents rising fast (+6.7%/yr); 77 active listings in the ZIP; 4 comparable units currently listed for rent nearby; rentals at typical pace (median 17d on market — plan ~3-4 weeks tenant-placement turnaround); 2,818 units permitted in Tulsa County in 2024 (518 in 5+ unit buildings).
Forward outlook
- Local home prices are declining (-3.0%/yr); year-one equity from $1k of loan paydown is wiped out by about $5k of value loss. Plan a longer hold.
- Tulsa County population projected at +30% by 2050 — long-run rental-demand tailwind backs the buy-and-hold thesis.
Negotiation context
- Only 0 days on market — expect competitive offers; lowballing is unlikely to land.
- 5 sale attempts since 9y ago with the ask held roughly flat each time — persistent listings suggest the price (not the market) is what's stuck; bring a comps-based counter.
- Current owner paid $127k; 26% above their basis — modest negotiation headroom, anchor on the comps not their cost.
Risks & watch-outs
- Climate carrying-cost: extreme-heat days projected 7→18/yr by 2055 (HVAC capex compounding) — expect insurance premiums to compound above CPI over the hold.
Questions for the listing agent
- Built in 1972 — when were the roof, HVAC, electrical panel, plumbing, and water heater last replaced?
- Is there a deadline driving the sale (1031 exchange, divorce, estate, relocation)? That informs how much negotiation room exists.
- Schools are F-rated, which usually means shorter tenancies and higher turnover. Who's the typical renter profile here, and what's been the actual vacancy rate?
- Crime grade is F in this area — have there been break-ins, vandalism, or insurance claims at this property in the last 3 years? What carrier currently insures it and at what premium?
- The area grade is low — what's the realistic commute time and amenity access for the typical tenant pool here? Any planned neighborhood developments (good or bad) we should know about?
- What's the average days-on-market for RENTAL listings here right now (not sales)? A rising rental-DOM trend means longer vacancies and softer asking-rent achievability than the comps imply.
- What's the recent tenant-quality profile in this submarket — average credit score on applications, eviction rate, late-payment / NSF rate, and stable-employment percentage? A property-management company in the area should have these aggregated.
- How much new for-sale + rental construction is in the pipeline within 1–3 miles? Heavy new supply typically softens prices + rents 12–24 months out; constrained supply supports both.
Investment metrics
- 1% rule
- 0.91% ✗
- Cap rate
- 6.73%
- Cash-on-cash
- 1.56%
- DSCR
- 1.07
- GRM
- 9.1
CMA / ARV
- ARV (on-the-fly)
- $145,624
- Comps found
- 1
Show comp detail 1 sale within ~0.75 mi
| Address | Dist | Beds/Ba | Sqft | Sold | Price | $/sf | Match |
|---|---|---|---|---|---|---|---|
| 8023 E 58th Pl | 0.59mi | 3/2.0 | 1,486 (+11%) | 16mo | $162,000 | $109 | 40 |
Match score weights: distance 35% · size 25% · config 20% · recency 20%. Top-matched comps best support the ARV.
Projected returns pro-forma
-3.0% appreciation · 6.7% rent growth · sell at horizon
- IRR
- -9.8%
- Equity multiple
- 0.63×
- Total profit
- $-16,577
- Equity at exit
- $23,857
- IRR
- 4.0%
- Equity multiple
- 1.34×
- Total profit
- $15,329
- Equity at exit
- $13,834
Cash invested: $44,800 (down + closing). Projections, not guarantees.
Landlord ↔ Tenant lean methodology
- Overall (STATE)
- 83 Strongly Landlord-Friendly
- State Oklahoma
- 83 Strongly Landlord-Friendly · R+20
- County
- — inherits STATE
- City
- — inherits STATE
ZIP-level market 74145
- Rents YoY
- 6.7%
- Active inventory
- 77
- Price-to-rent
- 9.1×
Monthly cashflow live
- Estimated rent
- $1,458 medium interval (Pro) →
- Mortgage (P&I)
- −$839
- Tax from tax record
- −$188 /mo · $2,257/yr
- Insurance
- −$67
- HOA
- −$0
- Vacancy / Maint / Mgmt
- −$306
- Net cashflow
- $58
Break-even live
Sensitivity live
| Price | -10% $149 | -5% $103 | +0% $58 | +5% $13 | +10% $-32 |
|---|---|---|---|---|---|
| Rent | -10% $-57 | -5% $1 | +0% $58 | +5% $116 | +10% $173 |
| Rate | -1.0pp $139 | -0.5pp $99 | base $58 | +0.5pp $17 | +1.0pp $-25 |
UW: 25.0% down · 7.5% · 30yr · 1.5% tax · 5.0% vac · 8.0% maint · 8.0% mgmt
Financing live
Cash to close
- Down payment
- $40,000
- Closing costs
- $4,800
- Reserves months
- —
- Total cash needed
- —
Loan-product check · same deal, 3 products live
Conventional
25% down · 7.5% · 30yr
- Down + closing
- —
- Monthly P&I
- —
- Monthly cashflow
- —
- DSCR
- —
- Eligible?
- —
Personal DTI + credit; lowest rate.
DSCR
20% down · 8.5% · 30yr
- Down + closing
- —
- Monthly P&I
- —
- Monthly cashflow
- —
- DSCR
- —
- Eligible?
- —
No personal income docs; deal must DSCR.
Hard money
10% down · 12.0% · 12mo
- Down + closing
- —
- Monthly P&I
- —
- Monthly cashflow
- —
- DSCR
- —
- Eligible?
- —
Short-term bridge; refi at stabilization.
Rent comps 4 comps
| Address | Beds | Baths | Sqft | Rent | $/sqft | DOM | Units | Dist |
|---|---|---|---|---|---|---|---|---|
| 5766 S 80th East Ave Tulsa, OK | 3.0 | 2.0 | 1570 | $1,600 | $1.02 | 17d | 1 | 0.59mi |
| 7643 E 51st St Tulsa, OK | 1.0–2.0 | 1.0–2.0 | 775 | $839 | $1.08 | 5d | 2 | 1.13mi |
| 4858 S 78th E Pl Tulsa, OK | 1.0–2.0 | 1.0–2.5 | 958 | $1,268 | $1.32 | 5d | 4 | 1.22mi |
| 4974 S 76th East Ave Tulsa, OK | 2.0 | 1.0–2.0 | 875 | $989 | $1.13 | 16d | 3 | 1.26mi |
Listing history 2 events
-
2026-06-17remarks 70-char remark
-
2026-06-17$160,000 Pending
ⓘ Source: listings_history table (triggers on properties + properties_extension) + one-shot
backfill from property_details.listing_events for pre-trigger history.
Tax reassessment forecast OK · Resets to sale price
- Current annual tax
- $2,257 · $188/mo
- Projected year-2 tax
- $2,257 · $188/mo
- Expected delta
- $0/yr ($0/mo · 0.0%)
ⓘ Screening estimate from a state-policy table — verify with the county assessor before closing.
Climate risk First Street
- Flood 1/10 Low FEMA zone X (unshaded) · 0% chance over 30 yrs
- Wildfire 1/10 Low
- Heat 6/10 Major 7 d/yr ≥110°F today · 18 d/yr by 30 yrs out
- Wind 2/10 Low 4% chance of damaging wind over 30 yrs
- Air quality 2/10 Low 1 unhealthy d/yr today · 1 by 30 yrs out
Nearby sold comps map
Loading sold comps map…
Walkable amenities ~0.75 mi
Loading nearby amenities…
Taxation est. · year 1
- Rental income
- $17,498
- − Mortgage interest
- −$8,962
- − Property taxes
- −$2,257
- − Insurance
- −$800
- − Repairs & maintenance
- −$1,400
- − Management
- −$1,400
- − Depreciation
- −$4,655
- Taxable loss
- −$1,975
- Est. tax savings @ 24.0%
- +$474
- After-tax cash flow
- $1,172/yr
For passive investors: Depreciation is non-cash, so a rental often shows a tax loss while cash-flowing — sheltering income. Rental losses are passive: they offset passive income freely, and up to $25,000/yr can offset ordinary (W-2) income if you actively participate and your MAGI is under $100k (phasing out to $0 by $150k); unused losses carry forward. On sale, claimed depreciation is recaptured at up to 25%, and gains may owe capital-gains tax (a 1031 exchange can defer both). Figures are a year-1 estimate at your 24.0% rate — not tax advice; consult a CPA.
Schools (NCES district)
- District
- Union
- NCES district ID
- 4030600
- Math proficiency
- 20% ▼ -9.00%
- Reading proficiency
- 20% ▼ -9.00%
- Median HH income
- $52,744
- Composite
- 18.18/100
- National rank
- #8962
- State rank
- #160 of 270 in OK
Livability — Tulsa
- Score
- 75/100
- State rank
- #13
- US rank
- #4058
Category grades
Schools grade is shown separately in the Schools card above.
Census & demographics
- Census place
- Tulsa, OK
- County
- Tulsa County · 640,811 people
- City population
- 389,418
- Metro
- Tulsa, OK
- Population (ZIP)
- 18,196
- Household income
- $58,706
- Rent vs Own
- Severe rent burden
- 566.0
Population outlook (Tulsa County) Hauer SSP2
- Today (2025)
- 723,846 people
- By 2030
- 766,033 · +5.8%
- By 2040
- 851,386 · +17.6%
- By 2050
- 938,389 · +29.6%
- By 2075
- 1,166,011 · +61.1%
- By 2100
- 1,350,277 · +86.5%
Race, ethnicity, and origin ACS 2023
- Neighborhood character
- Diverse neighborhood (Simpson 0.69)
- Race & ethnicity
- White 48% Hispanic / Latino 25% Two or more races 18% Black 12% Asian 4% Native American 4%
- Hispanic origin (detail)
- Mexican 19%
- Common ancestry
- Slovak 2% Lithuanian 1% Italian 1%
- Foreign-born
- 13% · Canada, Vietnam, Philippines
- Languages at home
- 76% English-only · Spanish 18% Arabic 1% Other Indo-European 1%
Political lean MEDSL · Tulsa
- 2024 margin
- R (+15.2) · D 41.3% · R 56.5% · Other 2.2%
- 2008→2024 swing
- +9.2pp toward D · 2008: -24.5pp · 2024: -15.2pp
- All cycles
- 2024: R+15.2 2020: R+15.6 2016: R+22.9 2012: R+27.4 2008: R+24.5
Not yet ingested
- Civics
- —
Market trends
- HPI YoY
- ▼ -168.71%
- Current HPI
- 236.7578
- Rent YoY
- ▲ 6.70%
- Metro
- Tulsa, OK
- State GDP YoY
- ▲ 1.55%
- F500 in state
- 6
Industry mix (Fortune 500 HQ in OK)
| Industry | F500 HQs | Revenue |
|---|---|---|
| Energy | 3 | $48B |
|
||
Price history
+113.3% since first listed16 events — show timeline
- 2026-06-16 Listing Removed — MLS Technology, Inc.
- 2026-06-15 Listed $160,000 MLS Technology, Inc.
- 2019-01-16 Sold (Public Records) $127,000 Public Records
- 2019-01-15 Sold (MLS) $127,000 MLS Technology, Inc.
- 2018-11-26 Pending — MLS Technology, Inc.
- 2018-11-13 Listed $125,000 MLS Technology, Inc.
- 2018-11-02 Listing Removed — MLS Technology, Inc.
- 2018-10-12 Price Changed $126,000 MLS Technology, Inc.
- 2018-07-26 Price Changed $129,900 MLS Technology, Inc.
- 2018-06-11 Price Changed $131,900 MLS Technology, Inc.
- 2018-05-15 Listed $133,900 MLS Technology, Inc.
- 2018-04-06 Listing Removed — MLS Technology, Inc.
- 2018-03-05 Relisted — MLS Technology, Inc.
- 2018-01-25 Listing Removed — MLS Technology, Inc.
- 2017-11-16 Listed $133,900 MLS Technology, Inc.
- 2001-06-04 Sold (Public Records) $75,000 Public Records
Property tax history
+6.6%/yrLatest (2025): $2,257 · +9.4% YoY. Source: county tax records.
Cash-flow waterfall
monthlySold comps — $/sqft
last 12 mo · ≤1 miLoading sold comps…