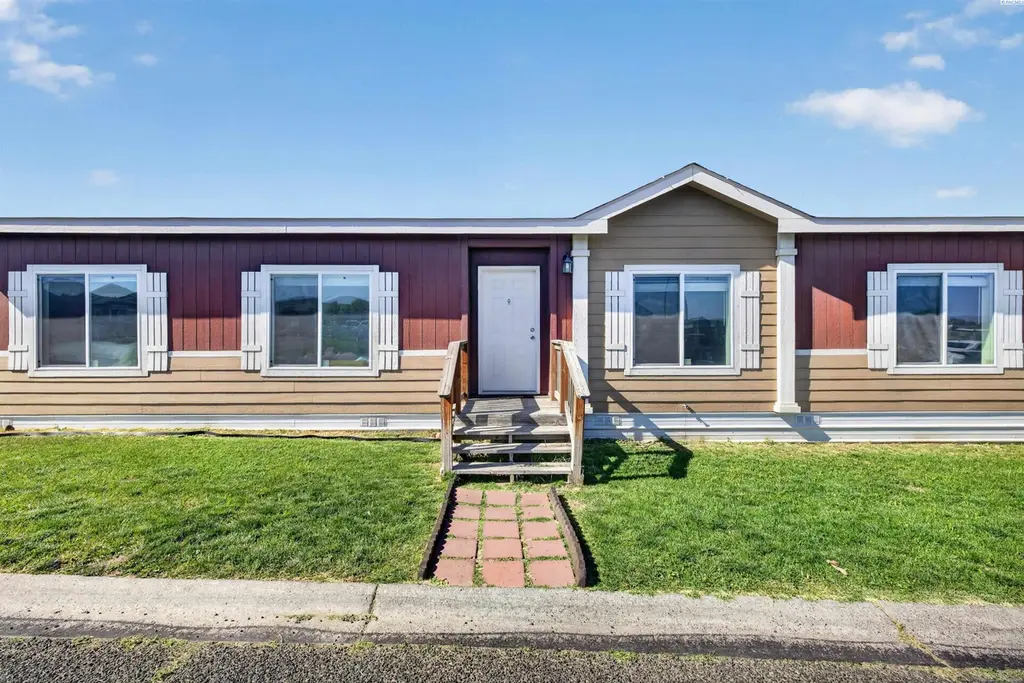
200802 E Game Farm Rd #68 Rd #68 · Finley, WA
Flood risk 1/10 · Minimal
- FEMA flood zone
- X
- Chance of flooding over 30 yrs
- 0.0%
- Est. flood insurance / yr
- $473 – $860
Fire risk 5/10 · Moderate
- Est. fire insurance / yr
- $604 – $1,122
Heat risk 5/10 · Moderate
- Hot days now (above 99°F)
- 7 days/yr
- Hot days in 30 yrs
- 15 days/yr
Wind risk 1/10 · Minimal
- Chance of severe wind over 30 yrs
- —
Air-quality risk 8/10 · Major
- Unhealthy air days now
- 15 days/yr
- Unhealthy air days in 30 yrs
- 16 days/yr
Risk factors via First Street. Map © Google.
Why this score? — see what drove the B- grade
The composite is a weighted blend of 9 inputs, each scored 0–100. Each bar is that input's sub-score; the figure is the points it added to the 100-point composite (weight × sub-score).
- Cash flow +30.0/30.0
- 1% rule +10.0/10.0
- DSCR +10.0/10.0
- Schools +4.6/10.0
- ARV discount +4.3/15.0
- Livability +2.9/5.0
- Rent growth +2.5/5.0
- Condition / age +2.5/5.0
- Appreciation +0.0/10.0
$135,000
🖨 Deal sheet 📄 Offer letter ✓ Due diligence
Listing remarks
MLS# 292967 This newer 2018 manufactured home offers a peaceful country escape with all the modern comforts you need. Located in a quiet community with a serene rural feel, this 4-bedroom, 2-bath split-bedroom design provides both space and privacy. The bright, open-concept layout features a spacious and inviting kitchen with a curved breakfast bar, stylish pendant and recessed lighting, and abundant cabinetry. Crisp white cabinets with decorative open shelving are paired with a contrasting dark island, laminate countertops, and sleek black appliances. The kitchen flows seamlessly into the living and dining areas, creating an ideal space for both entertaining and everyday living. Interior f
Key facts
- Curved breakfast bar
- Abundant cabinetry
- Open-concept layout
Tags
Property features AI
Finance
- Other: Property listed as a manufactured home on a rented lot
- Financial info: Tax information available but excluded per instructions
- HOA & community: Located in a mobile home park
Exterior
- Parking: No garage; No designated parking listed
- Security: No security features listed
- Utilities: Public water; Public sewer; Electricity connected / electric on property; UGS timed irrigation
- Home design: Manufactured house (double wide); One level / single-story; New construction
- Construction: Composition roof; Fleetwood Waverly Crest (manufacturer/model); Foundation: none listed; Manufactured construction
- Exterior features: Patio; Paved road access; Community pool
Interior
- Kitchen: Dishwasher; Refrigerator; Range
- Bedrooms: Bedrooms information not provided
- Flooring: Carpet; Vinyl
- Bathrooms: 2 full bathrooms
- Heating & cooling: Central air conditioning; Electric forced-air heating
- Interior features: Walk-in closet(s); Pantry; Laminate countertops; Window coverings; Double-pane windows
- Laundry & utility: Dedicated laundry room
Neighborhood map
What this means for you Summary
Snapshot
- This is a 3-bed/2.0-bath single-family listed at $135k.
Deal economics
- At list price, monthly cash flow is $895 ($11k/yr) — positive.
- The deal already cash-flows at list — no discount required.
- Meets the 1% rule at list price ($2k rent vs $135k).
- Recommended offer: $131k (3.0% below list) — sets the bar for market timing.
- Cap rate 14.3% vs local median 2.8% in Finley — top-decile yield for the area; either an underpriced asset or a hidden risk that comps aren't pricing in. Stress-test before assuming the spread holds.
Location & tenants
- Location reads 58/100 on livability (#502 in WA) — a working-class tenant base; expect higher turnover. Strengths: housing A+, employment B, cost of living B; Watch: crime D+, schools F, amenities F.
- Kennewick School District (urban): math 43% / reading 58% proficiency, ranked #141 of 291 in WA (top 48%) — acceptable for families but not a draw, mixed tenant base, ~2y average lease.
- Market conditions: 246 active listings in the ZIP; solid renter incomes; 1,532 units permitted in Benton County in 2024 (389 in 5+ unit buildings).
Forward outlook
- Local home prices are declining (-3.0%/yr); year-one equity from $933 of loan paydown is wiped out by about $4k of value loss. Plan a longer hold.
- Benton County population projected at +32% by 2050 — long-run rental-demand tailwind backs the buy-and-hold thesis.
- At projected returns (-3.0% appreciation + 3.0% rent growth), your $38k cash investment doubles in ~5 years — after that, you're playing with house money.
Negotiation context
- It's been on market 35 days — a 3% lower offer ($131k) is reasonable based on typical stale-listing flexibility.
Risks & watch-outs
- Climate carrying-cost: moderate wildfire risk; extreme-heat days projected 7→15/yr by 2055 (HVAC capex compounding) — expect insurance premiums to compound above CPI over the hold.
Questions for the listing agent
- It's been on market 35 days. Have you received any prior offers? Is the seller open to a 3% concession, seller financing, or rate buy-down credit?
- Is there a deadline driving the sale (1031 exchange, divorce, estate, relocation)? That informs how much negotiation room exists.
- Schools are F-rated, which usually means shorter tenancies and higher turnover. Who's the typical renter profile here, and what's been the actual vacancy rate?
- Crime grade is D in this area — have there been break-ins, vandalism, or insurance claims at this property in the last 3 years? What carrier currently insures it and at what premium?
- What's the average days-on-market for RENTAL listings here right now (not sales)? A rising rental-DOM trend means longer vacancies and softer asking-rent achievability than the comps imply.
- What's the recent tenant-quality profile in this submarket — average credit score on applications, eviction rate, late-payment / NSF rate, and stable-employment percentage? A property-management company in the area should have these aggregated.
- How much new for-sale + rental construction is in the pipeline within 1–3 miles? Heavy new supply typically softens prices + rents 12–24 months out; constrained supply supports both.
Investment metrics
- 1% rule
- 1.62% ✓
- Cap rate
- 14.25%
- Cash-on-cash
- 28.42%
- DSCR
- 2.26
- GRM
- 5.1
CMA / ARV
- ARV (median comp)
- $126,011
- List price
- $135,000
- Delta
- 7.13%
- Verdict
- FAIR
- Comps
- 4 within 1.0 mi
Show comp detail 1 sale within ~0.75 mi
| Address | Dist | Beds/Ba | Sqft | Sold | Price | $/sf | Match |
|---|---|---|---|---|---|---|---|
| 208401 E Cochran Rd | 0.69mi | 3/2.0 | 1,296 (-14%) | 17mo | $390,000 | $301 | 29 |
Match score weights: distance 35% · size 25% · config 20% · recency 20%. Top-matched comps best support the ARV.
Projected returns pro-forma
-3.0% appreciation · 3.0% rent growth · sell at horizon
- IRR
- 22.7%
- Equity multiple
- 1.93×
- Total profit
- $35,123
- Equity at exit
- $20,129
- IRR
- 30.6%
- Equity multiple
- 3.75×
- Total profit
- $103,898
- Equity at exit
- $11,672
Cash invested: $37,800 (down + closing). Projections, not guarantees.
Landlord ↔ Tenant lean methodology
- Overall (STATE)
- 28 Tenant-Leaning
- State Washington
- 28 Tenant-Leaning · D+8
- County
- — inherits STATE
- City
- — inherits STATE
ZIP-level market 99337
- Active inventory
- 246
- Price-to-rent
- 5.1×
Monthly cashflow live
- Estimated rent
- $2,187 medium interval (Pro) →
- Mortgage (P&I)
- −$708
- Tax from tax record
- −$68 /mo · $814/yr
- Insurance
- −$56
- HOA
- −$0
- Vacancy / Maint / Mgmt
- −$459
- Net cashflow
- $895
Break-even live
UW: 25.0% down · 7.5% · 30yr · 1.5% tax · 5.0% vac · 8.0% maint · 8.0% mgmt
Financing live
Cash to close
- Down payment
- $33,750
- Closing costs
- $4,050
- Reserves months
- —
- Total cash needed
- —
Loan-product check · same deal, 3 products live
Conventional
25% down · 7.5% · 30yr
- Down + closing
- —
- Monthly P&I
- —
- Monthly cashflow
- —
- DSCR
- —
- Eligible?
- —
Personal DTI + credit; lowest rate.
DSCR
20% down · 8.5% · 30yr
- Down + closing
- —
- Monthly P&I
- —
- Monthly cashflow
- —
- DSCR
- —
- Eligible?
- —
No personal income docs; deal must DSCR.
Hard money
10% down · 12.0% · 12mo
- Down + closing
- —
- Monthly P&I
- —
- Monthly cashflow
- —
- DSCR
- —
- Eligible?
- —
Short-term bridge; refi at stabilization.
Listing history 17 events
-
2026-06-18days on market $135,000 Active 35 DOM
-
2026-06-17days on market $135,000 Active 34 DOM
-
2026-06-16days on market $135,000 Active 33 DOM
-
2026-06-15days on market $135,000 Active 32 DOM
-
2026-06-14days on market $135,000 Active 30 DOM
-
2026-06-13days on market $135,000 Active 29 DOM
-
2026-06-10days on market $135,000 Active 27 DOM
-
2026-06-09days on market $135,000 Active 26 DOM
-
2026-06-08days on market $135,000 Active 25 DOM
-
2026-06-07days on market $135,000 Active 24 DOM
-
2026-06-05days on market $135,000 Active 21 DOM
-
2026-06-03days on market $135,000 Active 20 DOM
-
2026-06-02days on market $135,000 Active 19 DOM
-
2026-06-01days on market $135,000 Active 18 DOM
-
2026-05-31days on market $135,000 Active 17 DOM
-
2026-05-30days on market $135,000 Active 16 DOM
-
2026-05-14$135,000 Active 1305-char remark
ⓘ Source: listings_history table (triggers on properties + properties_extension) + one-shot
backfill from property_details.listing_events for pre-trigger history.
Tax reassessment forecast WA · Resets to sale price
- Current annual tax
- $814 · $68/mo
- Projected year-2 tax
- $1,323 · $110/mo
- Expected delta
- +$509/yr (+$42/mo · 62.6%)
ⓘ Screening estimate from a state-policy table — verify with the county assessor before closing.
Climate risk First Street
- Flood 1/10 Low FEMA zone X · 0% chance over 30 yrs
- Wildfire 5/10 Major
- Heat 5/10 Major 7 d/yr ≥99°F today · 15 d/yr by 30 yrs out
- Wind 1/10 Low
- Air quality 8/10 Severe 15 unhealthy d/yr today · 16 by 30 yrs out
Nearby sold comps map
Loading sold comps map…
Walkable amenities ~0.75 mi
Loading nearby amenities…
Taxation est. · year 1
- Rental income
- $26,239
- − Mortgage interest
- −$7,562
- − Property taxes
- −$814
- − Insurance
- −$675
- − Repairs & maintenance
- −$2,099
- − Management
- −$2,099
- − Depreciation
- −$3,927
- Taxable income
- $9,063
- Est. tax owed @ 24.0%
- −$2,175
- After-tax cash flow
- $8,570/yr
For passive investors: Depreciation is non-cash, so a rental often shows a tax loss while cash-flowing — sheltering income. Rental losses are passive: they offset passive income freely, and up to $25,000/yr can offset ordinary (W-2) income if you actively participate and your MAGI is under $100k (phasing out to $0 by $150k); unused losses carry forward. On sale, claimed depreciation is recaptured at up to 25%, and gains may owe capital-gains tax (a 1031 exchange can defer both). Figures are a year-1 estimate at your 24.0% rate — not tax advice; consult a CPA.
Schools (NCES district)
- District
- Kennewick School District
- NCES district ID
- 5303930
- Math proficiency
- 43% ▼ -1.00%
- Reading proficiency
- 58% ▬ 0.00%
- Median HH income
- $54,191
- Composite
- 45.56/100
- National rank
- #5667
- State rank
- #141 of 291 in WA
Livability — Finley
- Score
- 58/100
- State rank
- #502
- US rank
- #20775
Category grades
Schools grade is shown separately in the Schools card above.
Census & demographics
- County
- Benton County · 186,895 people
- Metro
- Kennewick-Richland, WA
- Population (ZIP)
- 33,287
- Household income
- $98,848
- Rent vs Own
- Severe rent burden
- 430.0
Population outlook (Benton County) Hauer SSP2
- Today (2025)
- 219,421 people
- By 2030
- 233,813 · +6.6%
- By 2040
- 262,134 · +19.5%
- By 2050
- 290,100 · +32.2%
- By 2075
- 363,525 · +65.7%
- By 2100
- 418,667 · +90.8%
Race, ethnicity, and origin ACS 2023
- Neighborhood character
- Predominantly White (67%)
- Race & ethnicity
- White 67% Hispanic / Latino 26% Two or more races 13% Asian 1% Black 1%
- Hispanic origin (detail)
- Mexican 24%
- Common ancestry
- Lithuanian 4% Portuguese 3% Iranian 2%
- Foreign-born
- 12% · Canada, Vietnam
- Languages at home
- 76% English-only · Spanish 20% Russian/Polish/Slavic 2%
Political lean MEDSL · Benton
- 2024 margin
- Strong R (+21.9) · D 37.7% · R 59.6% · Other 2.7%
- 2008→2024 swing
- +4.2pp toward D · 2008: -26.1pp · 2024: -21.9pp
- All cycles
- 2024: R+21.9 2020: R+21.0 2016: R+26.6 2012: R+27.0 2008: R+26.1
Not yet ingested
- Civics
- —
Market trends
- HPI YoY
- ▼ -260.38%
- Current HPI
- 245.5375
- Rent YoY
- —
- Metro
- Kennewick-Richland, WA
- State GDP YoY
- ▲ 4.65%
- F500 in state
- 22
Industry mix (Fortune 500 HQ in WA)
| Industry | F500 HQs | Revenue |
|---|---|---|
| Retail | 2 | $269B |
|
||
| Technology / Retail | 1 | $638B |
|
||
| Technology | 1 | $245B |
|
||
| Telecommunications | 1 | $38B |
|
||
| Food / Beverage | 1 | $36B |
|
||
| Automotive / Trucks | 1 | $34B |
|
||
Price history
1 event — show timeline
- 2026-05-14 Listed $135,000 PACMLS
Property tax history
+2.0%/yrLatest (2026): $814 · -2.9% YoY. Source: county tax records.
Cash-flow waterfall
monthlySold comps — $/sqft
last 12 mo · ≤1 miLoading sold comps…