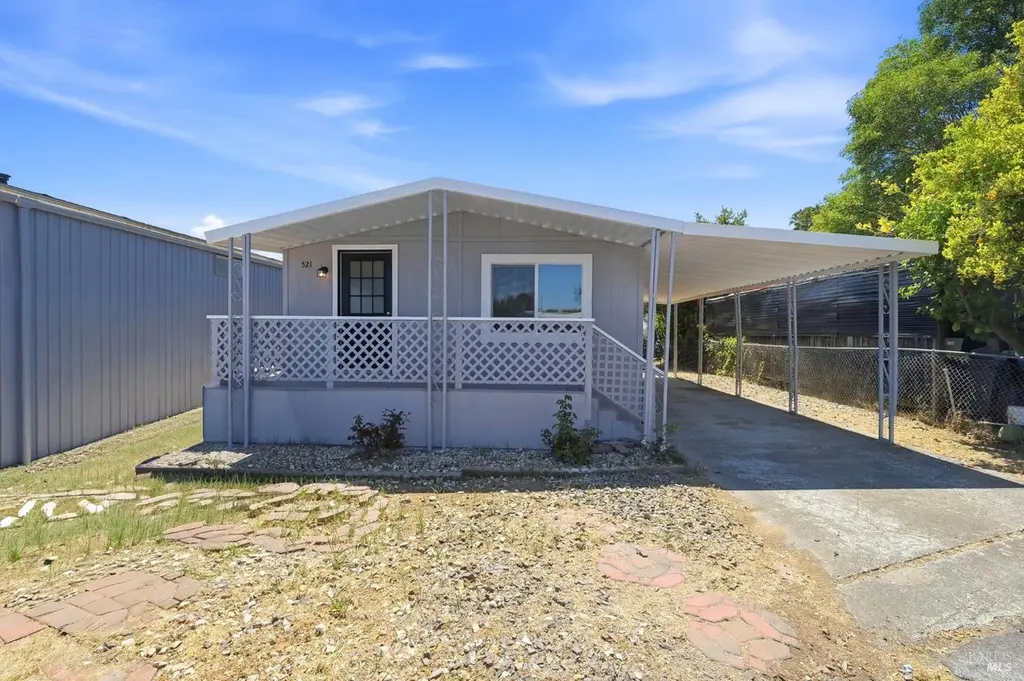
521 San Antonio Way · Vallejo, CA
Flood risk 6/10 · Moderate
- FEMA flood zone
- AE
- Chance of flooding over 30 yrs
- 0.74%
- Est. flood insurance / yr
- $1,737 – $8,500
Fire risk 1/10 · Minimal
- Est. fire insurance / yr
- $659 – $1,223
Heat risk 4/10 · Minor
- Hot days now (above 93°F)
- 7 days/yr
- Hot days in 30 yrs
- 14 days/yr
Wind risk 1/10 · Minimal
- Chance of severe wind over 30 yrs
- —
Air-quality risk 9/10 · Severe
- Unhealthy air days now
- 16 days/yr
- Unhealthy air days in 30 yrs
- 17 days/yr
Risk factors via First Street. Map © Google.
Why this score? — see what drove the C+ grade
The composite is a weighted blend of 9 inputs, each scored 0–100. Each bar is that input's sub-score; the figure is the points it added to the 100-point composite (weight × sub-score).
- Cash flow +30.0/30.0
- 1% rule +10.0/10.0
- DSCR +10.0/10.0
- Condition / age +4.0/5.0
- Livability +3.4/5.0
- Rent growth +2.7/5.0
- Schools +2.6/10.0
- ARV discount +0.0/15.0
- Appreciation +0.0/10.0
$148,888
🖨 Deal sheet 📄 Offer letter ✓ Due diligence
Listing remarks
Nestled on a corner lot in the highly desirable Vallejo Mobile Estates Family Park is this Move-In ready 3 bedroom / 2 bath double-wide mobile home boasting a Remodeled Kitchen equipped w/ Stainless Steel Appliances, Remodeled Bathrooms, En-Suite Primary Bedroom w/ walk-in closet, Living Room, Dining Area, Dedicated Laundry Closet and 2 car tandem carport. Other features include: Freshly painted exterior/interior. New LVP Flooring Throughout. New A/C Unit. New Double Pane Windows. Easy access to freeway. A MUST SEE!!!
Key facts
- Remodeled kitchen
- Corner lot
- Remodeled bathrooms
Tags
Property features AI
Finance
- Other: Located in Vallejo Mobile Estates; Manufactured home make: Custom Golden; model: Goc 308; dimensions approximately 56 ft by 10 ft
- HOA & community: No association fee; Pets allowed with size and number limits; dogs and cats OK; Park residency restrictions: owner/coop interview and board approval
Exterior
- Parking: Covered parking; Carport for 2 cars; Total 2 parking spaces
- Security: Smoke detector(s); Carbon monoxide detector(s); Double-strapped water heater
- Utilities: Individual gas meter; Individual electric meter; Public water; Public sewer
- Home design: Manufactured home in park; Double wide; Built in 1983
- Construction: Metal skirting
- Exterior features: Patio; Corner lot
Interior
- Kitchen: Microwave; Free-standing refrigerator; Free-standing gas range; Dishwasher
- Bedrooms: 3 bedrooms
- Bathrooms: 2 full bathrooms
- Heating & cooling: Central heating; Central air conditioning
- Interior features: Updated/remodeled condition; Smoke detector(s); Carbon monoxide detector(s); Double-strapped water heater
- Laundry & utility: Laundry closet with hookups
Neighborhood map
What this means for you Summary
Snapshot
- This is a 3-bed/2.0-bath manufactured listed at $149k. Condition is rated good.
Deal economics
- At list price, monthly cash flow is $545 ($7k/yr) — positive.
- The deal already cash-flows at list — no discount required.
- Meets the 1% rule at list price ($3k rent vs $149k).
- Cap rate 14.1% vs local median 3.1% in Vallejo — top-decile yield for the area; either an underpriced asset or a hidden risk that comps aren't pricing in. Stress-test before assuming the spread holds.
Location & tenants
- Location reads 67/100 on livability (#304 in CA) — a middle-class / working-renter tenant base. Strengths: commute A+, housing A+, health & safety A+; Watch: schools D-, crime F, cost of living F.
- Vallejo City Unified (urban): math 20% / reading 30% proficiency, ranked #1,124 of 1,400 in CA (top 80%) — low school quality limits family demand, transient renter base, plan for 1-2y turnover; 62% free/reduced lunch — lower-income household profile, screen leases tightly.
- Market conditions: Rents flat; 176 active listings in the ZIP; 39 comparable units currently listed for rent nearby; rentals at typical pace (median 24d on market — plan ~3-4 weeks tenant-placement turnaround); 46% of comp listings sitting > 30 days — soft ceiling on asking rent; 1,472 units permitted in Solano County in 2024 (131 in 5+ unit buildings).
- At $2,532/mo this rent would consume 47% of the median local household income ($65k/yr) (locally 2972% of renters already pay >50% of income on rent) — very limited rent-growth headroom before tenants either downsize or default.
Forward outlook
- Local home prices are declining (-3.0%/yr); year-one equity from $1k of loan paydown is wiped out by about $4k of value loss. Plan a longer hold.
- Solano County population projected at +15% by 2050 — modest demand growth; plan on rents tracking national, not racing it.
Negotiation context
- Only 6 days on market — expect competitive offers; lowballing is unlikely to land.
Risks & watch-outs
- Watch-outs: flood insurance adds $427/mo.
- Climate carrying-cost: in FEMA flood zone AE (mandatory federal flood insurance) — expect insurance premiums to compound above CPI over the hold.
Questions for the listing agent
- What's the actual annual flood-insurance premium (NFIP or private), and is the property in a SFHA with mandatory coverage?
- Is there a deadline driving the sale (1031 exchange, divorce, estate, relocation)? That informs how much negotiation room exists.
- Schools are D-rated, which usually means shorter tenancies and higher turnover. Who's the typical renter profile here, and what's been the actual vacancy rate?
- Crime grade is F in this area — have there been break-ins, vandalism, or insurance claims at this property in the last 3 years? What carrier currently insures it and at what premium?
- What's the average days-on-market for RENTAL listings here right now (not sales)? A rising rental-DOM trend means longer vacancies and softer asking-rent achievability than the comps imply.
- What's the recent tenant-quality profile in this submarket — average credit score on applications, eviction rate, late-payment / NSF rate, and stable-employment percentage? A property-management company in the area should have these aggregated.
- How much new for-sale + rental construction is in the pipeline within 1–3 miles? Heavy new supply typically softens prices + rents 12–24 months out; constrained supply supports both.
Investment metrics
- 1% rule
- 1.70% ✓
- Cap rate
- 14.12%
- Cash-on-cash
- 27.96%
- DSCR
- 2.24
- GRM
- 4.9
CMA / ARV
- ARV (on-the-fly)
- $115,360
- Comps found
- 3
Show comp detail 3 sales within ~0.75 mi
| Address | Dist | Beds/Ba | Sqft | Sold | Price | $/sf | Match |
|---|---|---|---|---|---|---|---|
| 317 San Marcus Dr | 0.10mi | 3/2.0 | 1,152 (+3%) | 3mo | $140,000 | $122 | 88 |
| 56 Dolores Dr | 0.18mi | 2/2.0 (-1) | 1,152 (+3%) | 13mo | $119,000 | $103 | 71 |
| 505 San Antonio Rd | 0.06mi | 2/1.5 (-1) | 1,000 (-11%) | 11mo | $75,000 | $75 | 63 |
Match score weights: distance 35% · size 25% · config 20% · recency 20%. Top-matched comps best support the ARV.
Projected returns pro-forma
-3.0% appreciation · 0.71% rent growth · sell at horizon
- IRR
- 3.3%
- Equity multiple
- 1.12×
- Total profit
- $5,164
- Equity at exit
- $22,200
- IRR
- 10.0%
- Equity multiple
- 1.67×
- Total profit
- $28,036
- Equity at exit
- $12,873
Cash invested: $41,689 (down + closing). Projections, not guarantees.
Landlord ↔ Tenant lean methodology
- Overall (STATE)
- 18 Strongly Tenant-Friendly
- State California
- 18 Strongly Tenant-Friendly · D+13
- County
- — inherits STATE
- City
- — inherits STATE
ZIP-level market 94590
- Rents YoY
- 0.7%
- Active inventory
- 176
- Price-to-rent
- 4.9×
Monthly cashflow live
- Estimated rent
- $2,532 high interval (Pro) →
- Mortgage (P&I)
- −$781
- Tax est. 1.5%
- −$186 /mo · $2,233/yr
- Insurance
- −$62
- Flood insurance flood zone
- −$427 /mo · $5,118/yr
- HOA
- −$0
- Vacancy / Maint / Mgmt
- −$532
- Net cashflow
- $545
Break-even live
UW: 25.0% down · 7.5% · 30yr · 1.5% tax · 5.0% vac · 8.0% maint · 8.0% mgmt
Financing live
Cash to close
- Down payment
- $37,222
- Closing costs
- $4,467
- Reserves months
- —
- Total cash needed
- —
Loan-product check · same deal, 3 products live
Conventional
25% down · 7.5% · 30yr
- Down + closing
- —
- Monthly P&I
- —
- Monthly cashflow
- —
- DSCR
- —
- Eligible?
- —
Personal DTI + credit; lowest rate.
DSCR
20% down · 8.5% · 30yr
- Down + closing
- —
- Monthly P&I
- —
- Monthly cashflow
- —
- DSCR
- —
- Eligible?
- —
No personal income docs; deal must DSCR.
Hard money
10% down · 12.0% · 12mo
- Down + closing
- —
- Monthly P&I
- —
- Monthly cashflow
- —
- DSCR
- —
- Eligible?
- —
Short-term bridge; refi at stabilization.
Rent comps 39 comps
| Address | Beds | Baths | Sqft | Rent | $/sqft | DOM | Units | Dist |
|---|---|---|---|---|---|---|---|---|
| 962 Pine St Vallejo, CA | 3.0 | 2.0 | 1000 | $3,200 | $3.20 | 44d | 1 | 0.26mi |
| 929 6th St Vallejo, CA | 3.0 | 2.0 | 1414 | $2,600 | $1.84 | 44d | 1 | 0.29mi |
| 935 Sheridan St Unit C Vallejo, CA | 2.0 | 1.0 | 800 | $2,190 | $2.74 | 23d | 1 | 0.33mi |
| 551 5th St Vallejo, CA | 3.0 | 1.0 | 1000 | $2,550 | $2.55 | 23d | 1 | 0.41mi |
| 532 Magazine St Vallejo, CA | 2.0 | 1.0–2.0 | 792 | $2,988 | $3.77 | 3d | 11 | 0.50mi |
| 532 Magazine St Vallejo, CA | 2.0 | 2.0 | 762 | $3,188 | $4.18 | 2d | 9 | 0.50mi |
| 532 Magazine St Vallejo, CA | 1.0–2.0 | 1.0–2.0 | 792 | $2,888 | $3.65 | 24d | 12 | 0.50mi |
| 415 Wallace Ave Unit A Vallejo, CA | 2.0 | 1.0 | 1200 | $2,100 | $1.75 | 23d | 1 | 0.51mi |
| 415 Wallace Ave Unit 1 Vallejo, CA | 2.0 | 1.0 | 1200 | $2,650 | $2.21 | 44d | 1 | 0.51mi |
| 407 Jordan St Vallejo, CA | 4.0 | 2.5 | 1408 | $2,850 | $2.02 | 44d | 1 | 0.55mi |
| 961 Porter St Vallejo, CA | 2.0–3.0 | 1.0–3.0 | 1159 | $3,355 | $2.89 | 2d | 11 | 0.61mi |
| 100 Buss Ave Vallejo, CA | 2.0 | 1.0 | 1116 | $2,800 | $2.51 | 44d | 1 | 0.63mi |
| 706 La Canyada Dr Vallejo, CA | 3.0 | 2.0 | 1075 | $2,799 | $2.60 | 14d | 1 | 0.70mi |
| 308 Annette Ave Vallejo, CA | 2.0 | 1.0 | 750 | $1,800 | $2.40 | 14d | 1 | 0.72mi |
| 664 Lincoln Rd E Unit 664 Vallejo, CA | 2.0 | 1.0 | 843 | $1,995 | $2.37 | 44d | 1 | 0.73mi |
| 1107 Porter St Vallejo, CA | 1.0–2.0 | 1.0–2.0 | 751 | $2,250 | $2.99 | 2d | 10 | 0.79mi |
| 152 Jordan St Vallejo, CA | 2.0 | 1.0 | 750 | $2,175 | $2.90 | 44d | 1 | 0.83mi |
| 108 Esa Dr Vallejo, CA | 3.0 | 2.0 | 1196 | $2,200 | $1.84 | 44d | 1 | 0.83mi |
| 206 Sea Crest Cir Vallejo, CA | 2.0 | 2.5 | 1464 | $2,595 | $1.77 | 44d | 1 | 0.83mi |
| 2228 Georgia St Vallejo, CA | 3.0 | 2.0 | 1286 | $3,300 | $2.57 | 44d | 1 | 0.84mi |
| 136 Sea Crest Cir Vallejo, CA | 2.0 | 1.0 | 900 | $2,350 | $2.61 | 44d | 1 | 0.85mi |
| 1222 York St Unit 1222-B Vallejo, CA | 2.0 | 1.0 | 1054 | $1,799 | $1.71 | 44d | 1 | 0.88mi |
| 412 Home Acres Ave Vallejo, CA | 2.0 | 1.0 | 724 | $1,950 | $2.69 | 23d | 1 | 0.88mi |
| 403 Gilcrest Ave Unit 403 Vallejo, CA | 2.0 | 1.0 | 850 | $1,599 | $1.88 | 44d | 1 | 0.89mi |
| 2008 Rice St Vallejo, CA | 2.0 | 1.0 | 748 | $2,250 | $3.01 | 23d | 1 | 0.91mi |
| 924 Palou St Vallejo, CA | 3.0 | 1.0 | 966 | $2,500 | $2.59 | 23d | 1 | 0.93mi |
| 925 Hargus Ave Unit C Vallejo, CA | 2.0 | 1.0 | 1300 | $1,960 | $1.51 | 14d | 1 | 0.93mi |
| 940 York St Unit B Vallejo, CA | 2.0 | 1.0 | 800 | $1,800 | $2.25 | 44d | 1 | 1.02mi |
| 1029 Virginia St Vallejo, CA | 2.0 | 1.0 | 1050 | $1,950 | $1.86 | 44d | 1 | 1.06mi |
| 808 Georgia St Vallejo, CA | 3.0 | 1.0 | 1300 | $2,500 | $1.92 | 14d | 1 | 1.16mi |
| 1026 Carolina St Vallejo, CA | 3.0 | 1.0 | 1300 | $2,100 | $1.62 | 44d | 1 | 1.24mi |
| 709 Napa St Vallejo, CA | 3.0 | 1.5 | 1250 | $2,500 | $2.00 | 23d | 1 | 1.26mi |
| 517 York St Vallejo, CA | 2.0 | 1.0 | 900 | $2,300 | $2.56 | 44d | 1 | 1.30mi |
| 915 Napa St Unit 1/2 Vallejo, CA | 2.0 | 1.0 | 800 | $1,795 | $2.24 | 14d | 1 | 1.35mi |
| 16 Springs Rd Unit A Vallejo, CA | 2.0 | 1.0 | 1080 | $2,000 | $1.85 | 44d | 1 | 1.40mi |
| 115 James River Rd Vallejo, CA | 3.0 | 2.5 | 1472 | $2,850 | $1.94 | 12d | 1 | 1.42mi |
| 116 Westwood St Vallejo, CA | 3.0 | 2.0 | 1000 | $2,800 | $2.80 | 23d | 1 | 1.43mi |
| 337 Georgia St Unit 202 Vallejo, CA | 2.0 | 1.0 | 850 | $1,895 | $2.23 | 14d | 1 | 1.46mi |
| 232 Doyle Dr Vallejo, CA | 3.0 | 1.5 | 1395 | $2,945 | $2.11 | 23d | 1 | 1.47mi |
Listing history 7 events
-
2026-06-18days on market $148,888 Active 6 DOM
-
2026-06-17days on market $148,888 Active 5 DOM
-
2026-06-16days on market $148,888 Active 4 DOM
-
2026-06-15remarks 523-char remark
-
2026-06-15days on market $148,888 Active 3 DOM
-
2026-06-14remarks 481-char remark
-
2026-06-14$148,888 Active 1 DOM
ⓘ Source: listings_history table (triggers on properties + properties_extension) + one-shot
backfill from property_details.listing_events for pre-trigger history.
Climate risk First Street
- Flood 6/10 Major FEMA zone AE · 74% chance over 30 yrs
- Wildfire 1/10 Low
- Heat 4/10 Moderate 7 d/yr ≥93°F today · 14 d/yr by 30 yrs out
- Wind 1/10 Low
- Air quality 9/10 Extreme 16 unhealthy d/yr today · 17 by 30 yrs out
Nearby sold comps map
Loading sold comps map…
Walkable amenities ~0.75 mi
Loading nearby amenities…
Taxation est. · year 1
- Rental income
- $30,383
- − Mortgage interest
- −$8,340
- − Property taxes
- −$2,233
- − Insurance
- −$5,863
- − Repairs & maintenance
- −$2,431
- − Management
- −$2,431
- − Depreciation
- −$4,331
- Taxable income
- $4,754
- Est. tax owed @ 24.0%
- −$1,141
- After-tax cash flow
- $5,396/yr
For passive investors: Depreciation is non-cash, so a rental often shows a tax loss while cash-flowing — sheltering income. Rental losses are passive: they offset passive income freely, and up to $25,000/yr can offset ordinary (W-2) income if you actively participate and your MAGI is under $100k (phasing out to $0 by $150k); unused losses carry forward. On sale, claimed depreciation is recaptured at up to 25%, and gains may owe capital-gains tax (a 1031 exchange can defer both). Figures are a year-1 estimate at your 24.0% rate — not tax advice; consult a CPA.
Condition & rehab AI · 12 photos
This move-in ready 3-bedroom/2-bath double-wide mobile home is in good condition with recent updates and improvements. It's located in a desirable Vallejo neighborhood and is ready for immediate occupancy.
Value-add opportunities
- Both Landscaping and curb appeal improvements — Enhances curb appeal and could attract more buyers
- Both Painting exterior and interior — Fresh paint can make the home look more appealing and maintain its value
- Both Landscaping and curb appeal improvements — Enhances curb appeal and could attract more buyers
Renovation cost estimate screening
Value-add ROI direction
- Both Landscaping and curb appeal improvements — Enhances curb appeal and could attract more buyers ↑
- Both Painting exterior and interior — Fresh paint can make the home look more appealing and maintain its value ↑
- Both Landscaping and curb appeal improvements — Enhances curb appeal and could attract more buyers ↑
ⓘ Cost ranges are severity-bucket heuristics (US national rule-of-thumb). Get contractor quotes + a written scope before underwriting a rehab budget.
Schools (NCES district)
- District
- Vallejo City Unified
- NCES district ID
- 0640740
- Math proficiency
- 20% ▬ 0.00%
- Reading proficiency
- 30% ▬ 0.00%
- Median HH income
- $59,919
- Composite
- 26.02/100
- National rank
- #12743
- State rank
- #1124 of 1400 in CA
Livability — Vallejo
- Score
- 67/100
- State rank
- #304
- US rank
- #10215
Category grades
Schools grade is shown separately in the Schools card above.
Census & demographics
- Census place
- Vallejo, CA
- County
- Solano County · 433,239 people
- City population
- 125,311
- Metro
- Vallejo, CA
- Population (ZIP)
- 37,128
- Household income
- $65,290
- Rent vs Own
- Severe rent burden
- 2972.0
Population outlook (Solano County) Hauer SSP2
- Today (2025)
- 478,685 people
- By 2030
- 497,974 · +4.0%
- By 2040
- 528,515 · +10.4%
- By 2050
- 549,115 · +14.7%
- By 2075
- 587,229 · +22.7%
- By 2100
- 571,378 · +19.4%
Race, ethnicity, and origin ACS 2023
- Neighborhood character
- Highly diverse neighborhood (Simpson 0.77)
- Race & ethnicity
- Hispanic / Latino 32% White 26% Black 21% Two or more races 14% Asian 13% Native American 1%
- Hispanic origin (detail)
- Mexican 23%
- Common ancestry
- Lithuanian 2% Italian 1% Romanian 1%
- Foreign-born
- 25% · Canada, South Korea, China
- Languages at home
- 65% English-only · Spanish 21% Tagalog/Filipino 9% Other Indo-European 1%
Political lean MEDSL · Solano
- 2024 margin
- Strong D (+23.0) · D 60.0% · R 37.1% · Other 2.9%
- 2008→2024 swing
- -5.6pp toward R · 2008: 28.6pp · 2024: 23.0pp
- All cycles
- 2024: D+23.0 2020: D+30.3 2016: D+30.5 2012: D+28.1 2008: D+28.6
Not yet ingested
- Civics
- —
Market trends
- HPI YoY
- ▼ -530.45%
- Current HPI
- 321.0365
- Rent YoY
- ▲ 0.71%
- Metro
- Vallejo, CA
- State GDP YoY
- ▲ 3.21%
- F500 in state
- 116
Industry mix (Fortune 500 HQ in CA)
| Industry | F500 HQs | Revenue |
|---|---|---|
| Technology | 27 | $1,492B |
|
||
| Financial Services | 3 | $174B |
|
||
| Retail | 3 | $44B |
|
||
| Insurance | 3 | $26B |
|
||
| Media / Entertainment | 2 | $115B |
|
||
| Pharmaceuticals / Biotech | 2 | $62B |
|
||
Price history
1 event — show timeline
- 2026-06-12 Listed $148,888 San Francisco MLS
Cash-flow waterfall
monthlySold comps — $/sqft
last 12 mo · ≤1 miLoading sold comps…