 Duplex
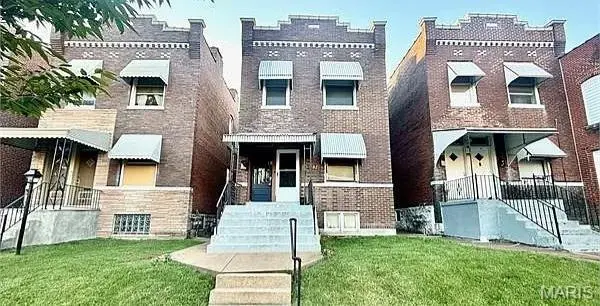
5234 Louisiana Ave · St. Louis, MO
Flood risk 1/10 · Minimal
- FEMA flood zone
- X (unshaded)
- Chance of flooding over 30 yrs
- 0.0%
- Est. flood insurance / yr
- $473 – $860
Fire risk 1/10 · Minimal
- Est. fire insurance / yr
- $1,054 – $1,958
Heat risk 5/10 · Moderate
- Hot days now (above 108°F)
- 7 days/yr
- Hot days in 30 yrs
- 21 days/yr
Wind risk 2/10 · Minimal
- Chance of severe wind over 30 yrs
- 1.0%
Air-quality risk 3/10 · Minor
- Unhealthy air days now
- 3 days/yr
- Unhealthy air days in 30 yrs
- 4 days/yr
Risk factors via First Street. Map © Google.
Why this score? — see what drove the D+ grade
The composite is a weighted blend of 9 inputs, each scored 0–100. Each bar is that input's sub-score; the figure is the points it added to the 100-point composite (weight × sub-score).
- Cash flow +25.9/30.0
- DSCR +8.7/10.0
- 1% rule +5.9/10.0
- Rent growth +3.3/5.0
- Livability +2.5/5.0
- Condition / age +2.5/5.0
- Schools +1.2/10.0
- ARV discount +0.0/15.0
- Appreciation +0.0/10.0
$175,000
🖨 Deal sheet (PDF) 📄 Offer letter ✓ Due diligence
Multi-family units
County records classify this as Multi-Family (2-4 Unit). Listing-text estimate: 2 units. confirmed
Listing remarks MLS
Beautiful, updated property available in Dutchtown! This would make a great owner occupied or awesome rental! The 2nd floor unit has been completely updated with new LVP throughout, fresh paint, new bathroom including new shower surround, facets, vanity, and toilet. Kitchen has been updated with brand new stainless appliances, countertop, new sink and facet, new backsplash. The 1st floor unit has some updates including new bathroom shower surround. This duplex has a brand new roof! The plumbing is updated with PVC. Has updated sewer line with PVC. The water heaters are newer, put in 2020. Has one newer furnace put in 2018. Also has two newer A/c’s put in 2018. This property has been very well maintained. 2nd floor is vacant ready for owner or tenant move in! 1st floor has tenant that has been there since 2016, always paid on time. 2nd floor available for viewing. 1st floor available for viewing with accepted contract.
Key facts
- Updated property
- Fresh paint
- New bathroom
Tags
Property features AI
Finance
- Other: Above-grade finished area approximately 2,128 (assessor); Lot size about 0.0771 acres
Exterior
- Utilities: Single-phase electric
- Home design: Residential income property (2–4 units); Total of 2 units
- Construction: Brick exterior
- Exterior features: Brick construction; Neighborhood: Carondelet
Interior
- Bedrooms: Two 2-bedroom units
- Bathrooms: Each unit has 1 bathroom
- Heating & cooling: Central Air
- Interior features: Central air conditioning
Neighborhood map
What this means for you Summary
Snapshot
- This is a 2 × 2-bed/1.0-bath units multifamily listed at $175k.
Deal economics
- At list price, monthly cash flow is $429 ($5k/yr) — positive. Per door: $214/mo.
- The deal already cash-flows at list — no discount required.
- Meets the 1% rule at list price ($2k rent vs $175k).
- Cap rate 9.2% vs local median 5.0% in St. Louis — top-decile yield for the area; either an underpriced asset or a hidden risk that comps aren't pricing in. Stress-test before assuming the spread holds.
Location & tenants
- Location reads: area grade D — affects rentability + tenant quality, not the cash-flow math above.
- St. Louis City (urban): math 10% / reading 18% proficiency, ranked #312 of 324 in MO (top 96%) — low school quality limits family demand, transient renter base, plan for 1-2y turnover; 80% free/reduced lunch — lower-income household profile, screen leases tightly.
- Zoned schools: Woodward Elem. (math 2% / reading 8%, grade F, #1,072 of 1,115 statewide, top 98%, 239 students, 99% FRL); Gateway Middle (math 0% / reading 8%, grade F, #389 of 391 statewide, top 100%, 506 students, 99% FRL); Roosevelt High (math 2% / reading 8%, grade F, #517 of 521 statewide, top 100%, 460 students, 99% FRL) — zoned schools average 99% FRL vs 80% district-wide (19 pts higher); higher-poverty schools than district average — tighter screening recommended.
- Market conditions: Rents rising (+3.3%/yr); 125 active listings in the ZIP; 12 comparable units currently listed for rent nearby; rentals at typical pace (median 19d on market — plan ~3-4 weeks tenant-placement turnaround); 294 units permitted in St. Louis city in 2024 (227 in 5+ unit buildings).
- At $1,914/mo this rent would consume 49% of the median local household income ($47k/yr) (locally 1364% of renters already pay >50% of income on rent) — very limited rent-growth headroom before tenants either downsize or default.
Forward outlook
- Local home prices are declining (-3.0%/yr); year-one equity from $1k of loan paydown is wiped out by about $5k of value loss. Plan a longer hold.
- St. Louis County population projected to shrink 6% by 2050 — rents likely to lag national; underwrite the cash flow, not the appreciation.
- At projected returns (-3.0% appreciation + 3.3% rent growth), your $49k cash investment doubles in ~10 years — after that, you're playing with house money.
Negotiation context
- Only 12 days on market — expect competitive offers; lowballing is unlikely to land.
- 2 sale attempts since 4y ago with the ask held roughly flat each time — persistent listings suggest the price (not the market) is what's stuck; bring a comps-based counter.
- Current owner paid $150k; 17% above their basis — modest negotiation headroom, anchor on the comps not their cost.
Risks & watch-outs
- Watch-outs: built in 1915 — expect roof / HVAC / electrical / plumbing capex.
- Climate carrying-cost: extreme-heat days projected 7→21/yr by 2055 (HVAC capex compounding) — expect insurance premiums to compound above CPI over the hold.
Questions for the listing agent
- Can we see the unit-by-unit rent roll, current vacancy, and any below-market leases? What's the average tenancy length?
- What capital expenditures (roof, boiler, parking lot, exteriors) have been made in the last 5 years, and what's planned in the next 2?
- Built in 1915 — when were the roof, HVAC, electrical panel, plumbing, and water heater last replaced?
- Is there a deadline driving the sale (1031 exchange, divorce, estate, relocation)? That informs how much negotiation room exists.
- The area grade is low — what's the realistic commute time and amenity access for the typical tenant pool here? Any planned neighborhood developments (good or bad) we should know about?
- What's the average days-on-market for RENTAL listings here right now (not sales)? A rising rental-DOM trend means longer vacancies and softer asking-rent achievability than the comps imply.
- What's the recent tenant-quality profile in this submarket — average credit score on applications, eviction rate, late-payment / NSF rate, and stable-employment percentage? A property-management company in the area should have these aggregated.
- How much new apartment / multifamily construction is in the pipeline within 1–3 miles? Heavy new supply (>2% of stock underway) typically softens rents 12–24 months out; light construction supports rent growth.
Investment metrics
- 1% rule
- 1.09% ✓
- Cap rate
- 9.23%
- Cash-on-cash
- 10.50%
- DSCR
- 1.47
- GRM
- 7.6
CMA / ARV
- ARV (on-the-fly)
- $136,192
- Comps found
- 12
Show comp detail 12 sales within ~0.75 mi
| Address | Dist | Beds/Ba | Sqft | Sold | Price | $/sf | Match |
|---|---|---|---|---|---|---|---|
| 5044 Louisiana Ave | 0.10mi | 4/2.0 | 2,196 (+3%) | 8mo | $179,000 | $82 | 83 |
| 5042 Louisiana Ave | 0.11mi | 4/2.0 | 2,196 (+3%) | 8mo | $179,000 | $82 | 83 |
| 507 Eiler St | 0.30mi | 4/2.0 | 2,016 (-5%) | 4mo | $129,900 | $64 | 74 |
| 329 Eichelberger St | 0.46mi | 4/— | 2,190 (+3%) | 8mo | $13,000 | $6 | 67 |
| 3237 Delor St | 0.37mi | 5/2.0 (+1) | 2,294 (+8%) | 6mo | $185,000 | $81 | 59 |
| 3225 Delor St | 0.40mi | 5/2.0 (+1) | 2,294 (+8%) | 6mo | $229,900 | $100 | 58 |
| 3647 Bowen St | 0.56mi | 4/2.0 | 2,250 (+6%) | 14mo | $69,000 | $31 | 52 |
| 4676 S Grand Blvd | 0.38mi | 4/2.0 | 2,400 (+13%) | 13mo | $99,900 | $42 | 50 |
| 4536 S Compton | 0.59mi | 4/2.0 | 2,304 (+8%) | 12mo | $184,900 | $80 | 48 |
| 3652 Marceline Ter | 0.44mi | 4/2.0 | 2,422 (+14%) | 13mo | $150,000 | $62 | 45 |
| 3662 Marceline Ter | 0.46mi | 4/2.0 | 2,416 (+14%) | 14mo | $93,600 | $39 | 44 |
| 4443 Minnesota Ave | 0.74mi | 3/2.0 (-1) | 2,236 (+5%) | 12mo | $139,000 | $62 | 42 |
Match score weights: distance 35% · size 25% · config 20% · recency 20%. Top-matched comps best support the ARV.
Projected returns pro-forma
-3.0% appreciation · 3.27% rent growth · sell at horizon
- IRR
- -0.3%
- Equity multiple
- 0.99×
- Total profit
- $-568
- Equity at exit
- $26,093
- IRR
- 9.6%
- Equity multiple
- 1.75×
- Total profit
- $36,633
- Equity at exit
- $15,131
Cash invested: $49,000 (down + closing). Projections, not guarantees.
Landlord ↔ Tenant lean methodology
- Overall (STATE)
- 81 Strongly Landlord-Friendly
- State Missouri
- 81 Strongly Landlord-Friendly · R+10
- County
- — inherits STATE
- City
- — inherits STATE
ZIP-level market 63111
- Rents YoY
- 3.3%
- Active inventory
- 125
- Price-to-rent
- 15.2×
Monthly cashflow live
- Estimated rent
- $1,914 high interval (Pro) →
- Mortgage (P&I)
- −$918
- Tax from tax record
- −$93 /mo · $1,110/yr
- Insurance
- −$73
- HOA
- −$0
- Vacancy / Maint / Mgmt
- −$402
- Net cashflow
- $429
Break-even live
Sensitivity live
| Price | -10% $528 | -5% $478 | +0% $429 | +5% $379 | +10% $330 |
|---|---|---|---|---|---|
| Rent | -10% $278 | -5% $353 | +0% $429 | +5% $504 | +10% $580 |
| Rate | -1.0pp $517 | -0.5pp $473 | base $429 | +0.5pp $384 | +1.0pp $337 |
2-unit breakdown (identical units grouped — click to expand)
| Units | Beds | Baths | Est. rent |
|---|---|---|---|
| 2× units | 2 | 1 | $1,914 |
| #1 | 2 | 1 | $957 |
| #2 | 2 | 1 | $957 |
| Total (2 units) | $1,914 | ||
UW: 25.0% down · 7.5% · 30yr · 1.5% tax · 5.0% vac · 8.0% maint · 8.0% mgmt
Financing live
Cash to close
- Down payment
- $43,750
- Closing costs
- $5,250
- Reserves months
- —
- Total cash needed
- —
Loan-product check · same deal, 3 products live
Conventional
25% down · 7.5% · 30yr
- Down + closing
- —
- Monthly P&I
- —
- Monthly cashflow
- —
- DSCR
- —
- Eligible?
- —
Personal DTI + credit; lowest rate.
DSCR
20% down · 8.5% · 30yr
- Down + closing
- —
- Monthly P&I
- —
- Monthly cashflow
- —
- DSCR
- —
- Eligible?
- —
No personal income docs; deal must DSCR.
Hard money
10% down · 12.0% · 12mo
- Down + closing
- —
- Monthly P&I
- —
- Monthly cashflow
- —
- DSCR
- —
- Eligible?
- —
Short-term bridge; refi at stabilization.
Rent comps 12 comps
| Address | Beds | Baths | Sqft | Rent | $/sqft | DOM | Units | Dist |
|---|---|---|---|---|---|---|---|---|
| 4450 Pennsylvania Ave Saint Louis, MO | 3.0 | 1.0 | 1500 | $1,250 | $0.83 | 0d | 1 | 0.80mi |
| 4222 S 38th St Unit 4222 St. Louis, MO | 3.0 | 2.0 | 1836 | $1,400 | $0.76 | 21d | 1 | 0.91mi |
| 3637 Meramec St Saint Louis, MO | 3.0 | 1.5 | 1632 | $1,925 | $1.18 | 18d | 1 | 0.91mi |
| 4222 S 38th St St. Louis, MO | 3.0 | 2.0 | 1836 | $1,400 | $0.76 | 0d | 1 | 0.91mi |
| 6730 Vermont Ave Saint Louis, MO | 3.0 | 2.0 | 1534 | $1,600 | $1.04 | 16d | 1 | 0.95mi |
| 6800 Virginia Ave Unit 1 St. Louis, MO | 3.0 | 1.0 | 1500 | $1,475 | $0.98 | 19d | 1 | 0.97mi |
| 4145 S Compton Ave Saint Louis, MO | 3.0 | 2.0 | 1656 | $1,520 | $0.92 | 45d | 1 | 0.99mi |
| 4135 S Compton Ave Saint Louis, MO | 3.0 | 2.0 | 2104 | $1,600 | $0.76 | 45d | 1 | 1.00mi |
| 4312 Oregon Ave Saint Louis, MO | 4.0 | 2.0 | 2032 | $2,000 | $0.98 | 0d | 1 | 1.03mi |
| 3857 Boulevard Heights Ct Saint Louis, MO | 3.0 | 2.5 | 1697 | $2,250 | $1.33 | 3d | 1 | 1.29mi |
| 3146 Keokuk St Saint Louis, MO | 3.0 | 1.0 | 1528 | $1,500 | $0.98 | 25d | 1 | 1.31mi |
| 3131 Keokuk St #3131 Saint Louis, MO | 3.0 | 2.0 | 1500 | $1,475 | $0.98 | 16d | 1 | 1.34mi |
Listing history 8 events
-
2026-06-21days on market $175,000 Active 12 DOM
-
2026-06-18days on market $175,000 Active 9 DOM
-
2026-06-17days on market $175,000 Active 8 DOM
-
2026-06-16days on market $175,000 Active 7 DOM
-
2026-06-15days on market $175,000 Active 6 DOM
-
2026-06-13days on market $175,000 Active 4 DOM
-
2026-06-10remarks 644-char remark
-
2026-06-10$175,000 Active 1 DOM
ⓘ Source: listings_history table (triggers on properties + properties_extension) + one-shot
backfill from property_details.listing_events for pre-trigger history.
Tax reassessment forecast MO · Resets to sale price
- Current annual tax
- $1,110 · $93/mo
- Projected year-2 tax
- $1,698 · $141/mo
- Expected delta
- +$587/yr (+$49/mo · 52.9%)
ⓘ Screening estimate from a state-policy table — verify with the county assessor before closing.
Climate risk First Street
- Flood 1/10 Low FEMA zone X (unshaded) · 0% chance over 30 yrs
- Wildfire 1/10 Low
- Heat 5/10 Major 7 d/yr ≥108°F today · 21 d/yr by 30 yrs out
- Wind 2/10 Low 100% chance of damaging wind over 30 yrs
- Air quality 3/10 Moderate 3 unhealthy d/yr today · 4 by 30 yrs out
Nearby sold comps map
Loading sold comps map…
Walkable amenities ~0.75 mi
Loading nearby amenities…
Taxation est. · year 1
- Rental income
- $22,968
- − Mortgage interest
- −$9,803
- − Property taxes
- −$1,110
- − Insurance
- −$875
- − Repairs & maintenance
- −$1,837
- − Management
- −$1,837
- − Depreciation
- −$5,091
- Taxable income
- $2,414
- Est. tax owed @ 24.0%
- −$579
- After-tax cash flow
- $4,567/yr
For passive investors: Depreciation is non-cash, so a rental often shows a tax loss while cash-flowing — sheltering income. Rental losses are passive: they offset passive income freely, and up to $25,000/yr can offset ordinary (W-2) income if you actively participate and your MAGI is under $100k (phasing out to $0 by $150k); unused losses carry forward. On sale, claimed depreciation is recaptured at up to 25%, and gains may owe capital-gains tax (a 1031 exchange can defer both). Figures are a year-1 estimate at your 24.0% rate — not tax advice; consult a CPA.
Schools (NCES district)
- District
- St. Louis City
- NCES district ID
- 2929280
- Math proficiency
- 10% ▼ -6.00%
- Reading proficiency
- 18% ▼ -3.00%
- Median HH income
- $35,685
- Composite
- 11.54/100
- National rank
- #9699
- State rank
- #312 of 324 in MO
Livability — St. Louis
No livability data for this city. (Only ~50 U.S. cities are tracked.)
Census & demographics
- Census place
- St. Louis, MO
- County
- Saint Louis City · 254,015 people
- City population
- 283,259
- Metro
- St. Louis, MO-IL
- Population (ZIP)
- 18,851
- Household income
- $47,039
- Rent vs Own
- Severe rent burden
- 1364.0
Population outlook (St. Louis County) Hauer SSP2
- Today (2025)
- 315,737 people
- By 2030
- 313,865 · -0.6%
- By 2040
- 305,439 · -3.3%
- By 2050
- 296,529 · -6.1%
- By 2075
- 271,028 · -14.2%
- By 2100
- 255,359 · -19.1%
Race, ethnicity, and origin ACS 2023
- Neighborhood character
- Diverse neighborhood (Simpson 0.65)
- Race & ethnicity
- Black 42% White 41% Two or more races 11% Hispanic / Latino 9% Asian 1%
- Hispanic origin (detail)
- Mexican 6%
- Common ancestry
- Lithuanian 3% Slovak 1% Romanian 1%
- Foreign-born
- 7% · Canada, India
- Languages at home
- 90% English-only · Spanish 7% Other Indo-European 1%
Political lean MEDSL · St. Louis
- 2024 margin
- Solid D (+64.7) · D 81.4% · R 16.7% · Other 2.0%
- 2008→2024 swing
- -3.5pp toward R · 2008: 68.2pp · 2024: 64.7pp
- All cycles
- 2024: D+64.7 2020: D+66.2 2016: D+63.7 2012: D+66.6 2008: D+68.2
Not yet ingested
- Civics
- —
Market trends
- HPI YoY
- ▼ -92.80%
- Current HPI
- 169.4644
- Rent YoY
- ▲ 3.27%
- Metro
- St. Louis, MO-IL
- State GDP YoY
- ▲ 1.84%
- F500 in state
- 20
Industry mix (Fortune 500 HQ in MO)
| Industry | F500 HQs | Revenue |
|---|---|---|
| Healthcare | 1 | $163B |
|
||
| Insurance | 1 | $21B |
|
||
| Industrial Technology | 1 | $17B |
|
||
| Retail | 1 | $16B |
|
||
| Industrial Distribution | 1 | $10B |
|
||
| Utilities | 1 | $9B |
|
||
Price history
+830.9% since first listed10 events — show timeline
- 2026-06-09 Listed $175,000 MARIS as Distributed by MLS Grid
- 2022-05-24 Sold (Public Records) $150,000 Public Records
- 2022-05-20 Sold (MLS) — MARIS as Distributed by MLS Grid
- 2022-04-27 Pending — MARIS as Distributed by MLS Grid
- 2022-04-24 Listed $135,000 MARIS as Distributed by MLS Grid
- 2004-10-27 Sold (Public Records) $71,000 Public Records
- 2001-01-09 Sold (Public Records) $64,000 Public Records
- 2000-03-28 Sold (Public Records) $31,000 Public Records
- 1999-01-29 Sold (Public Records) $36,000 Public Records
- 1998-04-27 Sold (Public Records) $18,800 Public Records
Property tax history
+2.5%/yrLatest (2024): $1,110 · +5.0% YoY. Source: county tax records.
Cash-flow waterfall
monthlySold comps — $/sqft
last 12 mo · ≤1 miLoading sold comps…