 🏗️ New Construction
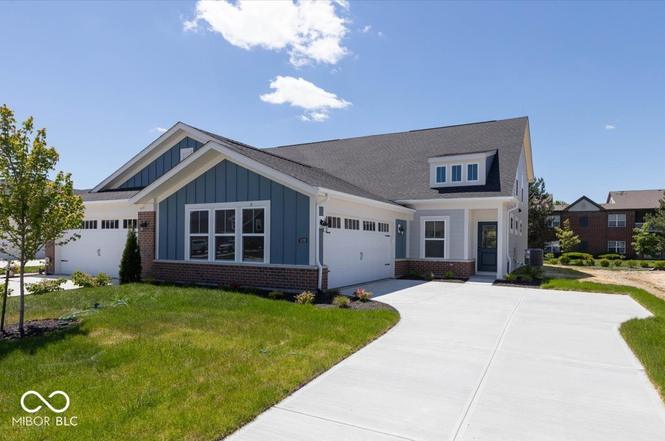
7426 Broadview Ln · McCordsville, IN
Flood risk 1/10 · Minimal
- FEMA flood zone
- X (unshaded)
- Chance of flooding over 30 yrs
- 0.0%
- Est. flood insurance / yr
- $507 – $1,088
Fire risk 1/10 · Minimal
- Est. fire insurance / yr
- $717 – $1,331
Heat risk 3/10 · Minor
- Hot days now (above 100°F)
- 7 days/yr
- Hot days in 30 yrs
- 16 days/yr
Wind risk 2/10 · Minimal
- Chance of severe wind over 30 yrs
- 1.0%
Air-quality risk 2/10 · Minimal
- Unhealthy air days now
- 1 days/yr
- Unhealthy air days in 30 yrs
- 2 days/yr
Risk factors via First Street. Map © Google.
Why this score? — see what drove the F grade
The composite is a weighted blend of 9 inputs, each scored 0–100. Each bar is that input's sub-score; the figure is the points it added to the 100-point composite (weight × sub-score).
- ARV discount +7.5/15.0
- Cash flow +6.4/30.0
- Schools +4.1/10.0
- Rent growth +3.8/5.0
- Livability +3.5/5.0
- 1% rule +2.5/10.0
- Condition / age +2.5/5.0
- DSCR +0.7/10.0
- Appreciation +0.0/10.0
$324,990
🖨 Deal sheet 📄 Offer letter ✓ Due diligence
Listing remarks
New construction by Fischer Homes in the beautiful Hampton Walk community, featuring the stunning Wembley design. This practical design offers 3 bedrooms 2 full baths, and 1 half baths. This design combines modern convenience with flexible living spaces. The open-concept layout with island kitchens and large pantry storage, creating inviting spaces perfect for both everyday living and entertaining. The owner's suite serves as a private retreat, featuring a spacious walk-in closet and private bath. This home blends practical design with customizable comfort for today's homeowners. The spacious 2-bay garage completes this exceptional home.
Key facts
- Island kitchens
- Large pantry storage
- Wembley design
Tags
Property features AI
Finance
- Other: Property listed as part of a mandatory-fee ownership; Lot approximately 1/4 acre
- HOA & community: HOA with monthly fee of $230 (includes management); HOA governed by covenants and restrictions; Management provided by association
Exterior
- Parking: Attached concrete garage; 2-car garage; Garage door opener
- Utilities: Public water; Municipal sewer connected; No solid waste service listed
- Home design: Single-family residence; New construction; Attached property; Two levels
- Construction: Brick and vinyl siding exterior; Slab foundation; Built by Fischer Homes; Construction completed
- Exterior features: Covered porch/patio; No fence; Low-maintenance yard
Interior
- Kitchen: Electric oven; Microwave; Dishwasher; Garbage disposal
- Bedrooms: Primary bedroom with walk-in closet; Total of 3 bedrooms (1 on main level, 2 on upper level)
- Bathrooms: Two full bathrooms; One half bathroom; Primary bathroom with tub and shower
- Heating & cooling: Electric heating with heat pump; Central air conditioning
- Interior features: Breakfast bar; Kitchen island; Pantry; Walk-in closets; Smoke alarm
- Laundry & utility: Main level laundry
Neighborhood map
What this means for you Summary
Snapshot
- This is a 3-bed/2.5-bath land listed at $325k.
Deal economics
- At list price, monthly cash flow is $-556 ($-7k/yr) — negative.
- To cash-flow at today's rent, offer at most $244k (24.8% below list).
- To meet the 1% rule (rent ≥ 1% of price), the offer needs to be $243k (25.2% below list).
- Recommended offer: $243k (25.2% below list) — sets the bar for 1% rule.
Location & tenants
- Location reads 69/100 on livability (#181 in IN) — a middle-class / working-renter tenant base. Strengths: employment A+, cost of living A+, housing A+; Watch: amenities F, commute F, health & safety F.
- Mt Vernon Community School Corporation (rural): math 43% / reading 48% proficiency, ranked #70 of 301 in IN (top 23%) — families likely to look elsewhere, expect single-tenant / working-renter base with shorter leases; only 18% free/reduced lunch — higher-income household profile.
- Market conditions: Rents rising fast (+5.2%/yr); 422 active listings in the ZIP; 11 comparable units currently listed for rent nearby; rentals leasing fast (median 8d on market — plan ~1-2 weeks tenant-placement turnaround); high-income renter base; 1,091 units permitted in Hancock County in 2024 (0 in 5+ unit buildings).
Forward outlook
- Local home prices are declining (-3.0%/yr); year-one equity from $2k of loan paydown is wiped out by about $10k of value loss. Plan a longer hold.
- Hancock County population projected at +7% by 2050 — modest demand growth; plan on rents tracking national, not racing it.
Negotiation context
- It's been on market 153 days — a 12% lower offer ($286k) is reasonable based on typical stale-listing flexibility.
Questions for the listing agent
- What do current leases actually rent for vs. the listed asking? Can we see a recent rent roll and the last 12 months of T-12 income?
- It's been on market 153 days. Have you received any prior offers? Is the seller open to a 25% concession, seller financing, or rate buy-down credit?
- What does the HOA fee cover, when was the last increase, and are there any pending special assessments or reserve-fund shortfalls?
- Why hasn't it sold? Are there any deal-killer items the seller is aware of (foundation, flood, title, zoning, code violations)?
- Is there a deadline driving the sale (1031 exchange, divorce, estate, relocation)? That informs how much negotiation room exists.
- Schools are B-rated — typically a magnet for longer-tenancy family renters. What's the average tenant stay here, and is there a school-zone premium baked into asking?
- The area grade is low — what's the realistic commute time and amenity access for the typical tenant pool here? Any planned neighborhood developments (good or bad) we should know about?
- What's the average days-on-market for RENTAL listings here right now (not sales)? A rising rental-DOM trend means longer vacancies and softer asking-rent achievability than the comps imply.
- What's the recent tenant-quality profile in this submarket — average credit score on applications, eviction rate, late-payment / NSF rate, and stable-employment percentage? A property-management company in the area should have these aggregated.
- How much new for-sale + rental construction is in the pipeline within 1–3 miles? Heavy new supply typically softens prices + rents 12–24 months out; constrained supply supports both.
Investment metrics
- 1% rule
- 0.75% ✗
- Cap rate
- 4.24%
- Cash-on-cash
- -7.34%
- DSCR
- 0.67
- GRM
- 11.1
CMA / ARV
No comps found within radius.
Projected returns pro-forma
-3.0% appreciation · 5.18% rent growth · sell at horizon
- IRR
- -26.3%
- Equity multiple
- 0.09×
- Total profit
- $-82,478
- Equity at exit
- $48,457
- IRR
- -16.8%
- Equity multiple
- -0.03×
- Total profit
- $-93,367
- Equity at exit
- $28,099
Cash invested: $90,997 (down + closing). Projections, not guarantees.
Landlord ↔ Tenant lean methodology
- Overall (STATE)
- 90 Strongly Landlord-Friendly
- State Indiana
- 90 Strongly Landlord-Friendly · R+11
- County
- — inherits STATE
- City
- — inherits STATE
ZIP-level market 46055
- Home prices YoY
- -20.1%
- Rents YoY
- 5.2%
- Active inventory
- 422
- Price-to-rent
- 11.1×
Monthly cashflow live
- Estimated rent
- $2,430 high interval (Pro) →
- Mortgage (P&I)
- −$1,704
- Tax est. 1.5%
- −$406 /mo · $4,875/yr
- Insurance
- −$135
- HOA
- −$230
- Vacancy / Maint / Mgmt
- −$510
- Net cashflow
- $-556
Break-even live
UW: 25.0% down · 7.5% · 30yr · 1.5% tax · 5.0% vac · 8.0% maint · 8.0% mgmt
Financing live
Cash to close
- Down payment
- $81,248
- Closing costs
- $9,750
- Reserves months
- —
- Total cash needed
- —
Loan-product check · same deal, 3 products live
Conventional
25% down · 7.5% · 30yr
- Down + closing
- —
- Monthly P&I
- —
- Monthly cashflow
- —
- DSCR
- —
- Eligible?
- —
Personal DTI + credit; lowest rate.
DSCR
20% down · 8.5% · 30yr
- Down + closing
- —
- Monthly P&I
- —
- Monthly cashflow
- —
- DSCR
- —
- Eligible?
- —
No personal income docs; deal must DSCR.
Hard money
10% down · 12.0% · 12mo
- Down + closing
- —
- Monthly P&I
- —
- Monthly cashflow
- —
- DSCR
- —
- Eligible?
- —
Short-term bridge; refi at stabilization.
Rent comps 11 comps
| Address | Beds | Baths | Sqft | Rent | $/sqft | DOM | Units | Dist |
|---|---|---|---|---|---|---|---|---|
| 6032 Windsor Dr Unit MC McCordsville, IN | 3.0 | 4.0 | 2320 | $2,400 | $1.03 | 24d | 1 | 0.21mi |
| 5790 Arcade Blvd McCordsville, IN | 3.0 | 2.5 | 2021 | $2,250 | $1.11 | 20d | 1 | 0.50mi |
| 5743 W 750 N Unit 5743 750 McCordsville, IN | 3.0 | 2.5 | 2400 | $2,050 | $0.85 | 4d | 1 | 0.55mi |
| 7044 N Mesquite Ct McCordsville, IN | 3.0 | 2.0 | 2073 | $1,991 | $0.96 | 7d | 1 | 0.64mi |
| 6654 Willow Way McCordsville, IN | 3.0–4.0 | 2.0–2.5 | 1810 | $2,485 | $1.37 | 2d | 10 | 1.02mi |
| 6267 Cypress Ct McCordsville, IN | 3.0 | 2.0 | 1673 | $2,500 | $1.49 | 2d | 1 | 1.14mi |
| 6077 W Jamison Dr McCordsville, IN | 4.0 | 2.5 | 1951 | $2,569 | $1.32 | 4d | 1 | 1.24mi |
| 5510 Wood Spring Ln McCordsville, IN | 3.0 | 2.5 | 2009 | $2,091 | $1.04 | 22d | 1 | 1.27mi |
| 7427 Cobblestone West Dr Indianapolis, IN | 3.0 | 2.0 | 1704 | $1,931 | $1.13 | 7d | 1 | 1.28mi |
| 6055 W Brickell Ln McCordsville, IN | 3.0 | 2.0 | 1827 | $2,211 | $1.21 | 16d | 1 | 1.34mi |
| 12647 Gunnison Dr Unit NA Indianapolis, IN | 3.0 | 2.5 | 2242 | $2,300 | $1.03 | 24d | 1 | 1.38mi |
HOA detail
- Monthly dues
- $230 · $2,760/yr
Listing history 11 events
-
2026-06-13statusdays on market $324,990 Pending 153 DOM
-
2026-06-09days on market $324,990 Active 152 DOM
-
2026-06-08days on market $324,990 Active 151 DOM
-
2026-06-07days on market $324,990 Active 150 DOM
-
2026-06-05days on market $324,990 Active 147 DOM
-
2026-06-03days on market $324,990 Active 146 DOM
-
2026-06-02days on market $324,990 Active 145 DOM
-
2026-06-01days on market $324,990 Active 144 DOM
-
2026-05-31days on market $324,990 Active 143 DOM
-
2026-05-07price $324,990
-
2026-01-08$339,990 Active
ⓘ Source: listings_history table (triggers on properties + properties_extension) + one-shot
backfill from property_details.listing_events for pre-trigger history.
Climate risk First Street
- Flood 1/10 Low FEMA zone X (unshaded) · 0% chance over 30 yrs
- Wildfire 1/10 Low
- Heat 3/10 Moderate 7 d/yr ≥100°F today · 16 d/yr by 30 yrs out
- Wind 2/10 Low 100% chance of damaging wind over 30 yrs
- Air quality 2/10 Low 1 unhealthy d/yr today · 2 by 30 yrs out
Nearby sold comps map
Loading sold comps map…
Walkable amenities ~0.75 mi
Loading nearby amenities…
Taxation est. · year 1
- Rental income
- $29,157
- − Mortgage interest
- −$18,204
- − Property taxes
- −$4,875
- − Insurance
- −$1,625
- − Repairs & maintenance
- −$2,333
- − Management
- −$2,333
- − HOA
- −$2,760
- − Depreciation
- −$9,454
- Taxable loss
- −$12,427
- Est. tax savings @ 24.0%
- +$2,982
- After-tax cash flow
- $-3,695/yr
For passive investors: Depreciation is non-cash, so a rental often shows a tax loss while cash-flowing — sheltering income. Rental losses are passive: they offset passive income freely, and up to $25,000/yr can offset ordinary (W-2) income if you actively participate and your MAGI is under $100k (phasing out to $0 by $150k); unused losses carry forward. On sale, claimed depreciation is recaptured at up to 25%, and gains may owe capital-gains tax (a 1031 exchange can defer both). Figures are a year-1 estimate at your 24.0% rate — not tax advice; consult a CPA.
Schools (NCES district)
- District
- Mt Vernon Community School Corporation
- NCES district ID
- 1807260
- Math proficiency
- 43% ▼ -12.00%
- Reading proficiency
- 48% ▼ -7.00%
- Median HH income
- $73,671
- Composite
- 41.3/100
- National rank
- #3514
- State rank
- #70 of 301 in IN
Livability — McCordsville
- Score
- 69/100
- State rank
- #181
- US rank
- #8388
Category grades
Schools grade is shown separately in the Schools card above.
Census & demographics
- Census place
- McCordsville, IN
- County
- Hancock County · 59,521 people
- City population
- 16,010
- Metro
- Indianapolis-Carmel-Anderson, IN
- Population (ZIP)
- 16,010
- Household income
- $113,784
- Rent vs Own
- Severe rent burden
- 58.0
Population outlook (Hancock County) Hauer SSP2
- Today (2025)
- 77,820 people
- By 2030
- 79,914 · +2.7%
- By 2040
- 82,734 · +6.3%
- By 2050
- 83,348 · +7.1%
- By 2075
- 82,439 · +5.9%
- By 2100
- 74,181 · -4.7%
Race, ethnicity, and origin ACS 2023
- Neighborhood character
- Predominantly White (77%)
- Race & ethnicity
- White 77% Black 13% Two or more races 6% Hispanic / Latino 4% Asian 1%
- Common ancestry
- Lithuanian 3% Italian 3% Romanian 3%
- Foreign-born
- 4% · Canada, Vietnam, Jamaica
- Languages at home
- 94% English-only · Spanish 4%
Political lean MEDSL · Hancock
- 2024 margin
- Solid R (+33.7) · D 32.2% · R 65.9% · Other 1.9%
- 2008→2024 swing
- -4.1pp toward R · 2008: -29.6pp · 2024: -33.7pp
- All cycles
- 2024: R+33.7 2020: R+37.5 2016: R+44.8 2012: R+41.0 2008: R+29.6
Not yet ingested
- Civics
- —
Market trends
- HPI YoY
- ▼ -52.35%
- Current HPI
- 207.9764
- Rent YoY
- ▲ 5.18%
- Metro
- Indianapolis-Carmel-Anderson, IN
- State GDP YoY
- ▲ 2.90%
- F500 in state
- 18
Industry mix (Fortune 500 HQ in IN)
| Industry | F500 HQs | Revenue |
|---|---|---|
| Industrial Machinery | 2 | $37B |
|
||
| Healthcare | 1 | $177B |
|
||
| Pharmaceuticals | 1 | $45B |
|
||
| Metals / Steel | 1 | $18B |
|
||
| Agriculture | 1 | $17B |
|
||
| Packaging | 1 | $12B |
|
||
Price history
-4.4% since first listed2 events — show timeline
- 2026-05-07 Price Changed $324,990 MIBOR as Distributed by MLS Grid
- 2026-01-08 Listed $339,990 MIBOR as Distributed by MLS Grid
Cash-flow waterfall
monthlySold comps — $/sqft
last 12 mo · ≤1 miLoading sold comps…