 Triplex
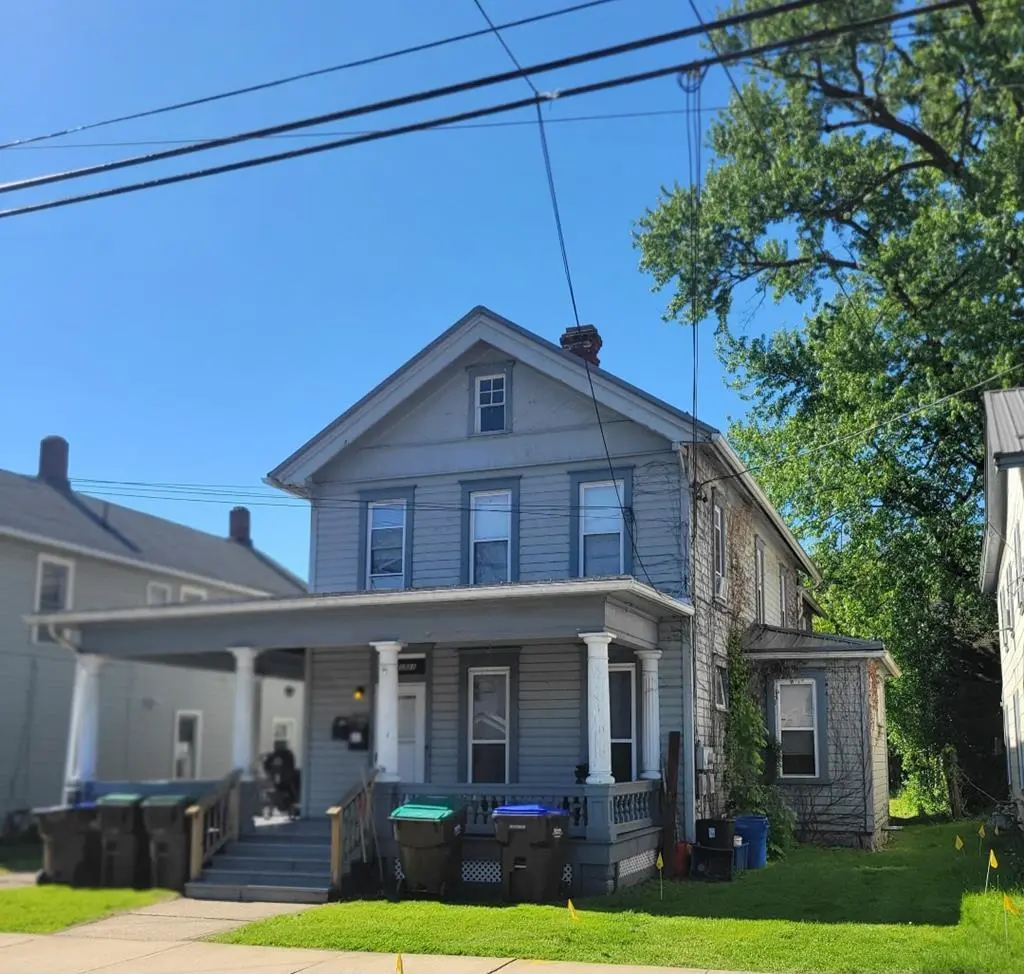
1321 Otter St · Franklin, PA
Flood risk 1/10 · Minimal
- FEMA flood zone
- X (unshaded)
- Chance of flooding over 30 yrs
- 0.0%
- Est. flood insurance / yr
- $473 – $860
Fire risk 3/10 · Minor
- Est. fire insurance / yr
- $511 – $949
Heat risk 3/10 · Minor
- Hot days now (above 93°F)
- 8 days/yr
- Hot days in 30 yrs
- 20 days/yr
Wind risk 1/10 · Minimal
- Chance of severe wind over 30 yrs
- —
Air-quality risk 2/10 · Minimal
- Unhealthy air days now
- 1 days/yr
- Unhealthy air days in 30 yrs
- 2 days/yr
Risk factors via First Street. Map © Google.
Why this score? — see what drove the B grade
The composite is a weighted blend of 9 inputs, each scored 0–100. Each bar is that input's sub-score; the figure is the points it added to the 100-point composite (weight × sub-score).
- Cash flow +30.0/30.0
- 1% rule +10.0/10.0
- DSCR +10.0/10.0
- Appreciation +10.0/10.0
- Livability +3.5/5.0
- Schools +3.2/10.0
- Rent growth +2.5/5.0
- Condition / age +2.5/5.0
- ARV discount +0.0/15.0
$140,000
🖨 Deal sheet (PDF) 📄 Offer letter ✓ Due diligence
Multi-family units
County records classify this as Multi-Family (2-4 Unit). Listing-text estimate: 3 units. confirmed
Listing remarks MLS
Good downtown investment property with long rental history & nice size apartments - each with their own porches. Newer H. W. heating, newer carpets, some new windows, modern kitchens & baths. This tri-plex offers excellent income potential. Note: Apartment C is up/down & square footage is for both floors.
Key facts
- 6,098 sq ft lot
- Built 1900
- Listed 13 days
Property features AI
Exterior
- Utilities: Public water; Public sewer; 100 Amp electric service with circuit breakers; Cable available
- Home design: Residential income property; Metal roof; Wood siding construction; R-2 zoning
- Construction: Combination foundation
- Exterior features: Porch
Interior
- Kitchen: Refrigerator; Gas water heater
- Flooring: Vinyl flooring; Other flooring
- Heating & cooling: Baseboard heating; Hot water heating; Has cooling
- Interior features: Partial basement; 13 total rooms; No fireplace
Neighborhood map
What this means for you Summary
Snapshot
- This is a 3 × 2-bed/1.0-bath units multifamily listed at $140k.
Deal economics
- At list price, monthly cash flow is $2k ($19k/yr) — positive. Per door: $516/mo.
- The deal already cash-flows at list — no discount required.
- Meets the 1% rule at list price ($3k rent vs $140k).
- Cap rate 19.6% vs local median 5.8% in Franklin — top-decile yield for the area; either an underpriced asset or a hidden risk that comps aren't pricing in. Stress-test before assuming the spread holds.
Location & tenants
- Location reads 69/100 on livability (#812 in PA) — a middle-class / working-renter tenant base. Strengths: cost of living A+, housing A+, crime B+; Watch: health & safety C-, employment D, amenities F.
- Franklin Area SD (rural): math 29% / reading 46% proficiency, ranked #388 of 539 in PA (top 72%) — families likely to look elsewhere, expect single-tenant / working-renter base with shorter leases.
- Zoned schools: Central El Sch (math 17% / reading 41%, grade F, #1,146 of 1,518 statewide, top 76%, 397 students, 100% FRL); Franklin Area Jshs (math 28% / reading 44%, grade F, #300 of 437 statewide, top 70%, 834 students, 84% FRL) — zoned schools average 92% FRL vs 46% district-wide (46 pts higher); higher-poverty schools than district average — tighter screening recommended.
- Market conditions: 51 active listings in the ZIP; 42 units permitted in Venango County in 2024 (0 in 5+ unit buildings).
Forward outlook
- In year one you build about $15k of equity ($968 loan paydown + $14k appreciation (10.0% local appreciation)).
- Venango County population projected at -30% by 2050 — secular population decline; favor cash flow + early exit over multi-decade hold.
- At projected returns (10.0% appreciation + 3.0% rent growth), your $39k cash investment doubles in ~2 years — after that, you're playing with house money.
- By year 3, paydown + projected appreciation supports a ~$38k cash-out refi (75% LTV) — recoverable capital for the next deal without selling this one.
Negotiation context
- Only 13 days on market — expect competitive offers; lowballing is unlikely to land.
- Current owner paid $63k; list at $140k implies a 122% gain — meaningful room to come down on a strong offer.
Risks & watch-outs
- Watch-outs: built in 1900 — expect roof / HVAC / electrical / plumbing capex.
Questions for the listing agent
- Can we see the unit-by-unit rent roll, current vacancy, and any below-market leases? What's the average tenancy length?
- What capital expenditures (roof, boiler, parking lot, exteriors) have been made in the last 5 years, and what's planned in the next 2?
- Built in 1900 — when were the roof, HVAC, electrical panel, plumbing, and water heater last replaced?
- Is there a deadline driving the sale (1031 exchange, divorce, estate, relocation)? That informs how much negotiation room exists.
- Schools are D-rated, which usually means shorter tenancies and higher turnover. Who's the typical renter profile here, and what's been the actual vacancy rate?
- What's the average days-on-market for RENTAL listings here right now (not sales)? A rising rental-DOM trend means longer vacancies and softer asking-rent achievability than the comps imply.
- What's the recent tenant-quality profile in this submarket — average credit score on applications, eviction rate, late-payment / NSF rate, and stable-employment percentage? A property-management company in the area should have these aggregated.
- How much new apartment / multifamily construction is in the pipeline within 1–3 miles? Heavy new supply (>2% of stock underway) typically softens rents 12–24 months out; light construction supports rent growth.
Investment metrics
- 1% rule
- 2.25% ✓
- Cap rate
- 19.56%
- Cash-on-cash
- 47.37%
- DSCR
- 3.11
- GRM
- 3.7
CMA / ARV
- ARV (on-the-fly)
- $117,304
- Comps found
- 3
Show comp detail 3 sales within ~0.75 mi
| Address | Dist | Beds/Ba | Sqft | Sold | Price | $/sf | Match |
|---|---|---|---|---|---|---|---|
| 1339-1341 Franklin Ave | 0.06mi | 6/2.0 | 2,496 (-6%) | 9mo | $110,000 | $44 | 75 |
| 1432 Otter St | 0.14mi | 6/2.0 | 2,624 (-2%) | 16mo | $67,000 | $26 | 74 |
| 914-916 Buffalo St | 0.67mi | 5/3.0 (-1) | 2,470 (-7%) | 12mo | $120,000 | $49 | 42 |
Match score weights: distance 35% · size 25% · config 20% · recency 20%. Top-matched comps best support the ARV.
Projected returns pro-forma
10.0% appreciation · 3.0% rent growth · sell at horizon
- IRR
- 61.4%
- Equity multiple
- 5.46×
- Total profit
- $174,834
- Equity at exit
- $126,123
- IRR
- 54.9%
- Equity multiple
- 12.16×
- Total profit
- $437,424
- Equity at exit
- $271,989
Cash invested: $39,200 (down + closing). Projections, not guarantees.
Landlord ↔ Tenant lean methodology
- Overall (STATE)
- 62 Landlord-Friendly
- State Pennsylvania
- 62 Landlord-Friendly · EVEN
- County
- — inherits STATE
- City
- — inherits STATE
ZIP-level market 16323
- Home prices YoY
- 12.2%
- Active inventory
- 51
- Price-to-rent
- 11.1×
Monthly cashflow live
- Estimated rent
- $3,155 medium interval (Pro) →
- Mortgage (P&I)
- −$734
- Tax from tax record
- −$153 /mo · $1,831/yr
- Insurance
- −$58
- HOA
- −$0
- Vacancy / Maint / Mgmt
- −$663
- Net cashflow
- $1,547
Break-even live
Sensitivity live
| Price | -10% $1,627 | -5% $1,587 | +0% $1,547 | +5% $1,508 | +10% $1,468 |
|---|---|---|---|---|---|
| Rent | -10% $1,298 | -5% $1,423 | +0% $1,547 | +5% $1,672 | +10% $1,797 |
| Rate | -1.0pp $1,618 | -0.5pp $1,583 | base $1,547 | +0.5pp $1,511 | +1.0pp $1,474 |
3-unit breakdown (identical units grouped — click to expand)
| Units | Beds | Baths | Est. rent |
|---|---|---|---|
| 3× units | 2 | 1 | $3,156 |
| #1 | 2 | 1 | $1,052 |
| #2 | 2 | 1 | $1,052 |
| #3 | 2 | 1 | $1,052 |
| Total (3 units) | $3,155 | ||
UW: 25.0% down · 7.5% · 30yr · 1.5% tax · 5.0% vac · 8.0% maint · 8.0% mgmt
Financing live
Cash to close
- Down payment
- $35,000
- Closing costs
- $4,200
- Reserves months
- —
- Total cash needed
- —
Loan-product check · same deal, 3 products live
Conventional
25% down · 7.5% · 30yr
- Down + closing
- —
- Monthly P&I
- —
- Monthly cashflow
- —
- DSCR
- —
- Eligible?
- —
Personal DTI + credit; lowest rate.
DSCR
20% down · 8.5% · 30yr
- Down + closing
- —
- Monthly P&I
- —
- Monthly cashflow
- —
- DSCR
- —
- Eligible?
- —
No personal income docs; deal must DSCR.
Hard money
10% down · 12.0% · 12mo
- Down + closing
- —
- Monthly P&I
- —
- Monthly cashflow
- —
- DSCR
- —
- Eligible?
- —
Short-term bridge; refi at stabilization.
Listing history 11 events
-
2026-06-21days on market $140,000 Active 13 DOM
-
2026-06-19days on market $140,000 Active 11 DOM
-
2026-06-18days on market $140,000 Active 10 DOM
-
2026-06-17days on market $140,000 Active 9 DOM
-
2026-06-16days on market $140,000 Active 8 DOM
-
2026-06-15days on market $140,000 Active 7 DOM
-
2026-06-14days on market $140,000 Active 5 DOM
-
2026-06-13days on market $140,000 Active 4 DOM
-
2026-06-10days on market $140,000 Active 2 DOM
-
2026-06-09remarks 411-char remark
-
2026-06-09$140,000 Active 1 DOM
ⓘ Source: listings_history table (triggers on properties + properties_extension) + one-shot
backfill from property_details.listing_events for pre-trigger history.
Tax reassessment forecast PA · Partial reset (capped growth)
- Current annual tax
- $1,831 · $153/mo
- Projected year-2 tax
- $2,021 · $168/mo
- Expected delta
- +$191/yr (+$16/mo · 10.4%)
ⓘ Screening estimate from a state-policy table — verify with the county assessor before closing.
Climate risk First Street
- Flood 1/10 Low FEMA zone X (unshaded) · 0% chance over 30 yrs
- Wildfire 3/10 Moderate
- Heat 3/10 Moderate 8 d/yr ≥93°F today · 20 d/yr by 30 yrs out
- Wind 1/10 Low
- Air quality 2/10 Low 1 unhealthy d/yr today · 2 by 30 yrs out
Nearby sold comps map
Loading sold comps map…
Walkable amenities ~0.75 mi
Loading nearby amenities…
Taxation est. · year 1
- Rental income
- $37,860
- − Mortgage interest
- −$7,842
- − Property taxes
- −$1,831
- − Insurance
- −$700
- − Repairs & maintenance
- −$3,029
- − Management
- −$3,029
- − Depreciation
- −$4,073
- Taxable income
- $17,357
- Est. tax owed @ 24.0%
- −$4,166
- After-tax cash flow
- $14,403/yr
For passive investors: Depreciation is non-cash, so a rental often shows a tax loss while cash-flowing — sheltering income. Rental losses are passive: they offset passive income freely, and up to $25,000/yr can offset ordinary (W-2) income if you actively participate and your MAGI is under $100k (phasing out to $0 by $150k); unused losses carry forward. On sale, claimed depreciation is recaptured at up to 25%, and gains may owe capital-gains tax (a 1031 exchange can defer both). Figures are a year-1 estimate at your 24.0% rate — not tax advice; consult a CPA.
Schools (NCES district)
- District
- Franklin Area SD
- NCES district ID
- 4210200
- Math proficiency
- 29% ▼ -6.00%
- Reading proficiency
- 46% ▼ -12.00%
- Median HH income
- $43,451
- Composite
- 31.73/100
- National rank
- #5910
- State rank
- #388 of 539 in PA
Livability — Franklin
- Score
- 69/100
- State rank
- #812
- US rank
- #8260
Category grades
Schools grade is shown separately in the Schools card above.
Census & demographics
- Census place
- Franklin, PA
- Population (ZIP)
- 14,694
Population outlook (Venango County) Hauer SSP2
- Today (2025)
- 48,827 people
- By 2030
- 46,061 · -5.7%
- By 2040
- 39,989 · -18.1%
- By 2050
- 34,094 · -30.2%
- By 2075
- 22,500 · -53.9%
- By 2100
- 13,659 · -72.0%
Race, ethnicity, and origin ACS 2023
- Neighborhood character
- Predominantly White (92%)
- Race & ethnicity
- White 92% Two or more races 3% Black 2%
- Common ancestry
- Romanian 4% Iranian 3% Serbian 2%
- Foreign-born
- 1% · Canada
Political lean MEDSL · Venango
- 2024 margin
- Solid R (+42.1) · D 28.5% · R 70.6%
- 2008→2024 swing
- -22.9pp toward R · 2008: -19.2pp · 2024: -42.1pp
- All cycles
- 2024: R+42.1 2020: R+41.4 2016: R+42.4 2012: R+26.3 2008: R+19.2
Not yet ingested
- Civics
- —
Market trends
- HPI YoY
- ▲ 26.68%
- Current HPI
- 245.9766
- Rent YoY
- —
- Metro
- —
- State GDP YoY
- ▲ 1.68%
- F500 in state
- 34
Industry mix (Fortune 500 HQ in PA)
| Industry | F500 HQs | Revenue |
|---|---|---|
| Healthcare | 2 | $309B |
|
||
| Insurance | 2 | $27B |
|
||
| Telecommunications / Media | 1 | $124B |
|
||
| Industrial Distribution | 1 | $22B |
|
||
| Financial Services | 1 | $20B |
|
||
| Chemicals / Materials | 1 | $18B |
|
||
Price history
+211.1% since first listed3 events — show timeline
- 2026-06-08 Listed $140,000 AVBREALTORS
- 2008-08-26 Sold (MLS) $63,000 AVBREALTORS
- 2001-06-04 Sold (MLS) $45,000 AVBREALTORS
Property tax history
+1.4%/yrLatest (2026): $1,831 · +3.3% YoY. Source: county tax records.
Cash-flow waterfall
monthlySold comps — $/sqft
last 12 mo · ≤1 miLoading sold comps…