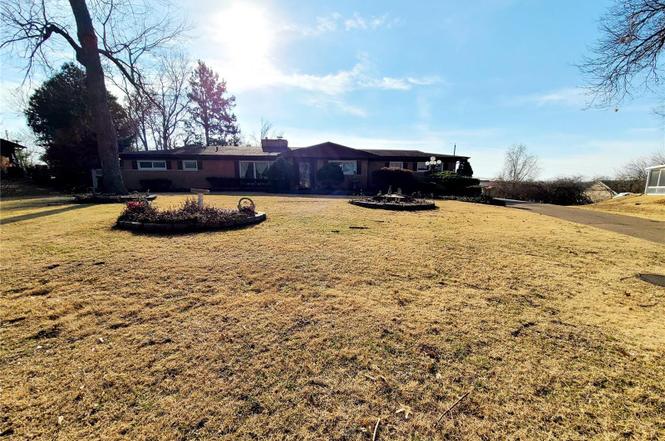
42 Harneywold Dr · Ferguson, MO
Flood risk 1/10 · Minimal
- FEMA flood zone
- X (unshaded)
- Chance of flooding over 30 yrs
- 0.0%
- Est. flood insurance / yr
- $473 – $860
Fire risk 1/10 · Minimal
- Est. fire insurance / yr
- $1,054 – $1,958
Heat risk 4/10 · Minor
- Hot days now (above 106°F)
- 7 days/yr
- Hot days in 30 yrs
- 20 days/yr
Wind risk 2/10 · Minimal
- Chance of severe wind over 30 yrs
- 1.0%
Air-quality risk 3/10 · Minor
- Unhealthy air days now
- 3 days/yr
- Unhealthy air days in 30 yrs
- 5 days/yr
Risk factors via First Street. Map © Google.
Why this score? — see what drove the D+ grade
The composite is a weighted blend of 9 inputs, each scored 0–100. Each bar is that input's sub-score; the figure is the points it added to the 100-point composite (weight × sub-score).
- Cash flow +16.1/30.0
- Appreciation +6.9/10.0
- ARV discount +5.3/15.0
- DSCR +5.0/10.0
- 1% rule +4.4/10.0
- Rent growth +3.7/5.0
- Livability +2.9/5.0
- Condition / age +2.5/5.0
- Schools +1.7/10.0
$166,500
🖨 Deal sheet 📄 Offer letter ✓ Due diligence
Listing remarks MLS
Lovely Ranch home in quiet neighborhood on half acre fenced lot. Walk into large front room extending into dining area complete with a large picture window and two-sided fireplace. Large eat in kitchen with ceramic counter tops and flooring. Main bedroom ensuite, 2 additional bedrooms, full hall bathroom and family room completes the main level. The lower level is great for entertainment with a rec room, full bath, bonus room, and storage area. The screened porch looks out to a great backyard with plenty of space for outdoor fun! Nearby shopping, Starbucks, Sam's and so much more. Easy access to major highways.
Key facts
- Private subdivision
- Custom built homes
- Large patio
Tags
Neighborhood map
What this means for you Summary
Snapshot
- This is a 3-bed/2.0-bath single-family listed at $166k.
Deal economics
- At list price, monthly cash flow is $85 ($1k/yr) — positive.
- The deal already cash-flows at list — no discount required.
- To meet the 1% rule (rent ≥ 1% of price), the offer needs to be $156k (6.4% below list).
- Recommended offer: $156k (6.4% below list) — sets the bar for 1% rule.
- Cap rate 6.9% vs local median 9.2% in Ferguson — below-typical yield; the buyer is paying a premium for something (appreciation thesis, condition, location) that the cap rate doesn't capture.
Location & tenants
- Location reads 58/100 on livability (#586 in MO) — a working-class tenant base; expect higher turnover. Strengths: cost of living A+, housing B+; Watch: health & safety C-, crime F, amenities F.
- Hazelwood (suburban): math 11% / reading 26% proficiency, ranked #306 of 324 in MO (top 94%) — low school quality limits family demand, transient renter base, plan for 1-2y turnover.
- Zoned schools: Keeven Elem. (math 2% / reading 17%, grade F, #1,037 of 1,115 statewide, top 94%, 267 students, 99% FRL); Hazelwood Central High (math 12% / reading 33%, grade F, #455 of 521 statewide, top 88%, 1,628 students, 52% FRL) — zoned schools average 75% FRL vs 53% district-wide (22 pts higher); higher-poverty schools than district average — tighter screening recommended.
- Market conditions: Rents rising fast (+5.0%/yr); 372 active listings in the ZIP; 14 comparable units currently listed for rent nearby; rentals lingering (median 44d on market — plan ~5-8 weeks vacancy on turnover, expect pricing pressure); 64% of comp listings sitting > 30 days — soft ceiling on asking rent; lower-income renter base — watch delinquency; 920 units permitted in St. Louis County in 2024 (250 in 5+ unit buildings).
- At $1,558/mo this rent would consume 45% of the median local household income ($41k/yr) (locally 3085% of renters already pay >50% of income on rent) — very limited rent-growth headroom before tenants either downsize or default.
Forward outlook
- In year one you build about $7k of equity ($1k loan paydown + $6k appreciation (3.8% local appreciation)).
- At projected returns (3.8% appreciation + 5.0% rent growth), your $47k cash investment doubles in ~5 years — after that, you're playing with house money.
- By year 5, paydown + projected appreciation supports a ~$32k cash-out refi (75% LTV) — recoverable capital for the next deal without selling this one.
Negotiation context
- It's been on market 52 days — a 3% lower offer ($162k) is reasonable based on typical stale-listing flexibility.
- 4 sale attempts since 3y ago with the ask held roughly flat each time — persistent listings suggest the price (not the market) is what's stuck; bring a comps-based counter.
Risks & watch-outs
- Watch-outs: built in 1959 — expect roof / HVAC / electrical / plumbing capex.
Questions for the listing agent
- It's been on market 52 days. Have you received any prior offers? Is the seller open to a 6% concession, seller financing, or rate buy-down credit?
- Built in 1959 — when were the roof, HVAC, electrical panel, plumbing, and water heater last replaced?
- What does the HOA fee cover, when was the last increase, and are there any pending special assessments or reserve-fund shortfalls?
- Is there a deadline driving the sale (1031 exchange, divorce, estate, relocation)? That informs how much negotiation room exists.
- Schools are F-rated, which usually means shorter tenancies and higher turnover. Who's the typical renter profile here, and what's been the actual vacancy rate?
- Crime grade is F in this area — have there been break-ins, vandalism, or insurance claims at this property in the last 3 years? What carrier currently insures it and at what premium?
- The area grade is low — what's the realistic commute time and amenity access for the typical tenant pool here? Any planned neighborhood developments (good or bad) we should know about?
- What's the average days-on-market for RENTAL listings here right now (not sales)? A rising rental-DOM trend means longer vacancies and softer asking-rent achievability than the comps imply.
- What's the recent tenant-quality profile in this submarket — average credit score on applications, eviction rate, late-payment / NSF rate, and stable-employment percentage? A property-management company in the area should have these aggregated.
- How much new for-sale + rental construction is in the pipeline within 1–3 miles? Heavy new supply typically softens prices + rents 12–24 months out; constrained supply supports both.
Investment metrics
- 1% rule
- 0.94% ✗
- Cap rate
- 6.91%
- Cash-on-cash
- 2.19%
- DSCR
- 1.10
- GRM
- 8.9
CMA / ARV
- ARV (on-the-fly)
- $158,865
- Comps found
- 12
Show comp detail 12 sales within ~0.75 mi
| Address | Dist | Beds/Ba | Sqft | Sold | Price | $/sf | Match |
|---|---|---|---|---|---|---|---|
| 1714 Foley Dr | 0.15mi | 3/2.0 | 2,022 (+8%) | 10mo | $184,900 | $91 | 71 |
| 1718 Foley Dr | 0.16mi | 3/1.0 | 1,632 (-13%) | 4mo | $165,900 | $102 | 64 |
| 62 Harneywold Dr | 0.21mi | 3/3.0 | 2,127 (+14%) | 4mo | $200,000 | $94 | 60 |
| 10231 Tanner Dr | 0.57mi | 3/2.0 | 1,814 (-3%) | 15mo | $149,000 | $82 | 56 |
| 10301 Trask Dr | 0.58mi | 3/2.0 | 1,814 (-3%) | 15mo | $154,900 | $85 | 55 |
| 10633 Trask Dr | 0.27mi | 3/1.5 | 2,140 (+14%) | 8mo | $174,900 | $82 | 54 |
| 11256 Liberty Landing Dr | 0.73mi | 3/2.5 | 1,981 (+6%) | 8mo | $184,900 | $93 | 47 |
| 1400 Hudson Rd | 0.68mi | 4/2.0 (+1) | 2,048 (+10%) | 0mo | $170,000 | $83 | 47 |
| 2829 Liberty Landing Ct | 0.72mi | 3/2.5 | 1,987 (+6%) | 12mo | $179,000 | $90 | 44 |
| 2122 Green Slope Dr | 0.74mi | 4/2.5 (+1) | 1,944 (+4%) | 10mo | $165,000 | $85 | 44 |
| 10341 Pearson Dr | 0.51mi | 3/2.0 | 1,614 (-14%) | 13mo | $115,000 | $71 | 42 |
| 10325 Deem Dr | 0.71mi | 3/1.0 | 1,735 (-7%) | 10mo | $142,900 | $82 | 42 |
Match score weights: distance 35% · size 25% · config 20% · recency 20%. Top-matched comps best support the ARV.
Projected returns pro-forma
3.79% appreciation · 4.97% rent growth · sell at horizon
- IRR
- 12.7%
- Equity multiple
- 1.77×
- Total profit
- $35,717
- Equity at exit
- $82,382
- IRR
- 15.1%
- Equity multiple
- 3.49×
- Total profit
- $116,131
- Equity at exit
- $133,144
Cash invested: $46,620 (down + closing). Projections, not guarantees.
Landlord ↔ Tenant lean methodology
- Overall (STATE)
- 81 Strongly Landlord-Friendly
- State Missouri
- 81 Strongly Landlord-Friendly · R+10
- County
- — inherits STATE
- City
- — inherits STATE
ZIP-level market 63136
- Home prices YoY
- 0.9%
- Rents YoY
- 5.0%
- Active inventory
- 372
- Price-to-rent
- 8.9×
Monthly cashflow live
- Estimated rent
- $1,558 high interval (Pro) →
- Mortgage (P&I)
- −$873
- Tax from tax record
- −$199 /mo · $2,386/yr
- Insurance
- −$69
- HOA
- −$4
- Vacancy / Maint / Mgmt
- −$327
- Net cashflow
- $85
Break-even live
UW: 25.0% down · 7.5% · 30yr · 1.5% tax · 5.0% vac · 8.0% maint · 8.0% mgmt
Financing live
Cash to close
- Down payment
- $41,625
- Closing costs
- $4,995
- Reserves months
- —
- Total cash needed
- —
Loan-product check · same deal, 3 products live
Conventional
25% down · 7.5% · 30yr
- Down + closing
- —
- Monthly P&I
- —
- Monthly cashflow
- —
- DSCR
- —
- Eligible?
- —
Personal DTI + credit; lowest rate.
DSCR
20% down · 8.5% · 30yr
- Down + closing
- —
- Monthly P&I
- —
- Monthly cashflow
- —
- DSCR
- —
- Eligible?
- —
No personal income docs; deal must DSCR.
Hard money
10% down · 12.0% · 12mo
- Down + closing
- —
- Monthly P&I
- —
- Monthly cashflow
- —
- DSCR
- —
- Eligible?
- —
Short-term bridge; refi at stabilization.
Rent comps 14 comps
| Address | Beds | Baths | Sqft | Rent | $/sqft | DOM | Units | Dist |
|---|---|---|---|---|---|---|---|---|
| 10304 Bon Oak Dr Saint Louis, MO | 3.0 | 1.5 | 1500 | $1,250 | $0.83 | 43d | 1 | 0.61mi |
| 1915 Green Valley Dr Saint Louis, MO | 4.0 | 2.0 | 1740 | $1,500 | $0.86 | 4d | 1 | 0.68mi |
| 62 Capitol Hill Dr Saint Louis, MO | 3.0 | 2.0 | 1239 | $1,250 | $1.01 | 43d | 1 | 0.75mi |
| 10606 Kilbourn Dr Saint Louis, MO | 3.0 | 2.0 | 2100 | $1,395 | $0.66 | 43d | 1 | 0.98mi |
| 2259 Ainsworth Dr Saint Louis, MO | 4.0 | 2.0 | 1500 | $1,776 | $1.18 | 43d | 1 | 0.99mi |
| 2259 Ainsworth Dr Saint Louis, MO | 4.0 | 2.0 | 1561 | $2,100 | $1.35 | 1d | 1 | 0.99mi |
| 2544 Netherton Dr Saint Louis, MO | 3.0 | 2.0 | 1288 | $1,945 | $1.51 | 1d | 1 | 1.08mi |
| 3582 Pershall Rd Unit 3631 Ferguson, MO | 2.0 | 2.0 | 1500 | $1,295 | $0.86 | 43d | 1 | 1.20mi |
| 3585 Pershall Rd Ferguson, MO | 2.0 | 2.0 | 1388 | $1,400 | $1.01 | 43d | 1 | 1.27mi |
| 3585 Pershall Rd Unit Savana Ferguson, MO | 2.0 | 1.5 | 1518 | $1,375 | $0.91 | 43d | 1 | 1.27mi |
| 3585 Pershall Rd Unit Moor Ferguson, MO | 3.0 | 2.0 | 1577 | $1,500 | $0.95 | 43d | 1 | 1.27mi |
| 4872 Bristol Rock Rd Black Jack, MO | 4.0 | 2.0 | 1448 | $2,061 | $1.42 | 2d | 1 | 1.41mi |
| 25 S Dellwood Ave Saint Louis, MO | 3.0 | 1.0 | 1944 | $1,600 | $0.82 | 43d | 1 | 1.44mi |
| 536 Ames Pl Saint Louis, MO | 4.0 | 1.5 | 1305 | $1,750 | $1.34 | 1d | 1 | 1.47mi |
HOA detail
- Monthly dues
- $4 · $48/yr
Listing history 12 events
-
2026-03-30status Pending
-
2026-03-10historical Active Under Contract
-
2026-03-05status Active
-
2026-01-29status Pending
-
2026-01-12status Active Under Contract
-
2025-12-30$166,500 Active
-
2023-03-14soldstatus $195,000
-
2023-03-10soldstatus Closed 627-char remark
Show marketing remark (627 chars)
Lovely Ranch home in quiet neighborhood on half acre fenced lot. Walk into large front room extending into dining area complete with a large picture window and two-sided fireplace. Large eat in kitchen with ceramic counter tops and flooring. Main bedroom ensuite, 2 additional bedrooms, full hall bathroom and family room completes the main level. The lower level is great for entertainment with a rec room, full bath, bonus room, and storage area. The screened porch looks out to a great backyard with plenty of space for outdoor fun! Nearby shopping, Starbucks, Sam's and so much more. Easy access to major highways.
-
2023-01-26status Pending 627-char remark
Show marketing remark (627 chars)
Lovely Ranch home in quiet neighborhood on half acre fenced lot. Walk into large front room extending into dining area complete with a large picture window and two-sided fireplace. Large eat in kitchen with ceramic counter tops and flooring. Main bedroom ensuite, 2 additional bedrooms, full hall bathroom and family room completes the main level. The lower level is great for entertainment with a rec room, full bath, bonus room, and storage area. The screened porch looks out to a great backyard with plenty of space for outdoor fun! Nearby shopping, Starbucks, Sam's and so much more. Easy access to major highways.
-
2023-01-12$195,000 Active 627-char remark
Show marketing remark (627 chars)
Lovely Ranch home in quiet neighborhood on half acre fenced lot. Walk into large front room extending into dining area complete with a large picture window and two-sided fireplace. Large eat in kitchen with ceramic counter tops and flooring. Main bedroom ensuite, 2 additional bedrooms, full hall bathroom and family room completes the main level. The lower level is great for entertainment with a rec room, full bath, bonus room, and storage area. The screened porch looks out to a great backyard with plenty of space for outdoor fun! Nearby shopping, Starbucks, Sam's and so much more. Easy access to major highways.
-
2002-11-07soldstatus $154,900
-
1979-10-01soldstatus
ⓘ Source: listings_history table (triggers on properties + properties_extension) + one-shot
backfill from property_details.listing_events for pre-trigger history.
Tax reassessment forecast MO · Resets to sale price
- Current annual tax
- $2,386 · $199/mo
- Projected year-2 tax
- $2,386 · $199/mo
- Expected delta
- $0/yr ($0/mo · 0.0%)
ⓘ Screening estimate from a state-policy table — verify with the county assessor before closing.
Climate risk First Street
- Flood 1/10 Low FEMA zone X (unshaded) · 0% chance over 30 yrs
- Wildfire 1/10 Low
- Heat 4/10 Moderate 7 d/yr ≥106°F today · 20 d/yr by 30 yrs out
- Wind 2/10 Low 100% chance of damaging wind over 30 yrs
- Air quality 3/10 Moderate 3 unhealthy d/yr today · 5 by 30 yrs out
Nearby sold comps map
Loading sold comps map…
Walkable amenities ~0.75 mi
Loading nearby amenities…
Taxation est. · year 1
- Rental income
- $18,692
- − Mortgage interest
- −$9,327
- − Property taxes
- −$2,386
- − Insurance
- −$832
- − Repairs & maintenance
- −$1,495
- − Management
- −$1,495
- − HOA
- −$48
- − Depreciation
- −$4,844
- Taxable loss
- −$1,736
- Est. tax savings @ 24.0%
- +$417
- After-tax cash flow
- $1,439/yr
For passive investors: Depreciation is non-cash, so a rental often shows a tax loss while cash-flowing — sheltering income. Rental losses are passive: they offset passive income freely, and up to $25,000/yr can offset ordinary (W-2) income if you actively participate and your MAGI is under $100k (phasing out to $0 by $150k); unused losses carry forward. On sale, claimed depreciation is recaptured at up to 25%, and gains may owe capital-gains tax (a 1031 exchange can defer both). Figures are a year-1 estimate at your 24.0% rate — not tax advice; consult a CPA.
Schools (NCES district)
- District
- Hazelwood
- NCES district ID
- 2913830
- Math proficiency
- 11% ▼ -13.00%
- Reading proficiency
- 26% ▼ -6.00%
- Median HH income
- $51,621
- Composite
- 16.77/100
- National rank
- #9156
- State rank
- #306 of 324 in MO
Livability — Ferguson
- Score
- 58/100
- State rank
- #586
- US rank
- #20809
Category grades
Schools grade is shown separately in the Schools card above.
Census & demographics
- Census place
- Ferguson, MO
- County
- Saint Louis County · 888,823 people
- City population
- 18,381
- Metro
- St. Louis, MO-IL
- Population (ZIP)
- 40,929
- Household income
- $41,154
- Rent vs Own
- Severe rent burden
- 3085.0
Population outlook (St. Louis County) Hauer SSP2
- Today (2025)
- 1,025,227 people
- By 2030
- 1,028,023 · +0.3%
- By 2040
- 1,020,940 · -0.4%
- By 2050
- 1,007,280 · -1.8%
- By 2075
- 987,277 · -3.7%
- By 2100
- 921,984 · -10.1%
Race, ethnicity, and origin ACS 2023
- Neighborhood character
- Predominantly Black (90%)
- Race & ethnicity
- Black 90% White 5% Two or more races 3%
- Foreign-born
- 1% · Canada
Political lean MEDSL · St. Louis
- 2024 margin
- Strong D (+23.4) · D 60.8% · R 37.4% · Other 1.7%
- 2008→2024 swing
- +3.5pp toward D · 2008: 19.9pp · 2024: 23.4pp
- All cycles
- 2024: D+23.4 2020: D+24.0 2016: D+16.2 2012: D+13.7 2008: D+19.9
Not yet ingested
- Civics
- —
Market trends
- HPI YoY
- ▲ 3.79%
- Current HPI
- 420.28
- Rent YoY
- ▲ 4.97%
- Metro
- St. Louis, MO-IL
- State GDP YoY
- ▲ 1.84%
- F500 in state
- 20
Industry mix (Fortune 500 HQ in MO)
| Industry | F500 HQs | Revenue |
|---|---|---|
| Healthcare | 1 | $163B |
|
||
| Insurance | 1 | $21B |
|
||
| Industrial Technology | 1 | $17B |
|
||
| Retail | 1 | $16B |
|
||
| Industrial Distribution | 1 | $10B |
|
||
| Utilities | 1 | $9B |
|
||
Price history
+7.5% since first listed12 events — show timeline
- 2026-03-30 Pending — MARIS as Distributed by MLS Grid
- 2026-03-10 Contingent — MARIS as Distributed by MLS Grid
- 2026-03-05 Relisted — MARIS as Distributed by MLS Grid
- 2026-01-29 Pending — MARIS as Distributed by MLS Grid
- 2026-01-12 Relisted — MARIS as Distributed by MLS Grid
- 2025-12-30 Listed $166,500 MARIS as Distributed by MLS Grid
- 2023-03-14 Sold (Public Records) $195,000 Public Records
- 2023-03-10 Sold (MLS) — MARIS as Distributed by MLS Grid
- 2023-01-26 Pending — MARIS as Distributed by MLS Grid
- 2023-01-12 Listed $195,000 MARIS as Distributed by MLS Grid
- 2002-11-07 Sold (Public Records) $154,900 Public Records
- 1979-10-01 Sold (Public Records) — Public Records
Property tax history
-1.1%/yrLatest (2022): $2,386 · +4.1% YoY. Source: county tax records.
Cash-flow waterfall
monthlySold comps — $/sqft
last 12 mo · ≤1 miLoading sold comps…