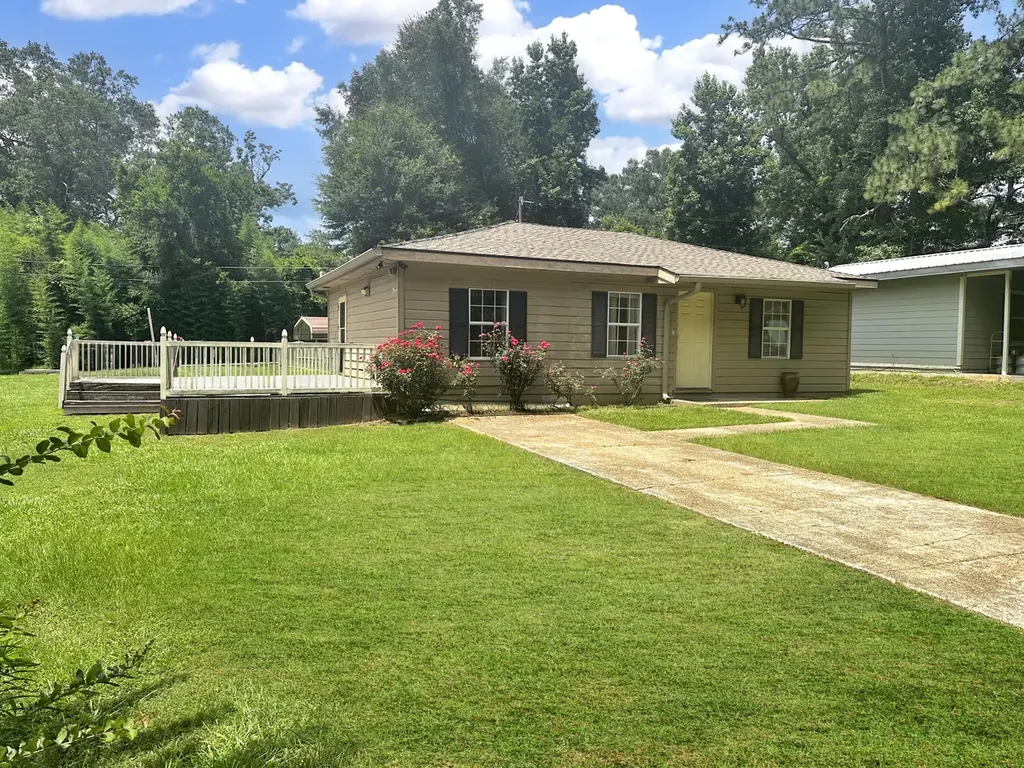
1010 Harvey St · DeRidder, LA
Flood risk 1/10 · Minimal
- FEMA flood zone
- X (unshaded)
- Chance of flooding over 30 yrs
- 0.0%
- Est. flood insurance / yr
- $507 – $1,088
Fire risk 3/10 · Minor
- Est. fire insurance / yr
- $1,269 – $2,357
Heat risk 8/10 · Major
- Hot days now (above 110°F)
- 7 days/yr
- Hot days in 30 yrs
- 20 days/yr
Wind risk 8/10 · Major
- Chance of severe wind over 30 yrs
- 99.0%
Air-quality risk 2/10 · Minimal
- Unhealthy air days now
- 1 days/yr
- Unhealthy air days in 30 yrs
- 1 days/yr
Risk factors via First Street. Map © Google.
Why this score? — see what drove the F grade
The composite is a weighted blend of 9 inputs, each scored 0–100. Each bar is that input's sub-score; the figure is the points it added to the 100-point composite (weight × sub-score).
- Cash flow +4.7/30.0
- ARV discount +4.2/15.0
- Livability +3.6/5.0
- Schools +3.0/10.0
- Rent growth +2.5/5.0
- Condition / age +2.5/5.0
- 1% rule +0.0/10.0
- DSCR +0.0/10.0
- Appreciation +0.0/10.0
$135,000
🖨 Deal sheet (PDF) 📄 Offer letter ✓ Due diligence
Listing remarks
This adorable 2 bedroom 1 bath house is situated on a dead end road right around the corner from the Deridder schools. Don't let its small size full you. The square footage is laid out very well, and feels so much larger then it is. Fresh paint through out, a fresh bathroom remodel, new flooring, and large deck make this home the prefect starter or downsized home. The additional living room could easily be converted to a third bedroom. Situated on two city lots, you have ample room to grow and build your family and dreams. Sit and enjoy your favorite drink as you sit on your large deck and watch the sunset. The large partially fenced yard gives you, the kids, and any pets plenty of room to
Key facts
- Large deck
- New flooring
- Two city lots
Tags
Property features AI
Exterior
- Utilities: Public sewer
- Home design: Single-family residence; One-story
- Construction: Wood siding exterior; Slab foundation
- Exterior features: Front porch; Composition roof
Interior
- Bathrooms: 1 full bathroom
- Heating & cooling: Central heating; Central air conditioning
- Interior features: Total of 7 rooms; Central heating; Central air conditioning
Neighborhood map
What this means for you Summary
Snapshot
- This is a 2-bed/1.0-bath single-family listed at $135k.
Deal economics
- At list price, monthly cash flow is $-339 ($-4k/yr) — negative.
- To cash-flow at today's rent, offer at most $75k (44.3% below list).
- To meet the 1% rule (rent ≥ 1% of price), the offer needs to be $60k (55.6% below list).
- Recommended offer: $60k (55.6% below list) — sets the bar for 1% rule.
- Cap rate 3.3% vs local median 4.8% in DeRidder — below-typical yield; the buyer is paying a premium for something (appreciation thesis, condition, location) that the cap rate doesn't capture.
Location & tenants
- Location reads 72/100 on livability (#43 in LA) — a middle-class / working-renter tenant base. Strengths: cost of living A+, housing A+, health & safety A+; Watch: amenities F, commute F, employment D-.
- Beauregard Parish (rural): math 30% / reading 41% proficiency, ranked #32 of 98 in LA (top 33%) — families likely to look elsewhere, expect single-tenant / working-renter base with shorter leases.
- Zoned schools: K.R. Hanchey Elementary School (485 students, 69% FRL); Deridder Junior High School (math 29% / reading 36%, grade F, #104 of 218 statewide, top 48%, 506 students, 64% FRL); Deridder High School (math 37% / reading 42%, grade F, #80 of 265 statewide, top 32%, 696 students, 56% FRL) — zoned schools average 63% FRL vs 46% district-wide (17 pts higher); higher-poverty schools than district average — tighter screening recommended.
- Market conditions: 243 active listings in the ZIP; 1 comparable units currently listed for rent nearby; 83 units permitted in Beauregard Parish in 2024 (0 in 5+ unit buildings).
Forward outlook
- Local home prices are declining (-3.0%/yr); year-one equity from $933 of loan paydown is wiped out by about $4k of value loss. Plan a longer hold.
Negotiation context
- It's been on market 18 days — a 2% lower offer ($133k) is reasonable based on typical stale-listing flexibility.
- Current owner paid $30k; list at $135k implies a 350% gain — meaningful room to come down on a strong offer.
Risks & watch-outs
- Climate carrying-cost: severe wind risk, 99% chance of damaging wind over 30y; extreme-heat days projected 7→20/yr by 2055 (HVAC capex compounding) — expect insurance premiums to compound above CPI over the hold.
Questions for the listing agent
- What do current leases actually rent for vs. the listed asking? Can we see a recent rent roll and the last 12 months of T-12 income?
- Is there a deadline driving the sale (1031 exchange, divorce, estate, relocation)? That informs how much negotiation room exists.
- Schools are B-rated — typically a magnet for longer-tenancy family renters. What's the average tenant stay here, and is there a school-zone premium baked into asking?
- The area grade is low — what's the realistic commute time and amenity access for the typical tenant pool here? Any planned neighborhood developments (good or bad) we should know about?
- What's the average days-on-market for RENTAL listings here right now (not sales)? A rising rental-DOM trend means longer vacancies and softer asking-rent achievability than the comps imply.
- What's the recent tenant-quality profile in this submarket — average credit score on applications, eviction rate, late-payment / NSF rate, and stable-employment percentage? A property-management company in the area should have these aggregated.
- How much new for-sale + rental construction is in the pipeline within 1–3 miles? Heavy new supply typically softens prices + rents 12–24 months out; constrained supply supports both.
Investment metrics
- 1% rule
- 0.44% ✗
- Cap rate
- 3.28%
- Cash-on-cash
- -10.75%
- DSCR
- 0.52
- GRM
- 18.8
CMA / ARV
- ARV (on-the-fly)
- $125,736
- Comps found
- 1
Show comp detail 1 sale within ~0.75 mi
| Address | Dist | Beds/Ba | Sqft | Sold | Price | $/sf | Match |
|---|---|---|---|---|---|---|---|
| 1008 N Texas St | 0.17mi | 2/1.0 | 754 (+1%) | 14mo | $127,500 | $169 | 78 |
Match score weights: distance 35% · size 25% · config 20% · recency 20%. Top-matched comps best support the ARV.
Projected returns pro-forma
-3.0% appreciation · 3.0% rent growth · sell at horizon
- IRR
- -35.9%
- Equity multiple
- -0.15×
- Total profit
- $-43,512
- Equity at exit
- $20,129
- IRR
- -49.7%
- Equity multiple
- -0.74×
- Total profit
- $-65,930
- Equity at exit
- $11,672
Cash invested: $37,800 (down + closing). Projections, not guarantees.
Landlord ↔ Tenant lean methodology
- Overall (STATE)
- 90 Strongly Landlord-Friendly
- State Louisiana
- 90 Strongly Landlord-Friendly · R+12
- County
- — inherits STATE
- City
- — inherits STATE
ZIP-level market 70634
- Home prices YoY
- -30.6%
- Active inventory
- 243
- Price-to-rent
- 18.8×
Monthly cashflow live
- Estimated rent
- $600 medium interval (Pro) →
- Mortgage (P&I)
- −$708
- Tax from tax record
- −$48 /mo · $582/yr
- Insurance
- −$56
- HOA
- −$0
- Vacancy / Maint / Mgmt
- −$126
- Net cashflow
- $-339
Break-even live
Sensitivity live
| Price | -10% $-262 | -5% $-300 | +0% $-339 | +5% $-377 | +10% $-415 |
|---|---|---|---|---|---|
| Rent | -10% $-386 | -5% $-362 | +0% $-339 | +5% $-315 | +10% $-291 |
| Rate | -1.0pp $-271 | -0.5pp $-304 | base $-339 | +0.5pp $-374 | +1.0pp $-409 |
UW: 25.0% down · 7.5% · 30yr · 1.5% tax · 5.0% vac · 8.0% maint · 8.0% mgmt
Financing live
Cash to close
- Down payment
- $33,750
- Closing costs
- $4,050
- Reserves months
- —
- Total cash needed
- —
Loan-product check · same deal, 3 products live
Conventional
25% down · 7.5% · 30yr
- Down + closing
- —
- Monthly P&I
- —
- Monthly cashflow
- —
- DSCR
- —
- Eligible?
- —
Personal DTI + credit; lowest rate.
DSCR
20% down · 8.5% · 30yr
- Down + closing
- —
- Monthly P&I
- —
- Monthly cashflow
- —
- DSCR
- —
- Eligible?
- —
No personal income docs; deal must DSCR.
Hard money
10% down · 12.0% · 12mo
- Down + closing
- —
- Monthly P&I
- —
- Monthly cashflow
- —
- DSCR
- —
- Eligible?
- —
Short-term bridge; refi at stabilization.
Rent comps 1 comps
| Address | Beds | Baths | Sqft | Rent | $/sqft | DOM | Units | Dist |
|---|---|---|---|---|---|---|---|---|
| 406-408 N Texas St DeRidder, LA | 1.0 | 1.0 | 650 | $600 | $0.92 | 45d | 1 | 0.78mi |
Listing history 13 events
-
2026-06-21days on market $135,000 Active 18 DOM
-
2026-06-19days on market $135,000 Active 16 DOM
-
2026-06-18days on market $135,000 Active 15 DOM
-
2026-06-17days on market $135,000 Active 14 DOM
-
2026-06-16days on market $135,000 Active 13 DOM
-
2026-06-15days on market $135,000 Active 12 DOM
-
2026-06-14days on market $135,000 Active 10 DOM
-
2026-06-13days on market $135,000 Active 9 DOM
-
2026-06-10days on market $135,000 Active 7 DOM
-
2026-06-09days on market $135,000 Active 6 DOM
-
2026-06-08days on market $135,000 Active 5 DOM
-
2026-06-07remarks 699-char remark
-
2026-06-07$135,000 Active 4 DOM
ⓘ Source: listings_history table (triggers on properties + properties_extension) + one-shot
backfill from property_details.listing_events for pre-trigger history.
Tax reassessment forecast LA · Resets to sale price
- Current annual tax
- $582 · $48/mo
- Projected year-2 tax
- $742 · $62/mo
- Expected delta
- +$161/yr (+$13/mo · 27.6%)
ⓘ Screening estimate from a state-policy table — verify with the county assessor before closing.
Climate risk First Street
- Flood 1/10 Low FEMA zone X (unshaded) · 0% chance over 30 yrs
- Wildfire 3/10 Moderate
- Heat 8/10 Severe 7 d/yr ≥110°F today · 20 d/yr by 30 yrs out
- Wind 8/10 Severe 99% chance of damaging wind over 30 yrs
- Air quality 2/10 Low 1 unhealthy d/yr today · 1 by 30 yrs out
Nearby sold comps map
Loading sold comps map…
Walkable amenities ~0.75 mi
Loading nearby amenities…
Taxation est. · year 1
- Rental income
- $7,200
- − Mortgage interest
- −$7,562
- − Property taxes
- −$582
- − Insurance
- −$675
- − Repairs & maintenance
- −$576
- − Management
- −$576
- − Depreciation
- −$3,927
- Taxable loss
- −$6,698
- Est. tax savings @ 24.0%
- +$1,608
- After-tax cash flow
- $-2,457/yr
For passive investors: Depreciation is non-cash, so a rental often shows a tax loss while cash-flowing — sheltering income. Rental losses are passive: they offset passive income freely, and up to $25,000/yr can offset ordinary (W-2) income if you actively participate and your MAGI is under $100k (phasing out to $0 by $150k); unused losses carry forward. On sale, claimed depreciation is recaptured at up to 25%, and gains may owe capital-gains tax (a 1031 exchange can defer both). Figures are a year-1 estimate at your 24.0% rate — not tax advice; consult a CPA.
Schools (NCES district)
- District
- Beauregard Parish
- NCES district ID
- 2200180
- Math proficiency
- 30% ▼ -40.00%
- Reading proficiency
- 41% ▼ -35.00%
- Median HH income
- $46,033
- Composite
- 30.34/100
- National rank
- #6265
- State rank
- #32 of 98 in LA
Livability — DeRidder
- Score
- 72/100
- State rank
- #43
- US rank
- #6227
Category grades
Schools grade is shown separately in the Schools card above.
Census & demographics
- Census place
- DeRidder, LA
- Population (ZIP)
- 25,038
Population outlook (Beauregard County) Hauer SSP2
- Today (2025)
- 37,760 people
- By 2030
- 38,140 · +1.0%
- By 2040
- 38,518 · +2.0%
- By 2050
- 38,164 · +1.1%
- By 2075
- 36,437 · -3.5%
- By 2100
- 32,493 · -13.9%
Race, ethnicity, and origin ACS 2023
- Neighborhood character
- Predominantly White (72%)
- Race & ethnicity
- White 72% Black 14% Two or more races 9% Hispanic / Latino 5% Asian 1%
- Hispanic origin (detail)
- Mexican 3% Puerto Rican 1%
- Common ancestry
- Lithuanian 6% Slovak 1% Italian 1%
- Foreign-born
- 2% · Canada
- Languages at home
- 96% English-only · Spanish 2% French/Haitian/Cajun 1%
Political lean MEDSL · Beauregard
- 2024 margin
- Solid R (+71.3) · D 13.8% · R 85.1% · Other 1.1%
- 2008→2024 swing
- -16.9pp toward R · 2008: -54.3pp · 2024: -71.3pp
- All cycles
- 2024: R+71.3 2020: R+67.5 2016: R+65.3 2012: R+58.2 2008: R+54.3
Not yet ingested
- Civics
- —
Market trends
- HPI YoY
- ▼ -57.61%
- Current HPI
- 130.4445
- Rent YoY
- —
- Metro
- —
- State GDP YoY
- ▲ 3.29%
- F500 in state
- 10
Industry mix (Fortune 500 HQ in LA)
| Industry | F500 HQs | Revenue |
|---|---|---|
| Telecommunications | 2 | $23B |
|
||
| Utilities | 1 | $12B |
|
||
| Wholesale / Distribution | 1 | $5B |
|
||
| Advertising | 1 | $2B |
|
||
Price history
+350.0% since first listed2 events — show timeline
- 2026-06-03 Listed $135,000 GFPAR
- 2012-08-17 Sold (Public Records) $30,000 Public Records
Property tax history
+6.2%/yrLatest (2025): $582 · +0.7% YoY. Source: county tax records.
Cash-flow waterfall
monthlySold comps — $/sqft
last 12 mo · ≤1 miLoading sold comps…