 Multi-family
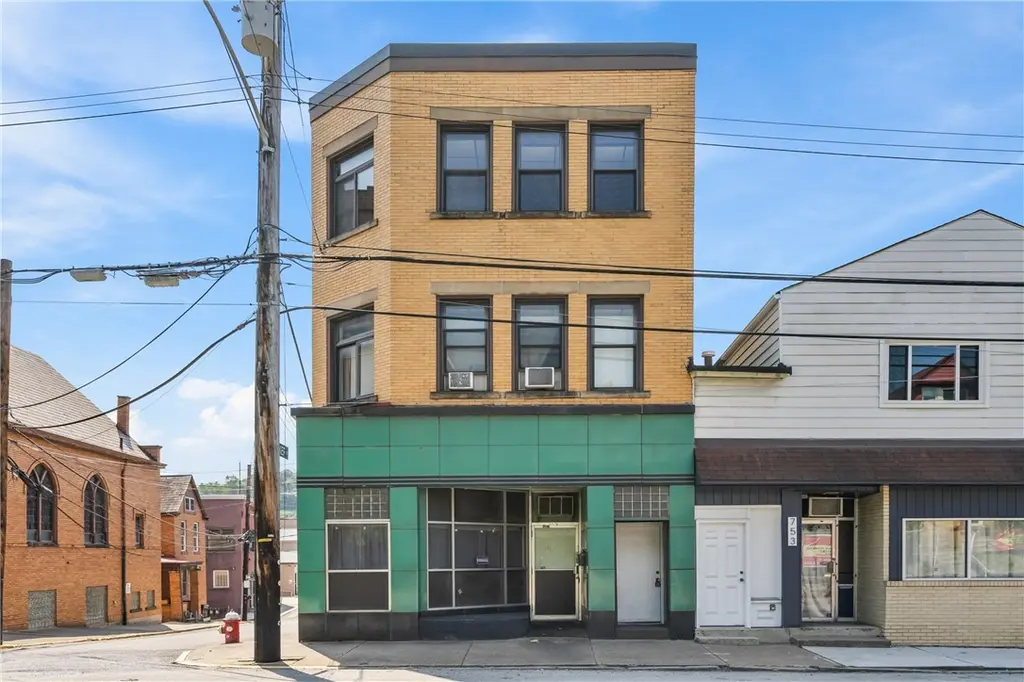
751 Chartiers Ave · McKees Rocks, PA
Flood risk 10/10 · Severe
- FEMA flood zone
- X (unshaded)
- Chance of flooding over 30 yrs
- 0.99%
- Est. flood insurance / yr
- $473 – $860
Fire risk 1/10 · Minimal
- Est. fire insurance / yr
- $511 – $949
Heat risk 4/10 · Minor
- Hot days now (above 98°F)
- 7 days/yr
- Hot days in 30 yrs
- 18 days/yr
Wind risk 2/10 · Minimal
- Chance of severe wind over 30 yrs
- —
Air-quality risk 3/10 · Minor
- Unhealthy air days now
- 3 days/yr
- Unhealthy air days in 30 yrs
- 3 days/yr
Risk factors via First Street. Map © Google.
Why this score? — see what drove the B- grade
The composite is a weighted blend of 9 inputs, each scored 0–100. Each bar is that input's sub-score; the figure is the points it added to the 100-point composite (weight × sub-score).
- Cash flow +30.0/30.0
- 1% rule +10.0/10.0
- DSCR +10.0/10.0
- ARV discount +7.5/15.0
- Rent growth +5.0/5.0
- Livability +4.1/5.0
- Condition / age +2.5/5.0
- Schools +0.9/10.0
- Appreciation +0.0/10.0
$189,900
🖨 Deal sheet 📄 Offer letter ✓ Due diligence
Multi-family units
County records classify this as Multi-Family (2-4 Unit). Listing-text estimate: 1 unit. estimate disagrees with records
Listing remarks MLS
Great investment opportunity. All utilities are separated. Off-street and street parking available. Located one block from the post office and bus stop, with easy access to downtown, shopping, and entertainment.
Key facts
- Off-street parking
- 3,249 sq ft lot
- 3 parking spots
Tags
Neighborhood map
What this means for you Summary
Snapshot
- This is a 6-bed/3.5-bath multifamily listed at $190k.
Deal economics
- At list price, monthly cash flow is $867 ($10k/yr) — positive.
- The deal already cash-flows at list — no discount required.
- Meets the 1% rule at list price ($3k rent vs $190k).
- Recommended offer: $167k (12.0% below list) — sets the bar for market timing.
Location & tenants
- Location reads 82/100 on livability (#143 in PA, #1,154 nationally) — a professional / high-income tenant draw. Strengths: amenities A+, commute A+, cost of living A+; Watch: schools F, employment F.
- Sto-Rox SD (suburban): math 4% / reading 18% proficiency, ranked #532 of 539 in PA (top 99%) — low school quality limits family demand, transient renter base, plan for 1-2y turnover; 77% free/reduced lunch — lower-income household profile, screen leases tightly.
- Market conditions: Rents rising fast (+13.1%/yr); 125 active listings in the ZIP; 2,996 units permitted in Allegheny County in 2024 (1,588 in 5+ unit buildings).
- At $2,848/mo this rent would consume 49% of the median local household income ($69k/yr) (locally 768% of renters already pay >50% of income on rent) — very limited rent-growth headroom before tenants either downsize or default.
Forward outlook
- Local home prices are declining (-3.0%/yr); year-one equity from $1k of loan paydown is wiped out by about $6k of value loss. Plan a longer hold.
- At projected returns (-3.0% appreciation + 8.0% rent growth), your $53k cash investment doubles in ~5 years — after that, you're playing with house money.
Negotiation context
- It's been on market 188 days — a 12% lower offer ($167k) is reasonable based on typical stale-listing flexibility.
- 3 sale attempts with the ask held roughly flat each time — persistent listings suggest the price (not the market) is what's stuck; bring a comps-based counter.
- Current owner paid $42k; list at $190k implies a 352% gain — meaningful room to come down on a strong offer.
Risks & watch-outs
- Watch-outs: flood insurance adds $56/mo; built in 1920 — expect roof / HVAC / electrical / plumbing capex.
- Climate carrying-cost: severe flood risk — expect insurance premiums to compound above CPI over the hold.
Questions for the listing agent
- It's been on market 188 days. Have you received any prior offers? Is the seller open to a 12% concession, seller financing, or rate buy-down credit?
- Built in 1920 — when were the roof, HVAC, electrical panel, plumbing, and water heater last replaced?
- What's the actual annual flood-insurance premium (NFIP or private), and is the property in a SFHA with mandatory coverage?
- Why hasn't it sold? Are there any deal-killer items the seller is aware of (foundation, flood, title, zoning, code violations)?
- Is there a deadline driving the sale (1031 exchange, divorce, estate, relocation)? That informs how much negotiation room exists.
- Schools are F-rated, which usually means shorter tenancies and higher turnover. Who's the typical renter profile here, and what's been the actual vacancy rate?
- What's the average days-on-market for RENTAL listings here right now (not sales)? A rising rental-DOM trend means longer vacancies and softer asking-rent achievability than the comps imply.
- What's the recent tenant-quality profile in this submarket — average credit score on applications, eviction rate, late-payment / NSF rate, and stable-employment percentage? A property-management company in the area should have these aggregated.
- How much new apartment / multifamily construction is in the pipeline within 1–3 miles? Heavy new supply (>2% of stock underway) typically softens rents 12–24 months out; light construction supports rent growth.
Investment metrics
- 1% rule
- 1.50% ✓
- Cap rate
- 12.13%
- Cash-on-cash
- 20.83%
- DSCR
- 1.93
- GRM
- 5.6
CMA / ARV
- ARV (median comp)
- $47,694
- List price
- $189,900
- Delta
- 298.17%
- Verdict
- OVERPRICED
- Comps
- 3 within 1.0 mi
Projected returns pro-forma
-3.0% appreciation · 8.0% rent growth · sell at horizon
- IRR
- 17.3%
- Equity multiple
- 1.74×
- Total profit
- $39,613
- Equity at exit
- $28,315
- IRR
- 29.3%
- Equity multiple
- 4.28×
- Total profit
- $174,488
- Equity at exit
- $16,419
Cash invested: $53,172 (down + closing). Projections, not guarantees.
Landlord ↔ Tenant lean methodology
- Overall (STATE)
- 62 Landlord-Friendly
- State Pennsylvania
- 62 Landlord-Friendly · EVEN
- County
- — inherits STATE
- City
- — inherits STATE
ZIP-level market 15136
- Home prices YoY
- -30.4%
- Rents YoY
- 13.1%
- Active inventory
- 125
- Price-to-rent
- 16.7×
Monthly cashflow live
- Estimated rent
- $2,848 medium interval (Pro) →
- Mortgage (P&I)
- −$996
- Tax from tax record
- −$252 /mo · $3,023/yr
- Insurance
- −$79
- Flood insurance flood zone
- −$56 /mo · $666/yr
- HOA
- −$0
- Vacancy / Maint / Mgmt
- −$598
- Net cashflow
- $867
Break-even live
3-unit breakdown (identical units grouped — click to expand)
| Units | Beds | Baths | Est. rent |
|---|---|---|---|
| 3× units | 1 | 1 | $2,850 |
| #1 | 1 | 1 | $950 |
| #2 | 1 | 1 | $950 |
| #3 | 1 | 1 | $950 |
| Total (3 units) | $2,848 | ||
UW: 25.0% down · 7.5% · 30yr · 1.5% tax · 5.0% vac · 8.0% maint · 8.0% mgmt
Financing live
Cash to close
- Down payment
- $47,475
- Closing costs
- $5,697
- Reserves months
- —
- Total cash needed
- —
Loan-product check · same deal, 3 products live
Conventional
25% down · 7.5% · 30yr
- Down + closing
- —
- Monthly P&I
- —
- Monthly cashflow
- —
- DSCR
- —
- Eligible?
- —
Personal DTI + credit; lowest rate.
DSCR
20% down · 8.5% · 30yr
- Down + closing
- —
- Monthly P&I
- —
- Monthly cashflow
- —
- DSCR
- —
- Eligible?
- —
No personal income docs; deal must DSCR.
Hard money
10% down · 12.0% · 12mo
- Down + closing
- —
- Monthly P&I
- —
- Monthly cashflow
- —
- DSCR
- —
- Eligible?
- —
Short-term bridge; refi at stabilization.
Listing history 18 events
-
2026-06-18days on market $189,900 Active 188 DOM
-
2026-06-17days on market $189,900 Active 187 DOM
-
2026-06-16days on market $189,900 Active 186 DOM
-
2026-06-15days on market $189,900 Active 185 DOM
-
2026-06-13days on market $189,900 Active 183 DOM
-
2026-06-09days on market $189,900 Active 179 DOM
-
2026-06-08days on market $189,900 Active 178 DOM
-
2026-06-07days on market $189,900 Active 177 DOM
-
2026-06-05days on market $189,900 Active 174 DOM
-
2026-06-03days on market $189,900 Active 173 DOM
-
2026-06-02days on market $189,900 Active 172 DOM
-
2026-06-01days on market $189,900 Active 171 DOM
-
2026-05-31days on market $189,900 Active 170 DOM
-
2026-04-20status Active 211-char remark
Show marketing remark (211 chars)
Great investment opportunity. All utilities are separated. Off-street and street parking available. Located one block from the post office and bus stop, with easy access to downtown, shopping, and entertainment.
-
2026-02-24historical Contingent 211-char remark
Show marketing remark (211 chars)
Great investment opportunity. All utilities are separated. Off-street and street parking available. Located one block from the post office and bus stop, with easy access to downtown, shopping, and entertainment.
-
2025-12-12$189,900 Active 211-char remark
Show marketing remark (211 chars)
Great investment opportunity. All utilities are separated. Off-street and street parking available. Located one block from the post office and bus stop, with easy access to downtown, shopping, and entertainment.
-
2025-04-03$189,900 Active
-
1976-06-07soldstatus $42,000
ⓘ Source: listings_history table (triggers on properties + properties_extension) + one-shot
backfill from property_details.listing_events for pre-trigger history.
Tax reassessment forecast PA · Partial reset (capped growth)
- Current annual tax
- $3,023 · $252/mo
- Projected year-2 tax
- $3,023 · $252/mo
- Expected delta
- $0/yr ($0/mo · 0.0%)
ⓘ Screening estimate from a state-policy table — verify with the county assessor before closing.
Climate risk First Street
- Flood 10/10 Extreme FEMA zone X (unshaded) · 99% chance over 30 yrs
- Wildfire 1/10 Low
- Heat 4/10 Moderate 7 d/yr ≥98°F today · 18 d/yr by 30 yrs out
- Wind 2/10 Low
- Air quality 3/10 Moderate 3 unhealthy d/yr today · 3 by 30 yrs out
Nearby sold comps map
Loading sold comps map…
Walkable amenities ~0.75 mi
Loading nearby amenities…
Taxation est. · year 1
- Rental income
- $34,176
- − Mortgage interest
- −$10,637
- − Property taxes
- −$3,023
- − Insurance
- −$1,616
- − Repairs & maintenance
- −$2,734
- − Management
- −$2,734
- − Depreciation
- −$5,524
- Taxable income
- $7,907
- Est. tax owed @ 24.0%
- −$1,898
- After-tax cash flow
- $8,512/yr
For passive investors: Depreciation is non-cash, so a rental often shows a tax loss while cash-flowing — sheltering income. Rental losses are passive: they offset passive income freely, and up to $25,000/yr can offset ordinary (W-2) income if you actively participate and your MAGI is under $100k (phasing out to $0 by $150k); unused losses carry forward. On sale, claimed depreciation is recaptured at up to 25%, and gains may owe capital-gains tax (a 1031 exchange can defer both). Figures are a year-1 estimate at your 24.0% rate — not tax advice; consult a CPA.
Schools (NCES district)
- District
- Sto-Rox SD
- NCES district ID
- 4222830
- Math proficiency
- 4% ▼ -5.00%
- Reading proficiency
- 18% ▼ -4.00%
- Median HH income
- $30,268
- Composite
- 8.51/100
- National rank
- #9904
- State rank
- #532 of 539 in PA
Livability — McKees Rocks
- Score
- 82/100
- State rank
- #143
- US rank
- #1154
Category grades
Schools grade is shown separately in the Schools card above.
Census & demographics
- Census place
- McKees Rocks, PA
- County
- Allegheny County · 1,022,028 people
- City population
- 22,623
- Metro
- Pittsburgh, PA
- Population (ZIP)
- 22,623
- Household income
- $69,099
- Rent vs Own
- Severe rent burden
- 768.0
Population outlook (Allegheny County) Hauer SSP2
- Today (2025)
- 1,250,282 people
- By 2030
- 1,256,482 · +0.5%
- By 2040
- 1,256,318 · +0.5%
- By 2050
- 1,244,169 · -0.5%
- By 2075
- 1,197,693 · -4.2%
- By 2100
- 1,093,187 · -12.6%
Race, ethnicity, and origin ACS 2023
- Neighborhood character
- Predominantly White (75%)
- Race & ethnicity
- White 75% Black 18% Two or more races 4% Hispanic / Latino 2%
- Common ancestry
- Romanian 10% Subsaharan African 3% Scotch-Irish 2%
- Foreign-born
- 3% · Canada
- Languages at home
- 96% English-only · Spanish 1% Other Indo-European 1%
Political lean MEDSL · Allegheny
- 2024 margin
- Strong D (+20.3) · D 59.7% · R 39.4%
- 2008→2024 swing
- +4.8pp toward D · 2008: 15.5pp · 2024: 20.3pp
- All cycles
- 2024: D+20.3 2020: D+20.4 2016: D+16.4 2012: D+14.4 2008: D+15.5
Not yet ingested
- Civics
- —
Market trends
- HPI YoY
- ▼ -107.07%
- Current HPI
- 244.6934
- Rent YoY
- ▲ 13.12%
- Metro
- Pittsburgh, PA
- State GDP YoY
- ▲ 1.68%
- F500 in state
- 34
Industry mix (Fortune 500 HQ in PA)
| Industry | F500 HQs | Revenue |
|---|---|---|
| Healthcare | 2 | $309B |
|
||
| Insurance | 2 | $27B |
|
||
| Telecommunications / Media | 1 | $124B |
|
||
| Industrial Distribution | 1 | $22B |
|
||
| Financial Services | 1 | $20B |
|
||
| Chemicals / Materials | 1 | $18B |
|
||
Price history
+352.1% since first listed5 events — show timeline
- 2026-04-20 Relisted — West Penn MLS
- 2026-02-24 Contingent — West Penn MLS
- 2025-12-12 Listed $189,900 West Penn MLS
- 2025-04-03 Listed $189,900 West Penn MLS
- 1976-06-07 Sold (Public Records) $42,000 Public Records
Property tax history
+1.5%/yrLatest (2026): $3,023 · +4.1% YoY. Source: county tax records.
Cash-flow waterfall
monthlySold comps — $/sqft
last 12 mo · ≤1 miLoading sold comps…