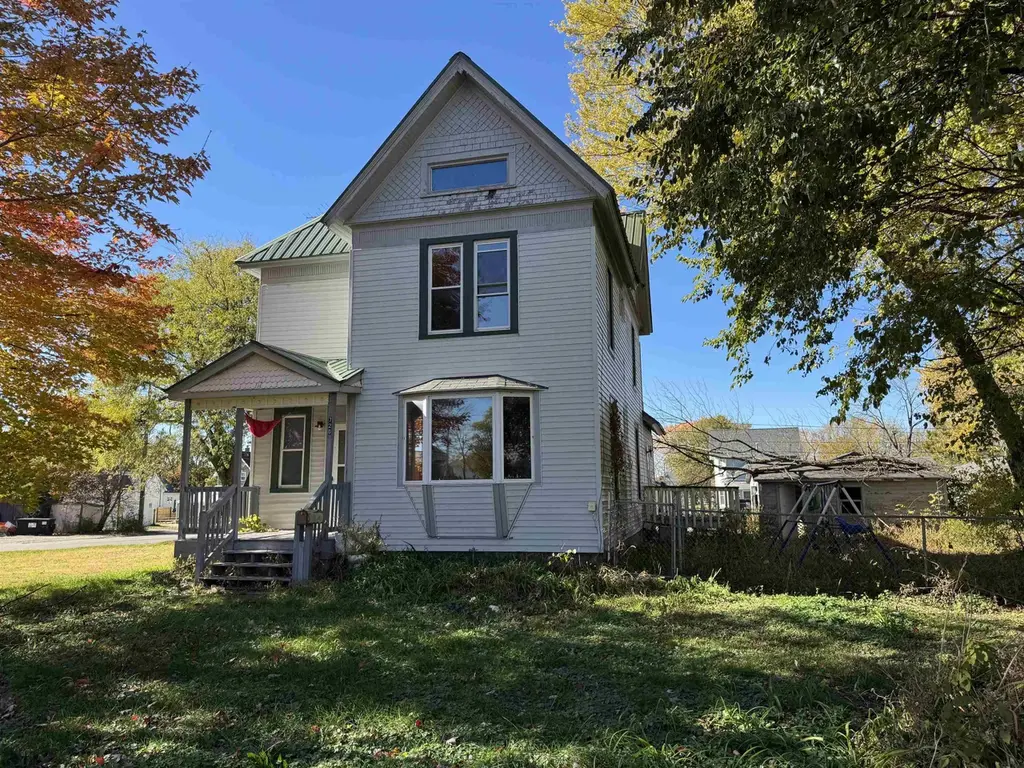
720 S Frederick · Oelwein, IA
Flood risk 1/10 · Minimal
- FEMA flood zone
- X (unshaded)
- Chance of flooding over 30 yrs
- 0.0%
- Est. flood insurance / yr
- $473 – $860
Fire risk 4/10 · Minor
- Est. fire insurance / yr
- $902 – $1,676
Heat risk 2/10 · Minimal
- Hot days now (above 100°F)
- 7 days/yr
- Hot days in 30 yrs
- 15 days/yr
Wind risk 2/10 · Minimal
- Chance of severe wind over 30 yrs
- —
Air-quality risk 1/10 · Minimal
- Unhealthy air days now
- 0 days/yr
- Unhealthy air days in 30 yrs
- 0 days/yr
Risk factors via First Street. Map © Google.
Why this score? — see what drove the B- grade
The composite is a weighted blend of 9 inputs, each scored 0–100. Each bar is that input's sub-score; the figure is the points it added to the 100-point composite (weight × sub-score).
- Cash flow +25.6/30.0
- ARV discount +15.0/15.0
- DSCR +8.5/10.0
- 1% rule +7.5/10.0
- Schools +4.3/10.0
- Livability +3.8/5.0
- Rent growth +2.5/5.0
- Condition / age +2.5/5.0
- Appreciation +0.0/10.0
$80,000
🖨 Deal sheet (PDF) 📄 Offer letter ✓ Due diligence
Listing remarks MLS
This 2 story charmer on a large corner lot is priced to sell and ready for you to make it your own. Character abounds this 3 bedroom, 1 1/2 bath home with plenty of room to roam. Selling AS IS. Square footages approximate. Call your favorite local agent for your personal showing today!
Key facts
- 9,000 sq ft lot
- Parking
- Built 1891
Neighborhood map
What this means for you Summary
Snapshot
- This is a 3-bed/2.0-bath single-family listed at $80k.
Deal economics
- At list price, monthly cash flow is $189 ($2k/yr) — positive.
- The deal already cash-flows at list — no discount required.
- Meets the 1% rule at list price ($1k rent vs $80k).
- Cap rate 9.1% vs local median 4.5% in Oelwein — top-decile yield for the area; either an underpriced asset or a hidden risk that comps aren't pricing in. Stress-test before assuming the spread holds.
Location & tenants
- Location reads 76/100 on livability (#186 in IA, #3,329 nationally) — a middle-class / working-renter tenant base. Strengths: cost of living A+, housing A+, health & safety A+; Watch: employment D, amenities F, commute F.
- Oelwein Community School District (town): math 47% / reading 55% proficiency, ranked #281 of 289 in IA (top 97%) — acceptable for families but not a draw, mixed tenant base, ~2y average lease.
- Zoned schools: Wings Park Elementary School (math 52% / reading 47%, grade D, #514 of 616 statewide, top 85%, 345 students, 64% FRL); Oelwein Middle School (math 44% / reading 54%, grade C-, #219 of 246 statewide, top 90%, 359 students, 60% FRL); Oelwein High School (math 46% / reading 62%, grade C-, #293 of 336 statewide, top 87%, 314 students, 46% FRL).
- Market conditions: 60 active listings in the ZIP; 1 comparable units currently listed for rent nearby; 8 units permitted in Fayette County in 2024 (0 in 5+ unit buildings).
Forward outlook
- Local home prices are declining (-3.0%/yr); year-one equity from $553 of loan paydown is wiped out by about $2k of value loss. Plan a longer hold.
- Fayette County population projected at -15% by 2050 — secular population decline; favor cash flow + early exit over multi-decade hold.
Negotiation context
- Only 0 days on market — expect competitive offers; lowballing is unlikely to land.
- 4 sale attempts since 8y ago with the ask held roughly flat each time — persistent listings suggest the price (not the market) is what's stuck; bring a comps-based counter.
- Current owner paid $35k; list at $80k implies a 129% gain — meaningful room to come down on a strong offer.
Risks & watch-outs
- Watch-outs: built in 1891 — expect roof / HVAC / electrical / plumbing capex.
Questions for the listing agent
- Built in 1891 — when were the roof, HVAC, electrical panel, plumbing, and water heater last replaced?
- Is there a deadline driving the sale (1031 exchange, divorce, estate, relocation)? That informs how much negotiation room exists.
- What's the average days-on-market for RENTAL listings here right now (not sales)? A rising rental-DOM trend means longer vacancies and softer asking-rent achievability than the comps imply.
- What's the recent tenant-quality profile in this submarket — average credit score on applications, eviction rate, late-payment / NSF rate, and stable-employment percentage? A property-management company in the area should have these aggregated.
- How much new for-sale + rental construction is in the pipeline within 1–3 miles? Heavy new supply typically softens prices + rents 12–24 months out; constrained supply supports both.
Investment metrics
- 1% rule
- 1.25% ✓
- Cap rate
- 9.13%
- Cash-on-cash
- 10.13%
- DSCR
- 1.45
- GRM
- 6.7
CMA / ARV
- ARV (on-the-fly)
- $133,764
- Comps found
- 10
Show comp detail 10 sales within ~0.75 mi
| Address | Dist | Beds/Ba | Sqft | Sold | Price | $/sf | Match |
|---|---|---|---|---|---|---|---|
| 720 S Frederick | 0.00mi | 3/1.5 | 1,884 (0%) | 1mo | $80,000 | $42 | 97 |
| 720 S Frederick | 0.00mi | 3/1.5 | 1,884 (0%) | 4mo | $35,000 | $19 | 95 |
| 108 SE 8th St | 0.13mi | 3/2.0 | 2,059 (+9%) | 8mo | $163,500 | $79 | 72 |
| 605 S Frederick Ave | 0.14mi | 4/2.0 (+1) | 2,014 (+7%) | 10mo | $144,000 | $71 | 69 |
| 618 4th Ave Ave SW | 0.29mi | 4/2.0 (+1) | 1,922 (+2%) | 18mo | $129,000 | $67 | 63 |
| 513 5th Ave. Ave SE | 0.42mi | 3/3.0 | 1,824 (-3%) | 10mo | $172,500 | $95 | 63 |
| 708 1st Ave Ave SW | 0.07mi | 2/2.0 (-1) | 1,706 (-9%) | 22mo | $120,000 | $70 | 58 |
| 805 7th Street St SE | 0.60mi | 3/2.0 | 1,990 (+6%) | 10mo | $195,000 | $98 | 54 |
| 201 3rd Ave Ave SE | 0.54mi | 4/2.0 (+1) | 2,138 (+14%) | 0mo | $170,000 | $80 | 47 |
| 404 4th Ave Ave SE | 0.41mi | 3/2.0 | 2,154 (+14%) | 22mo | $145,000 | $67 | 39 |
Match score weights: distance 35% · size 25% · config 20% · recency 20%. Top-matched comps best support the ARV.
Projected returns pro-forma
-3.0% appreciation · 3.0% rent growth · sell at horizon
- IRR
- -1.0%
- Equity multiple
- 0.96×
- Total profit
- $-873
- Equity at exit
- $11,928
- IRR
- 8.7%
- Equity multiple
- 1.67×
- Total profit
- $14,933
- Equity at exit
- $6,917
Cash invested: $22,400 (down + closing). Projections, not guarantees.
Landlord ↔ Tenant lean methodology
- Overall (STATE)
- 83 Strongly Landlord-Friendly
- State Iowa
- 83 Strongly Landlord-Friendly · R+6
- County
- — inherits STATE
- City
- — inherits STATE
ZIP-level market 50662
- Home prices YoY
- -21.7%
- Active inventory
- 60
- Price-to-rent
- 6.7×
Monthly cashflow live
- Estimated rent
- $1,000 medium interval (Pro) →
- Mortgage (P&I)
- −$420
- Tax from tax record
- −$148 /mo · $1,776/yr
- Insurance
- −$33
- HOA
- −$0
- Vacancy / Maint / Mgmt
- −$210
- Net cashflow
- $189
Break-even live
Sensitivity live
| Price | -10% $234 | -5% $212 | +0% $189 | +5% $166 | +10% $144 |
|---|---|---|---|---|---|
| Rent | -10% $110 | -5% $150 | +0% $189 | +5% $229 | +10% $268 |
| Rate | -1.0pp $229 | -0.5pp $209 | base $189 | +0.5pp $168 | +1.0pp $147 |
UW: 25.0% down · 7.5% · 30yr · 1.5% tax · 5.0% vac · 8.0% maint · 8.0% mgmt
Financing live
Cash to close
- Down payment
- $20,000
- Closing costs
- $2,400
- Reserves months
- —
- Total cash needed
- —
Loan-product check · same deal, 3 products live
Conventional
25% down · 7.5% · 30yr
- Down + closing
- —
- Monthly P&I
- —
- Monthly cashflow
- —
- DSCR
- —
- Eligible?
- —
Personal DTI + credit; lowest rate.
DSCR
20% down · 8.5% · 30yr
- Down + closing
- —
- Monthly P&I
- —
- Monthly cashflow
- —
- DSCR
- —
- Eligible?
- —
No personal income docs; deal must DSCR.
Hard money
10% down · 12.0% · 12mo
- Down + closing
- —
- Monthly P&I
- —
- Monthly cashflow
- —
- DSCR
- —
- Eligible?
- —
Short-term bridge; refi at stabilization.
Rent comps 1 comps
| Address | Beds | Baths | Sqft | Rent | $/sqft | DOM | Units | Dist |
|---|---|---|---|---|---|---|---|---|
| 1297 S Frederick Ave Unit 3 Oelwein, IA | 3.0 | 1.0 | 1500 | $1,000 | $0.67 | 22d | 1 | 0.56mi |
Listing history 15 events
-
2026-05-15historical
-
2026-05-15$80,000
-
2026-02-23soldstatus $35,000
-
2026-02-18soldstatus $35,000 Closed 286-char remark
Show marketing remark (286 chars)
This 2 story charmer on a large corner lot is priced to sell and ready for you to make it your own. Character abounds this 3 bedroom, 1 1/2 bath home with plenty of room to roam. Selling AS IS. Square footages approximate. Call your favorite local agent for your personal showing today!
-
2026-01-26status Pending 286-char remark
Show marketing remark (286 chars)
This 2 story charmer on a large corner lot is priced to sell and ready for you to make it your own. Character abounds this 3 bedroom, 1 1/2 bath home with plenty of room to roam. Selling AS IS. Square footages approximate. Call your favorite local agent for your personal showing today!
-
2025-12-08price $49,900 286-char remark
Show marketing remark (286 chars)
This 2 story charmer on a large corner lot is priced to sell and ready for you to make it your own. Character abounds this 3 bedroom, 1 1/2 bath home with plenty of room to roam. Selling AS IS. Square footages approximate. Call your favorite local agent for your personal showing today!
-
2025-11-24price $59,900 286-char remark
Show marketing remark (286 chars)
This 2 story charmer on a large corner lot is priced to sell and ready for you to make it your own. Character abounds this 3 bedroom, 1 1/2 bath home with plenty of room to roam. Selling AS IS. Square footages approximate. Call your favorite local agent for your personal showing today!
-
2025-11-03$69,000 Active 286-char remark
Show marketing remark (286 chars)
This 2 story charmer on a large corner lot is priced to sell and ready for you to make it your own. Character abounds this 3 bedroom, 1 1/2 bath home with plenty of room to roam. Selling AS IS. Square footages approximate. Call your favorite local agent for your personal showing today!
-
2022-11-01soldstatus $35,000 Closed 232-char remark
Show marketing remark (232 chars)
Selling As-Is. Handyman Special. Large 3 bedroom, 1.5 bath, large living room and kitchen. Full basement, 1 detached garage, small lean-to and partial private fenced in yard. Corner lot off S Frederick. Great investment opportunity.
-
2022-09-19status Pending 232-char remark
Show marketing remark (232 chars)
Selling As-Is. Handyman Special. Large 3 bedroom, 1.5 bath, large living room and kitchen. Full basement, 1 detached garage, small lean-to and partial private fenced in yard. Corner lot off S Frederick. Great investment opportunity.
-
2022-09-17$35,000 Active 232-char remark
Show marketing remark (232 chars)
Selling As-Is. Handyman Special. Large 3 bedroom, 1.5 bath, large living room and kitchen. Full basement, 1 detached garage, small lean-to and partial private fenced in yard. Corner lot off S Frederick. Great investment opportunity.
-
2020-04-13soldstatus $50,000
-
2020-04-09soldstatus $50,000
-
2018-07-06$55,000
-
2009-09-04soldstatus $59,000
ⓘ Source: listings_history table (triggers on properties + properties_extension) + one-shot
backfill from property_details.listing_events for pre-trigger history.
Tax reassessment forecast IA · Partial reset (capped growth)
- Current annual tax
- $1,776 · $148/mo
- Projected year-2 tax
- $1,776 · $148/mo
- Expected delta
- $0/yr ($0/mo · 0.0%)
ⓘ Screening estimate from a state-policy table — verify with the county assessor before closing.
Climate risk First Street
- Flood 1/10 Low FEMA zone X (unshaded) · 0% chance over 30 yrs
- Wildfire 4/10 Moderate
- Heat 2/10 Low 7 d/yr ≥100°F today · 15 d/yr by 30 yrs out
- Wind 2/10 Low
- Air quality 1/10 Low 0 unhealthy d/yr today · 0 by 30 yrs out
Nearby sold comps map
Loading sold comps map…
Walkable amenities ~0.75 mi
Loading nearby amenities…
Taxation est. · year 1
- Rental income
- $12,000
- − Mortgage interest
- −$4,481
- − Property taxes
- −$1,776
- − Insurance
- −$400
- − Repairs & maintenance
- −$960
- − Management
- −$960
- − Depreciation
- −$2,327
- Taxable income
- $1,095
- Est. tax owed @ 24.0%
- −$263
- After-tax cash flow
- $2,007/yr
For passive investors: Depreciation is non-cash, so a rental often shows a tax loss while cash-flowing — sheltering income. Rental losses are passive: they offset passive income freely, and up to $25,000/yr can offset ordinary (W-2) income if you actively participate and your MAGI is under $100k (phasing out to $0 by $150k); unused losses carry forward. On sale, claimed depreciation is recaptured at up to 25%, and gains may owe capital-gains tax (a 1031 exchange can defer both). Figures are a year-1 estimate at your 24.0% rate — not tax advice; consult a CPA.
Schools (NCES district)
- District
- Oelwein Community School District
- NCES district ID
- 1921630
- Math proficiency
- 47% ▼ -5.00%
- Reading proficiency
- 55% ▲ 5.00%
- Median HH income
- $39,812
- Composite
- 42.61/100
- National rank
- #3189
- State rank
- #281 of 289 in IA
Livability — Oelwein
- Score
- 76/100
- State rank
- #186
- US rank
- #3329
Category grades
Schools grade is shown separately in the Schools card above.
Census & demographics
- Census place
- Oelwein, IA
- Population (ZIP)
- 6,497
Population outlook (Fayette County) Hauer SSP2
- Today (2025)
- 19,299 people
- By 2030
- 18,701 · -3.1%
- By 2040
- 17,469 · -9.5%
- By 2050
- 16,389 · -15.1%
- By 2075
- 15,156 · -21.5%
- By 2100
- 14,214 · -26.3%
Race, ethnicity, and origin ACS 2023
- Neighborhood character
- Predominantly White (90%)
- Race & ethnicity
- White 90% Two or more races 5% Hispanic / Latino 3% Native American 1%
- Common ancestry
- Italian 3% Portuguese 3% Lithuanian 2%
- Foreign-born
- 0%
- Languages at home
- 99% English-only · Spanish 1%
Political lean MEDSL · Fayette
- 2024 margin
- Solid R (+30.5) · D 34.0% · R 64.4% · Other 1.6%
- 2008→2024 swing
- -47.1pp toward R · 2008: 16.6pp · 2024: -30.5pp
- All cycles
- 2024: R+30.5 2020: R+22.7 2016: R+19.6 2012: D+11.9 2008: D+16.6
Not yet ingested
- Civics
- —
Market trends
- HPI YoY
- ▼ -49.26%
- Current HPI
- 177.9399
- Rent YoY
- —
- Metro
- —
- State GDP YoY
- ▲ 2.48%
- F500 in state
- 4
Industry mix (Fortune 500 HQ in IA)
| Industry | F500 HQs | Revenue |
|---|---|---|
| Financial Services | 1 | $16B |
|
||
| Retail / Convenience | 1 | $15B |
|
||
Price history
+35.6% since first listed15 events — show timeline
- 2026-05-15 Listed $80,000 NEIRBR as distributed by MLS GRID
- 2026-05-15 Delisted — NEIRBR as distributed by MLS GRID
- 2026-02-23 Sold (Public Records) $35,000 Public Records
- 2026-02-18 Sold (MLS) $35,000 NEIRBR as distributed by MLS GRID
- 2026-01-26 Pending — NEIRBR as distributed by MLS GRID
- 2025-12-08 Price Changed $49,900 NEIRBR as distributed by MLS GRID
- 2025-11-24 Price Changed $59,900 NEIRBR as distributed by MLS GRID
- 2025-11-03 Listed $69,000 NEIRBR as distributed by MLS GRID
- 2022-11-01 Sold (MLS) $35,000 NEIRBR as distributed by MLS GRID
- 2022-09-19 Pending — NEIRBR as distributed by MLS GRID
- 2022-09-17 Listed $35,000 NEIRBR as distributed by MLS GRID
- 2020-04-13 Sold (Public Records) $50,000 Public Records
- 2020-04-09 Sold (MLS) $50,000 NEIRBR as distributed by MLS GRID
- 2018-07-06 Listed $55,000 NEIRBR as distributed by MLS GRID
- 2009-09-04 Sold (Public Records) $59,000 Public Records
Property tax history
+1.4%/yrLatest (2025): $1,776 · +11.6% YoY. Source: county tax records.
Cash-flow waterfall
monthlySold comps — $/sqft
last 12 mo · ≤1 miLoading sold comps…