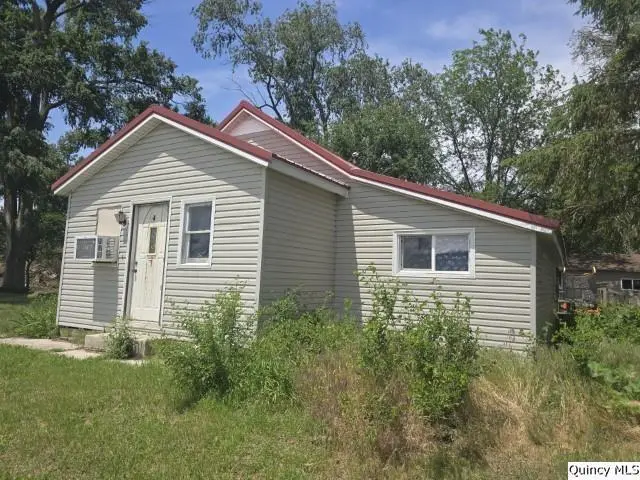
212 E Douglas · Sciota, IL
Flood risk 1/10 · Minimal
- FEMA flood zone
- X
- Chance of flooding over 30 yrs
- 0.0%
- Est. flood insurance / yr
- $507 – $1,088
Fire risk 1/10 · Minimal
- Est. fire insurance / yr
- $804 – $1,492
Heat risk 3/10 · Minor
- Hot days now (above 106°F)
- 7 days/yr
- Hot days in 30 yrs
- 17 days/yr
Wind risk 2/10 · Minimal
- Chance of severe wind over 30 yrs
- —
Air-quality risk 2/10 · Minimal
- Unhealthy air days now
- 1 days/yr
- Unhealthy air days in 30 yrs
- 1 days/yr
Risk factors via First Street. Map © Google.
Why this score? — see what drove the B grade
The composite is a weighted blend of 9 inputs, each scored 0–100. Each bar is that input's sub-score; the figure is the points it added to the 100-point composite (weight × sub-score).
- Cash flow +30.0/30.0
- 1% rule +10.0/10.0
- DSCR +10.0/10.0
- ARV discount +7.5/15.0
- Appreciation +5.0/10.0
- Livability +3.5/5.0
- Rent growth +2.5/5.0
- Condition / age +2.5/5.0
- Schools +1.9/10.0
$59,000
🖨 Deal sheet (PDF) 📄 Offer letter ✓ Due diligence
Listing remarks
Charming and affordable home located in the quiet community of Sciota! This 2-bedroom, 1 full bath home offers convenient one-level living and is perfect as a starter home, downsizing opportunity, or rental investment property. The home includes a laundry room, bathroom, kitchen, living room, 2 bedrooms, and an office/playroom. Situated on a spacious corner lot, the property also features a 2-car detached garage with plenty of room for parking and storage. Enjoy small-town living with great potential and easy maintenance all in one package! This home will be selling in "AS IS" condition.
Key facts
- Office playroom
- Laundry room
- One-level living
Tags
Property features AI
Finance
- Other: Zoning: Single-family
Exterior
- Parking: Detached garage with 2 parking spaces (2 total)
- Utilities: Public water; Septic tank
- Home design: Detached single-family home; One-story
- Construction: Metal roof; Vinyl siding
- Exterior features: Deck; Porch
Interior
- Kitchen: Range
- Bedrooms: Two bedrooms on the main level
- Flooring: Hardwood in office; Carpet in living room and one bedroom; Wood laminate in kitchen, laundry, and one bedroom
- Bathrooms: One full bathroom
- Heating & cooling: Forced air heating (natural gas); Wall cooling unit(s)
- Interior features: Crawl space basement; Main-level laundry
- Laundry & utility: Main-level laundry; Gas water heater; Fiber internet available
Neighborhood map
What this means for you Summary
Snapshot
- This is a 2-bed/1.0-bath other listed at $59k.
Deal economics
- At list price, monthly cash flow is $339 ($4k/yr) — positive.
- The deal already cash-flows at list — no discount required.
- Meets the 1% rule at list price ($940 rent vs $59k).
Location & tenants
- Location reads 70/100 on livability (#370 in IL) — a middle-class / working-renter tenant base. Strengths: employment A+, cost of living A+, housing A+; Watch: crime C-, health & safety C-, amenities F.
- West Prairie CUSD 103 (rural): math 20% / reading 23% proficiency, ranked #408 of 620 in IL (top 66%) — low school quality limits family demand, transient renter base, plan for 1-2y turnover.
- Zoned schools: West Prairie North Elementary Sch (math 34% / reading 15%, grade F, #844 of 2,056 statewide, top 41%, 174 students, 0% FRL); West Prairie Senior High School (math 10% / reading 30%, grade F, #357 of 693 statewide, top 54%, 162 students, 0% FRL) — zoned schools average 0% FRL vs 43% district-wide (43 pts lower); this property's tenant base skews higher-income than the district average.
- Market conditions: 2 active listings in the ZIP.
Forward outlook
- In year one you build about $2k of equity ($408 loan paydown + $2k appreciation (3.0% local appreciation)).
- At projected returns (3.0% appreciation + 3.0% rent growth), your $17k cash investment doubles in ~3 years — after that, you're playing with house money.
Negotiation context
- Only 7 days on market — expect competitive offers; lowballing is unlikely to land.
Risks & watch-outs
- Watch-outs: built in 1920 — expect roof / HVAC / electrical / plumbing capex.
Questions for the listing agent
- Built in 1920 — when were the roof, HVAC, electrical panel, plumbing, and water heater last replaced?
- Is there a deadline driving the sale (1031 exchange, divorce, estate, relocation)? That informs how much negotiation room exists.
- Schools are D-rated, which usually means shorter tenancies and higher turnover. Who's the typical renter profile here, and what's been the actual vacancy rate?
- What's the average days-on-market for RENTAL listings here right now (not sales)? A rising rental-DOM trend means longer vacancies and softer asking-rent achievability than the comps imply.
- What's the recent tenant-quality profile in this submarket — average credit score on applications, eviction rate, late-payment / NSF rate, and stable-employment percentage? A property-management company in the area should have these aggregated.
- How much new for-sale + rental construction is in the pipeline within 1–3 miles? Heavy new supply typically softens prices + rents 12–24 months out; constrained supply supports both.
Investment metrics
- 1% rule
- 1.59% ✓
- Cap rate
- 13.19%
- Cash-on-cash
- 24.62%
- DSCR
- 2.10
- GRM
- 5.2
CMA / ARV
No comps found within radius.
Projected returns pro-forma
3.0% appreciation · 3.0% rent growth · sell at horizon
- IRR
- 30.7%
- Equity multiple
- 2.74×
- Total profit
- $28,705
- Equity at exit
- $26,529
- IRR
- 31.1%
- Equity multiple
- 5.36×
- Total profit
- $71,960
- Equity at exit
- $40,884
Cash invested: $16,520 (down + closing). Projections, not guarantees.
Landlord ↔ Tenant lean methodology
- Overall (STATE)
- 43 Moderately Tenant-Leaning
- State Illinois
- 43 Moderately Tenant-Leaning · D+7
- County
- — inherits STATE
- City
- — inherits STATE
ZIP-level market 61475
- Active inventory
- 2
- Price-to-rent
- 5.2×
Monthly cashflow live
- Estimated rent
- $940 medium interval (Pro) →
- Mortgage (P&I)
- −$309
- Tax from tax record
- −$70 /mo · $839/yr
- Insurance
- −$25
- HOA
- −$0
- Vacancy / Maint / Mgmt
- −$197
- Net cashflow
- $339
Break-even live
Sensitivity live
| Price | -10% $372 | -5% $356 | +0% $339 | +5% $322 | +10% $306 |
|---|---|---|---|---|---|
| Rent | -10% $265 | -5% $302 | +0% $339 | +5% $376 | +10% $413 |
| Rate | -1.0pp $369 | -0.5pp $354 | base $339 | +0.5pp $324 | +1.0pp $308 |
UW: 25.0% down · 7.5% · 30yr · 1.5% tax · 5.0% vac · 8.0% maint · 8.0% mgmt
Financing live
Cash to close
- Down payment
- $14,750
- Closing costs
- $1,770
- Reserves months
- —
- Total cash needed
- —
Loan-product check · same deal, 3 products live
Conventional
25% down · 7.5% · 30yr
- Down + closing
- —
- Monthly P&I
- —
- Monthly cashflow
- —
- DSCR
- —
- Eligible?
- —
Personal DTI + credit; lowest rate.
DSCR
20% down · 8.5% · 30yr
- Down + closing
- —
- Monthly P&I
- —
- Monthly cashflow
- —
- DSCR
- —
- Eligible?
- —
No personal income docs; deal must DSCR.
Hard money
10% down · 12.0% · 12mo
- Down + closing
- —
- Monthly P&I
- —
- Monthly cashflow
- —
- DSCR
- —
- Eligible?
- —
Short-term bridge; refi at stabilization.
Listing history 7 events
-
2026-06-09status $59,000 Pending 7 DOM
-
2026-06-08days on market $59,000 Active 7 DOM
-
2026-06-07days on market $59,000 Active 6 DOM
-
2026-06-05days on market $59,000 Active 4 DOM
-
2026-06-04days on market $59,000 Active 2 DOM
-
2026-06-01remarks 595-char remark
-
2026-06-01$59,000 Active 1 DOM
ⓘ Source: listings_history table (triggers on properties + properties_extension) + one-shot
backfill from property_details.listing_events for pre-trigger history.
Tax reassessment forecast IL · Partial reset (capped growth)
- Current annual tax
- $839 · $70/mo
- Projected year-2 tax
- $1,089 · $91/mo
- Expected delta
- +$250/yr (+$21/mo · 29.8%)
ⓘ Screening estimate from a state-policy table — verify with the county assessor before closing.
Climate risk First Street
- Flood 1/10 Low FEMA zone X · 0% chance over 30 yrs
- Wildfire 1/10 Low
- Heat 3/10 Moderate 7 d/yr ≥106°F today · 17 d/yr by 30 yrs out
- Wind 2/10 Low
- Air quality 2/10 Low 1 unhealthy d/yr today · 1 by 30 yrs out
Nearby sold comps map
Loading sold comps map…
Walkable amenities ~0.75 mi
Loading nearby amenities…
Taxation est. · year 1
- Rental income
- $11,283
- − Mortgage interest
- −$3,305
- − Property taxes
- −$839
- − Insurance
- −$295
- − Repairs & maintenance
- −$903
- − Management
- −$903
- − Depreciation
- −$1,716
- Taxable income
- $3,323
- Est. tax owed @ 24.0%
- −$797
- After-tax cash flow
- $3,269/yr
For passive investors: Depreciation is non-cash, so a rental often shows a tax loss while cash-flowing — sheltering income. Rental losses are passive: they offset passive income freely, and up to $25,000/yr can offset ordinary (W-2) income if you actively participate and your MAGI is under $100k (phasing out to $0 by $150k); unused losses carry forward. On sale, claimed depreciation is recaptured at up to 25%, and gains may owe capital-gains tax (a 1031 exchange can defer both). Figures are a year-1 estimate at your 24.0% rate — not tax advice; consult a CPA.
Schools (NCES district)
- District
- West Prairie CUSD 103
- NCES district ID
- 1700314
- Math proficiency
- 20% ▬ 0.00%
- Reading proficiency
- 23% ▼ -8.00%
- Median HH income
- $44,721
- Composite
- 18.65/100
- National rank
- #8890
- State rank
- #408 of 620 in IL
Livability — Sciota
- Score
- 70/100
- State rank
- #370
- US rank
- #7710
Category grades
Schools grade is shown separately in the Schools card above.
Census & demographics
- Census place
- Sciota, IL
- Population (ZIP)
- 211
Population outlook (McDonough County) Hauer SSP2
- Today (2025)
- 33,242 people
- By 2030
- 33,318 · +0.2%
- By 2040
- 33,520 · +0.8%
- By 2050
- 33,630 · +1.2%
- By 2075
- 33,657 · +1.2%
- By 2100
- 33,127 · -0.3%
Race, ethnicity, and origin ACS 2023
- Neighborhood character
- Predominantly White (100%)
- Race & ethnicity
- White 100%
- Common ancestry
- Slovak 7% Iranian 4% Portuguese 4%
Political lean MEDSL · McDonough
- 2024 margin
- R (+18.9) · D 39.7% · R 58.5% · Other 1.8%
- 2008→2024 swing
- -24.4pp toward R · 2008: 5.6pp · 2024: -18.9pp
- All cycles
- 2024: R+18.9 2020: R+16.6 2016: R+11.7 2012: R+1.5 2008: D+5.6
Not yet ingested
- Civics
- —
Market trends
- HPI YoY
- —
- Current HPI
- —
- Rent YoY
- —
- Metro
- —
- State GDP YoY
- ▲ 1.59%
- F500 in state
- 60
Industry mix (Fortune 500 HQ in IL)
| Industry | F500 HQs | Revenue |
|---|---|---|
| Insurance | 4 | $201B |
|
||
| Consumer Goods | 4 | $87B |
|
||
| Industrial Machinery | 3 | $64B |
|
||
| Healthcare | 2 | $55B |
|
||
| Retail / Pharmacy | 1 | $148B |
|
||
| Agriculture / Food | 1 | $86B |
|
||
Price history
-2.9% since first listed2 events — show timeline
- 2026-06-01 Listed $59,000 MRED as Distributed by MLS Grid
- 2023-01-18 Sold (Public Records) $60,750 Public Records
Property tax history
+2.5%/yrLatest (2024): $839 · +6.2% YoY. Source: county tax records.
Cash-flow waterfall
monthlySold comps — $/sqft
last 12 mo · ≤1 miLoading sold comps…