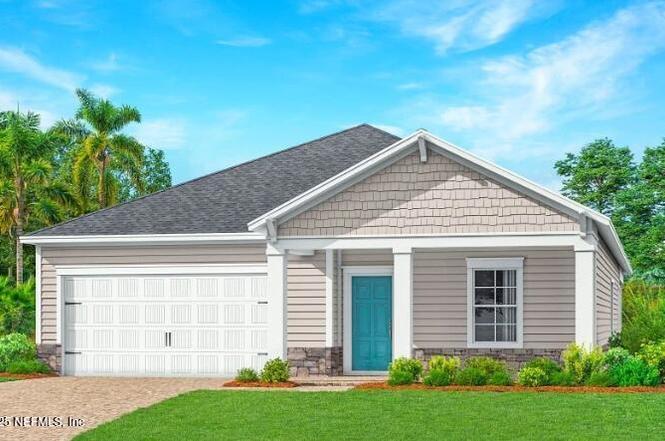
76069 Estuary Way · Jacksonville, FL
Flood risk No data
- FEMA flood zone
- —
- Chance of flooding over 30 yrs
- —
- Est. flood insurance / yr
- —
Fire risk No data
- Est. fire insurance / yr
- —
Heat risk No data
- Hot days now (above threshold)
- —
- Hot days in 30 yrs
- —
Wind risk No data
- Chance of severe wind over 30 yrs
- —
Air-quality risk No data
- Unhealthy air days now
- —
- Unhealthy air days in 30 yrs
- —
Risk factors via First Street. Map © Google.
Why this score? — see what drove the D- grade
The composite is a weighted blend of 9 inputs, each scored 0–100. Each bar is that input's sub-score; the figure is the points it added to the 100-point composite (weight × sub-score).
- Appreciation +10.0/10.0
- ARV discount +7.5/15.0
- Schools +6.0/10.0
- Cash flow +5.5/30.0
- Livability +4.2/5.0
- Rent growth +3.2/5.0
- Condition / age +2.5/5.0
- 1% rule +1.1/10.0
- DSCR +0.0/10.0
$458,480
🖨 Deal sheet (PDF) 📄 Offer letter ✓ Due diligence
Listing remarks
MOVE IN READY! NEWLY BUILT!! Lennar's Sierra Bonus floor plan features 4 bedrooms, 3.5 bathrooms, bonus room and a spacious 3-car garage. This thoughtfully designed home includes white cabinets with white quartz kitchen countertops, 42'' recessed panel cabinetry, and stainless steel appliances including a range, dishwasher, microwave, and refrigerator. Tile flooring is installed in all wet areas and extended into the family room, dining area, and hallways. Additional features include blinds throughout, a screened lanai, sprinkler system, and water heater. Enjoy peace of mind with a one-year builder warranty, a dedicated customer service program, and 24-hour emergency service. (Condition
Key facts
- Newly built
- White cabinets
- Screened lanai
Tags
Neighborhood map
What this means for you Summary
Snapshot
- This is a 4-bed/3.5-bath land listed at $458k.
Deal economics
- At list price, monthly cash flow is $-986 ($-12k/yr) — negative.
- To cash-flow at today's rent, offer at most $284k (38.0% below list).
- To meet the 1% rule (rent ≥ 1% of price), the offer needs to be $282k (38.5% below list).
- Recommended offer: $282k (38.5% below list) — sets the bar for 1% rule.
Location & tenants
- Location reads 83/100 on livability (#50 in FL, #911 nationally) — a professional / high-income tenant draw. Strengths: amenities A+, commute A+, housing A+.
- Nassau (town): math 74% / reading 65% proficiency, ranked #4 of 73 in FL (top 6%) — acceptable for families but not a draw, mixed tenant base, ~2y average lease.
- Market conditions: Rents rising (+2.9%/yr); 601 active listings in the ZIP; 11 comparable units currently listed for rent nearby; rentals at typical pace (median 21d on market — plan ~3-4 weeks tenant-placement turnaround); solid renter incomes; 953 units permitted in Nassau County in 2024 (24 in 5+ unit buildings).
- This rent runs 36% of the median local income ($93k/yr) — at the standard rent-burdened threshold; future hikes will face affordability resistance.
Forward outlook
- In year one you build about $49k of equity ($3k loan paydown + $46k appreciation (10.0% local appreciation)).
- Nassau County population projected at +17% by 2050 — long-run rental-demand tailwind backs the buy-and-hold thesis.
- By year 2, paydown + projected appreciation supports a ~$79k cash-out refi (75% LTV) — recoverable capital for the next deal without selling this one.
Negotiation context
- Only 3 days on market — expect competitive offers; lowballing is unlikely to land.
Questions for the listing agent
- What do current leases actually rent for vs. the listed asking? Can we see a recent rent roll and the last 12 months of T-12 income?
- What does the HOA fee cover, when was the last increase, and are there any pending special assessments or reserve-fund shortfalls?
- Is there a deadline driving the sale (1031 exchange, divorce, estate, relocation)? That informs how much negotiation room exists.
- Schools are B-rated — typically a magnet for longer-tenancy family renters. What's the average tenant stay here, and is there a school-zone premium baked into asking?
- The area grade is low — what's the realistic commute time and amenity access for the typical tenant pool here? Any planned neighborhood developments (good or bad) we should know about?
- What's the average days-on-market for RENTAL listings here right now (not sales)? A rising rental-DOM trend means longer vacancies and softer asking-rent achievability than the comps imply.
- What's the recent tenant-quality profile in this submarket — average credit score on applications, eviction rate, late-payment / NSF rate, and stable-employment percentage? A property-management company in the area should have these aggregated.
- How much new for-sale + rental construction is in the pipeline within 1–3 miles? Heavy new supply typically softens prices + rents 12–24 months out; constrained supply supports both.
Investment metrics
- 1% rule
- 0.61% ✗
- Cap rate
- 3.71%
- Cash-on-cash
- -9.21%
- DSCR
- 0.59
- GRM
- 13.6
CMA / ARV
No comps found within radius.
Projected returns pro-forma
10.0% appreciation · 2.88% rent growth · sell at horizon
- IRR
- 17.8%
- Equity multiple
- 2.45×
- Total profit
- $186,650
- Equity at exit
- $413,035
- IRR
- 16.7%
- Equity multiple
- 5.66×
- Total profit
- $598,475
- Equity at exit
- $890,726
Cash invested: $128,374 (down + closing). Projections, not guarantees.
Landlord ↔ Tenant lean methodology
- Overall (STATE)
- 87 Strongly Landlord-Friendly
- State Florida
- 87 Strongly Landlord-Friendly · R+3
- County
- — inherits STATE
- City
- — inherits STATE
ZIP-level market 32097
- Home prices YoY
- 19.5%
- Rents YoY
- 2.9%
- Active inventory
- 601
- Price-to-rent
- 13.6×
Monthly cashflow live
- Estimated rent
- $2,819 high interval (Pro) →
- Mortgage (P&I)
- −$2,404
- Tax from tax record
- −$344 /mo · $4,129/yr
- Insurance
- −$191
- HOA
- −$273
- Vacancy / Maint / Mgmt
- −$592
- Net cashflow
- $-986
Break-even live
Sensitivity live
| Price | -10% $-726 | -5% $-856 | +0% $-986 | +5% $-1,115 | +10% $-1,245 |
|---|---|---|---|---|---|
| Rent | -10% $-1,208 | -5% $-1,097 | +0% $-986 | +5% $-874 | +10% $-763 |
| Rate | -1.0pp $-755 | -0.5pp $-869 | base $-986 | +0.5pp $-1,105 | +1.0pp $-1,225 |
UW: 25.0% down · 7.5% · 30yr · 1.5% tax · 5.0% vac · 8.0% maint · 8.0% mgmt
Financing live
Cash to close
- Down payment
- $114,620
- Closing costs
- $13,754
- Reserves months
- —
- Total cash needed
- —
Loan-product check · same deal, 3 products live
Conventional
25% down · 7.5% · 30yr
- Down + closing
- —
- Monthly P&I
- —
- Monthly cashflow
- —
- DSCR
- —
- Eligible?
- —
Personal DTI + credit; lowest rate.
DSCR
20% down · 8.5% · 30yr
- Down + closing
- —
- Monthly P&I
- —
- Monthly cashflow
- —
- DSCR
- —
- Eligible?
- —
No personal income docs; deal must DSCR.
Hard money
10% down · 12.0% · 12mo
- Down + closing
- —
- Monthly P&I
- —
- Monthly cashflow
- —
- DSCR
- —
- Eligible?
- —
Short-term bridge; refi at stabilization.
Rent comps 11 comps
| Address | Beds | Baths | Sqft | Rent | $/sqft | DOM | Units | Dist |
|---|---|---|---|---|---|---|---|---|
| 75470 Sunberry Dr Yulee, FL | 5.0 | 4.0 | 2903 | $3,150 | $1.09 | 21d | 1 | 0.70mi |
| 65013 Lagoon Forest Dr Yulee, FL | 4.0 | 2.5 | 2245 | $2,800 | $1.25 | 12d | 1 | 0.87mi |
| 75094 Fern Creek Dr Yulee, FL | 4.0 | 2.0 | 2193 | $2,495 | $1.14 | 3d | 1 | 0.87mi |
| 75094 Glenspring Way Yulee, FL | 3.0 | 2.0 | 2055 | $2,500 | $1.22 | 25d | 1 | 1.02mi |
| 75215 Fern Creek Dr Yulee, FL | 4.0 | 2.5 | 2898 | $2,900 | $1.00 | 16d | 1 | 1.07mi |
| 75008 Morning Glen Ct Yulee, FL | 4.0 | 2.0 | 1856 | $2,300 | $1.24 | 25d | 1 | 1.15mi |
| 75047 Brookwood Dr Yulee, FL | 5.0 | 3.0 | 3300 | $3,405 | $1.03 | 5d | 1 | 1.23mi |
| 75075 Morning Glen Ct Yulee, FL | 4.0 | 2.0 | 1856 | $2,399 | $1.29 | 6d | 1 | 1.27mi |
| 76195 Deerwood Dr Yulee, FL | 4.0 | 2.5 | 2757 | $2,475 | $0.90 | 25d | 1 | 1.34mi |
| 70305 Winding River Dr Yulee, FL | 4.0 | 3.0 | 2042 | $2,500 | $1.22 | 25d | 1 | 1.39mi |
| 65303 River Glen Pkwy Yulee, FL | 4.0 | 2.0 | 2160 | $2,400 | $1.11 | 25d | 1 | 1.44mi |
HOA detail
- Monthly dues
- $273 · $3,276/yr
- Likely covers
- water
Listing history 3 events
-
2026-01-22status Pending
-
2026-01-20$468,480 Active
-
2025-12-17soldstatus $703,000
ⓘ Source: listings_history table (triggers on properties + properties_extension) + one-shot
backfill from property_details.listing_events for pre-trigger history.
Tax reassessment forecast FL · Resets to sale price
- Current annual tax
- $4,129 · $344/mo
- Projected year-2 tax
- $4,129 · $344/mo
- Expected delta
- $0/yr ($0/mo · 0.0%)
ⓘ Screening estimate from a state-policy table — verify with the county assessor before closing.
Nearby sold comps map
Loading sold comps map…
Walkable amenities ~0.75 mi
Loading nearby amenities…
Taxation est. · year 1
- Rental income
- $33,823
- − Mortgage interest
- −$25,682
- − Property taxes
- −$4,129
- − Insurance
- −$2,292
- − Repairs & maintenance
- −$2,706
- − Management
- −$2,706
- − HOA
- −$3,276
- − Depreciation
- −$13,338
- Taxable loss
- −$20,305
- Est. tax savings @ 24.0%
- +$4,873
- After-tax cash flow
- $-6,955/yr
For passive investors: Depreciation is non-cash, so a rental often shows a tax loss while cash-flowing — sheltering income. Rental losses are passive: they offset passive income freely, and up to $25,000/yr can offset ordinary (W-2) income if you actively participate and your MAGI is under $100k (phasing out to $0 by $150k); unused losses carry forward. On sale, claimed depreciation is recaptured at up to 25%, and gains may owe capital-gains tax (a 1031 exchange can defer both). Figures are a year-1 estimate at your 24.0% rate — not tax advice; consult a CPA.
Schools (NCES district)
- District
- Nassau
- NCES district ID
- 1201350
- Math proficiency
- 74% ▼ -2.00%
- Reading proficiency
- 65% ▼ -2.00%
- Median HH income
- $58,267
- Composite
- 59.79/100
- National rank
- #899
- State rank
- #4 of 73 in FL
Livability — Jacksonville
- Score
- 83/100
- State rank
- #50
- US rank
- #911
Category grades
Schools grade is shown separately in the Schools card above.
Census & demographics
- County
- Nassau County · 67,729 people
- City population
- 979,034
- Metro
- Jacksonville, FL
- Population (ZIP)
- 26,700
- Household income
- $93,161
- Rent vs Own
- Severe rent burden
- 404.0
Population outlook (Nassau County) Hauer SSP2
- Today (2025)
- 88,419 people
- By 2030
- 92,679 · +4.8%
- By 2040
- 99,257 · +12.3%
- By 2050
- 103,378 · +16.9%
- By 2075
- 109,726 · +24.1%
- By 2100
- 107,006 · +21.0%
Race, ethnicity, and origin ACS 2023
- Neighborhood character
- Predominantly White (75%)
- Race & ethnicity
- White 75% Two or more races 9% Black 9% Hispanic / Latino 8% Asian 1% Native American 1%
- Hispanic origin (detail)
- Mexican 2% Puerto Rican 2%
- Common ancestry
- Lithuanian 4% Italian 3% Romanian 2%
- Foreign-born
- 4% · Canada, Vietnam
- Languages at home
- 93% English-only · Spanish 5% Vietnamese 1%
Political lean MEDSL · Nassau
- 2024 margin
- Solid R (+46.9) · D 26.1% · R 73.1%
- 2008→2024 swing
- -3.1pp toward R · 2008: -43.8pp · 2024: -46.9pp
- All cycles
- 2024: R+46.9 2020: R+45.9 2016: R+50.2 2012: R+48.6 2008: R+43.8
Not yet ingested
- Civics
- —
Market trends
- HPI YoY
- ▲ 49.35%
- Current HPI
- 301.9299
- Rent YoY
- ▲ 2.88%
- Metro
- Jacksonville, FL
- State GDP YoY
- ▲ 3.28%
- F500 in state
- 36
Industry mix (Fortune 500 HQ in FL)
| Industry | F500 HQs | Revenue |
|---|---|---|
| Industrial Technology | 2 | $29B |
|
||
| Insurance | 2 | $17B |
|
||
| Retail | 1 | $60B |
|
||
| Technology Distribution | 1 | $58B |
|
||
| Homebuilding | 1 | $35B |
|
||
| Technology Manufacturing | 1 | $35B |
|
||
Price history
-33.4% since first listed3 events — show timeline
- 2026-01-22 Pending — realMLS
- 2026-01-20 Listed $468,480 realMLS
- 2025-12-17 Sold (Public Records) $703,000 Public Records
Property tax history
+1661.2%/yrLatest (2025): $4,129 · +1661.2% YoY. Source: county tax records.
Cash-flow waterfall
monthlySold comps — $/sqft
last 12 mo · ≤1 miLoading sold comps…