 Multi-family
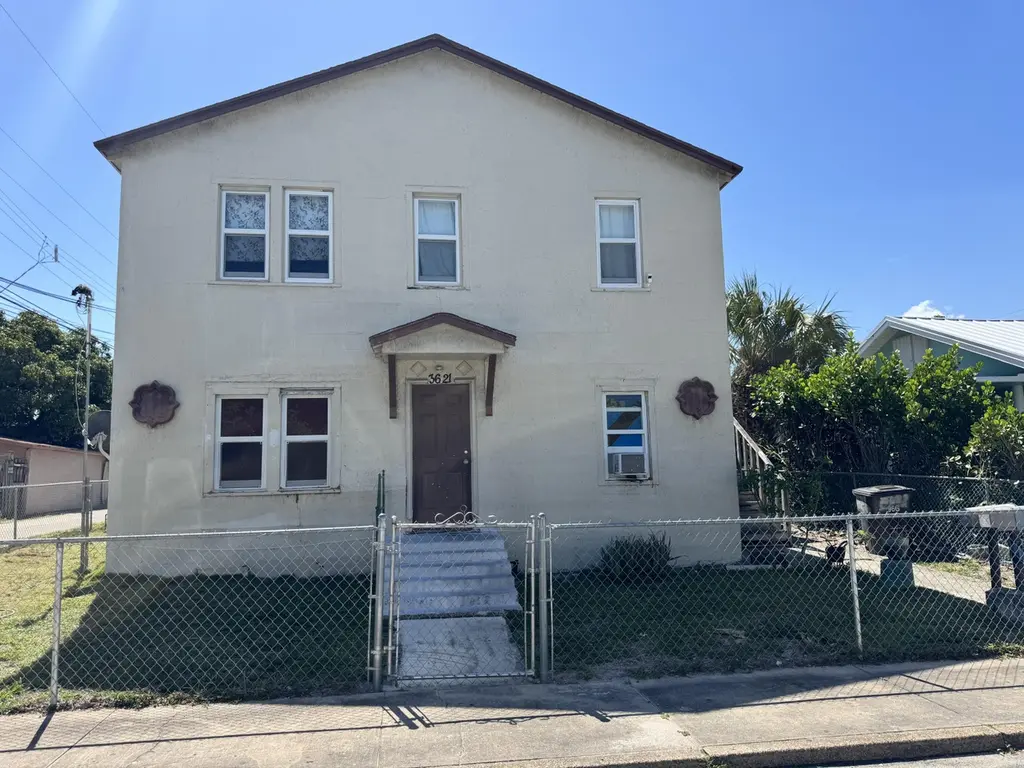
3621 Morton Ave · West Palm Beach, FL
Flood risk 1/10 · Minimal
- FEMA flood zone
- X (unshaded)
- Chance of flooding over 30 yrs
- 0.0%
- Est. flood insurance / yr
- $507 – $1,088
Fire risk 1/10 · Minimal
- Est. fire insurance / yr
- $947 – $1,759
Heat risk 10/10 · Severe
- Hot days now (above 105°F)
- 7 days/yr
- Hot days in 30 yrs
- 27 days/yr
Wind risk 10/10 · Severe
- Chance of severe wind over 30 yrs
- 99.0%
Air-quality risk 2/10 · Minimal
- Unhealthy air days now
- 1 days/yr
- Unhealthy air days in 30 yrs
- 1 days/yr
Risk factors via First Street. Map © Google.
Why this score? — see what drove the D grade
The composite is a weighted blend of 9 inputs, each scored 0–100. Each bar is that input's sub-score; the figure is the points it added to the 100-point composite (weight × sub-score).
- Cash flow +12.4/30.0
- ARV discount +7.5/15.0
- Schools +4.3/10.0
- Livability +4.1/5.0
- DSCR +3.7/10.0
- Rent growth +3.4/5.0
- 1% rule +2.8/10.0
- Condition / age +2.5/5.0
- Appreciation +0.0/10.0
$888,000
🖨 Deal sheet 📄 Offer letter ✓ Due diligence
Multi-family units
County records classify this as Multi-Family (5+ Unit). Listing-text estimate: 1 unit. estimate disagrees with records
5+ unit building — per-unit beds/baths from public records are typically unavailable; the breakdown below (if shown) is an estimate from the listing text.
Listing remarks
* * * * * INVESTORS LOOK AT THE CAP RATE * * * * * * * EXCELLENT INVESTMENT OPPORTUNITY IN GROWING AREA, THIS LISTING CONSISTS OF A 3 BEDROOM 1 BATH HOUSE, A 1 BEDROOM EFF / MOTHER INLAW , AND 2 (2) BEDROOMS 1 BATH EACH , SEPARATE BUILDING , CENTRALLY LOCATED JUST A FEW BLKS FROM INTERCOASTAL, CLOSE TO I-95,SCHOOLS, PARKS, TWO SEPARATE BLDS, ON AN OVERSIZED LOT. POTENTIAL LAUNDRY ROOM, POSSIBLE COIN LAUNDRY FOR EXTRA INCOME, OR TEAR DOWN AND BUILD 2 TOWNHOMES, POSSIBLY 3 WITH PERMISSION, ETC. .
Key facts
- Centrally located
- Oversized lot
- Growing area
Tags
Property features AI
Finance
- Financial info: Four total units; Gross monthly income reported at $3,260; Tenants pay cable TV, electricity, sewer and water; Pets allowed with no restrictions; Three units in the community
Exterior
- Utilities: Public water; Public sewer; Electricity connected; Sewer available; Water connected; Three separate electric meters
- Home design: Triplex property; One level per unit; Resale condition; Faces west of US-1
- Construction: Frame and stucco construction; Composition shingle roof; Built as a 2-story building
- Exterior features: Open porch; Covered porch; Shed(s); Fenced yard; Fruit trees; Room for a pool; Asphalt road frontage; Not waterfront
Interior
- Flooring: Ceramic tile
- Heating & cooling: Window/wall heating; Wall/window air conditioning units
- Interior features: Ceramic tile flooring; Storm windows and single-hung metal windows
- Laundry & utility: Washer hookup; Exterior laundry area
Neighborhood map
What this means for you Summary
Snapshot
- This is a 4-bed/2.0-bath multifamily listed at $888k.
Deal economics
- At list price, monthly cash flow is $-140 ($-2k/yr) — negative.
- To cash-flow at today's rent, offer at most $863k (2.8% below list).
- To meet the 1% rule (rent ≥ 1% of price), the offer needs to be $695k (21.7% below list).
- Recommended offer: $695k (21.7% below list) — sets the bar for 1% rule.
- Cap rate 6.1% vs local median 3.8% in West Palm Beach — top-decile yield for the area; either an underpriced asset or a hidden risk that comps aren't pricing in. Stress-test before assuming the spread holds.
Location & tenants
- Location reads 82/100 on livability (#75 in FL, #1,255 nationally) — a professional / high-income tenant draw. Strengths: commute A+, housing A+, health & safety A+; Watch: employment C-, crime F.
- Palm Beach (suburban): math 46% / reading 53% proficiency, ranked #34 of 73 in FL (top 47%) — families likely to look elsewhere, expect single-tenant / working-renter base with shorter leases.
- Zoned schools: Palmetto Elementary School (math 34% / reading 40%, grade F, #1,609 of 2,144 statewide, top 77%, 537 students, 82% FRL); Forest Hill Community High School (math 20% / reading 41%, grade F, #434 of 667 statewide, top 66%, 2,407 students, 66% FRL) — zoned schools average 74% FRL vs 52% district-wide (22 pts higher); higher-poverty schools than district average — tighter screening recommended.
- Zoned-school proficiency averages 34% at this address vs 50% district-wide (-16 pts) — the specific schools serving this property underperform the Palm Beach average; the district grade overstates school quality for this exact location.
- Market conditions: Rents rising (+3.4%/yr); 212 active listings in the ZIP; 36 comparable units currently listed for rent nearby; rentals at typical pace (median 21d on market — plan ~3-4 weeks tenant-placement turnaround); solid renter incomes; 3,974 units permitted in Palm Beach County in 2024 (1,012 in 5+ unit buildings).
Forward outlook
- Local home prices are declining (-3.0%/yr); year-one equity from $6k of loan paydown is wiped out by about $27k of value loss. Plan a longer hold.
- Palm Beach County population projected at +30% by 2050 — long-run rental-demand tailwind backs the buy-and-hold thesis.
Negotiation context
- It's been on market 51 days — a 3% lower offer ($861k) is reasonable based on typical stale-listing flexibility.
- 5 sale attempts since 21y ago; this cycle's ask has dropped $87k (9%) from the opening price — seller is motivated, your offer sets the floor, not the list.
- Current owner paid $68k; list at $888k implies a 1213% gain — meaningful room to come down on a strong offer.
Risks & watch-outs
- Watch-outs: built in 1945 — expect roof / HVAC / electrical / plumbing capex.
- Climate carrying-cost: severe wind risk, 99% chance of damaging wind over 30y; extreme-heat days projected 7→27/yr by 2055 (HVAC capex compounding) — expect insurance premiums to compound above CPI over the hold.
Questions for the listing agent
- What do current leases actually rent for vs. the listed asking? Can we see a recent rent roll and the last 12 months of T-12 income?
- It's been on market 51 days. Have you received any prior offers? Is the seller open to a 22% concession, seller financing, or rate buy-down credit?
- Built in 1945 — when were the roof, HVAC, electrical panel, plumbing, and water heater last replaced?
- Is there a deadline driving the sale (1031 exchange, divorce, estate, relocation)? That informs how much negotiation room exists.
- Crime grade is F in this area — have there been break-ins, vandalism, or insurance claims at this property in the last 3 years? What carrier currently insures it and at what premium?
- The area grade is low — what's the realistic commute time and amenity access for the typical tenant pool here? Any planned neighborhood developments (good or bad) we should know about?
- What's the average days-on-market for RENTAL listings here right now (not sales)? A rising rental-DOM trend means longer vacancies and softer asking-rent achievability than the comps imply.
- What's the recent tenant-quality profile in this submarket — average credit score on applications, eviction rate, late-payment / NSF rate, and stable-employment percentage? A property-management company in the area should have these aggregated.
- How much new apartment / multifamily construction is in the pipeline within 1–3 miles? Heavy new supply (>2% of stock underway) typically softens rents 12–24 months out; light construction supports rent growth.
Investment metrics
- 1% rule
- 0.78% ✗
- Cap rate
- 6.10%
- Cash-on-cash
- -0.68%
- DSCR
- 0.97
- GRM
- 10.6
CMA / ARV
No comps found within radius.
Projected returns pro-forma
-3.0% appreciation · 3.44% rent growth · sell at horizon
- IRR
- -17.0%
- Equity multiple
- 0.40×
- Total profit
- $-149,927
- Equity at exit
- $132,404
- IRR
- -8.2%
- Equity multiple
- 0.48×
- Total profit
- $-130,076
- Equity at exit
- $76,778
Cash invested: $248,640 (down + closing). Projections, not guarantees.
Landlord ↔ Tenant lean methodology
- Overall (STATE)
- 87 Strongly Landlord-Friendly
- State Florida
- 87 Strongly Landlord-Friendly · R+3
- County
- — inherits STATE
- City
- — inherits STATE
ZIP-level market 33405
- Rents YoY
- 3.4%
- Active inventory
- 212
- Price-to-rent
- 27.5×
Monthly cashflow live
- Estimated rent
- $6,951 medium interval (Pro) →
- Mortgage (P&I)
- −$4,657
- Tax from tax record
- −$605 /mo · $7,254/yr
- Insurance
- −$370
- HOA
- −$0
- Vacancy / Maint / Mgmt
- −$1,460
- Net cashflow
- $-140
Break-even live
3-unit breakdown (identical units grouped — click to expand)
| Units | Beds | Baths | Est. rent |
|---|---|---|---|
| 1× unit | 3 | 1 | $2,687 |
| 1× unit | 1 | 1 | $1,942 |
| 1× unit | 2 | 1 | $2,322 |
| Total (3 units) | $6,951 | ||
UW: 25.0% down · 7.5% · 30yr · 1.5% tax · 5.0% vac · 8.0% maint · 8.0% mgmt
Financing live
Cash to close
- Down payment
- $222,000
- Closing costs
- $26,640
- Reserves months
- —
- Total cash needed
- —
Loan-product check · same deal, 3 products live
Conventional
25% down · 7.5% · 30yr
- Down + closing
- —
- Monthly P&I
- —
- Monthly cashflow
- —
- DSCR
- —
- Eligible?
- —
Personal DTI + credit; lowest rate.
DSCR
20% down · 8.5% · 30yr
- Down + closing
- —
- Monthly P&I
- —
- Monthly cashflow
- —
- DSCR
- —
- Eligible?
- —
No personal income docs; deal must DSCR.
Hard money
10% down · 12.0% · 12mo
- Down + closing
- —
- Monthly P&I
- —
- Monthly cashflow
- —
- DSCR
- —
- Eligible?
- —
Short-term bridge; refi at stabilization.
Rent comps 36 comps
| Address | Beds | Baths | Sqft | Rent | $/sqft | DOM | Units | Dist |
|---|---|---|---|---|---|---|---|---|
| 423 Avenida Alegre West Palm Beach, FL | 4.0 | 2.0 | 1700 | $6,500 | $3.82 | 2d | 1 | 0.12mi |
| 340 Walton Blvd West Palm Beach, FL | 3.0 | 2.5 | 1854 | $4,000 | $2.16 | 7d | 1 | 0.19mi |
| 236 Greymon Dr West Palm Beach, FL | 3.0 | 2.0 | 1813 | $8,500 | $4.69 | 24d | 1 | 0.28mi |
| 300 Buckingham Rd West Palm Beach, FL | 3.0 | 2.0 | 1600 | $15,000 | $9.38 | 24d | 1 | 0.40mi |
| 3210 Vincent Rd West Palm Beach, FL | 3.0 | 2.0 | 1551 | $8,500 | $5.48 | 24d | 1 | 0.43mi |
| 3800 Washington Rd West Palm Beach, FL | 2.0–3.0 | 2.0 | 1318 | $10,000 | $7.59 | 20d | 4 | 0.43mi |
| 3800 Washington Rd West Palm Beach, FL | 2.0–3.0 | 2.0 | 1318 | $10,000 | $7.59 | 1d | 6 | 0.43mi |
| 3800 Washington Rd West Palm Beach, FL | 2.0–3.0 | 2.0 | 1318 | $10,000 | $7.59 | 7d | 5 | 0.43mi |
| 3111 S Dixie Hwy West Palm Beach, FL | 3.0 | 1.0–2.0 | 1024 | $5,172 | $5.05 | 5d | 17 | 0.45mi |
| 3901 S Flagler Dr West Palm Beach, FL | 2.0–5.0 | 2.0–5.0 | 2266 | $9,167 | $4.05 | 21d | 6 | 0.46mi |
| 3901 S Flagler Dr West Palm Beach, FL | 2.0–5.0 | 2.0–5.0 | 2266 | $9,000 | $3.97 | 2d | 6 | 0.46mi |
| 712 Tuscaloosa St West Palm Beach, FL | 4.0 | 2.0 | 1390 | $4,495 | $3.23 | 24d | 1 | 0.50mi |
| 719 Briggs St West Palm Beach, FL | 3.0 | 2.0 | 1328 | $3,500 | $2.64 | 20d | 1 | 0.52mi |
| 604 Piedmont Rd West Palm Beach, FL | 4.0 | 2.0 | 1329 | $3,500 | $2.63 | 7d | 1 | 0.55mi |
| 353 E Lakewood Rd West Palm Beach, FL | 3.0 | 2.0 | 1440 | $5,650 | $3.92 | 24d | 1 | 0.68mi |
| 3025 Robert Rd West Palm Beach, FL | 4.0 | 2.0 | 1678 | $3,146 | $1.87 | 7d | 1 | 0.70mi |
| 240 Almeria Rd West Palm Beach, FL | 3.0 | 3.0 | 1092 | $9,000 | $8.24 | 3d | 1 | 0.71mi |
| 5003 Garden Ave West Palm Beach, FL | 4.0 | 2.0 | 1220 | $2,950 | $2.42 | 14d | 1 | 0.76mi |
| 832 Green St #1 West Palm Beach, FL | 3.0 | 2.0 | 1700 | $4,550 | $2.68 | 11d | 1 | 0.82mi |
| 5008 Parker Ave West Palm Beach, FL | 3.0 | 2.0 | 1318 | $4,000 | $3.03 | 24d | 1 | 0.84mi |
| 904 Ortega Rd West Palm Beach, FL | 3.0 | 1.0 | 910 | $3,500 | $3.85 | 5d | 1 | 0.85mi |
| 605 Sunset Rd West Palm Beach, FL | 3.0 | 2.0 | 1434 | $4,000 | $2.79 | 24d | 1 | 0.90mi |
| 1041 W Lakewood Rd West Palm Beach, FL | 3.0 | 2.5 | 1857 | $4,300 | $2.32 | 24d | 1 | 0.92mi |
| 616 Upland Rd West Palm Beach, FL | 3.0 | 2.0 | 1456 | $4,500 | $3.09 | 24d | 1 | 0.97mi |
| 616 Upland Rd West Palm Beach, FL | 3.0 | 2.0 | 1456 | $4,500 | $3.09 | 20d | 1 | 0.97mi |
| 727 Bunker Rd West Palm Beach, FL | 3.0 | 1.0 | 875 | $3,200 | $3.66 | 20d | 1 | 1.01mi |
| 945 Sunset Rd Unit 1 West Palm Beach, FL | 3.0 | 3.0 | 1505 | $5,300 | $3.52 | 24d | 1 | 1.06mi |
| 110 Wilson Rd West Palm Beach, FL | 3.0 | 1.0 | 1433 | $8,000 | $5.58 | 24d | 1 | 1.06mi |
| 727 Fernwood Dr West Palm Beach, FL | 3.0 | 3.0 | 1667 | $7,200 | $4.32 | 24d | 1 | 1.07mi |
| 833 Ardmore Rd West Palm Beach, FL | 3.0 | 2.5 | 1132 | $4,500 | $3.98 | 16d | 1 | 1.09mi |
| 833 Ardmore Rd West Palm Beach, FL | 3.0 | 2.5 | 1132 | $4,500 | $3.98 | 15d | 1 | 1.09mi |
| 512 Revere Rd West Palm Beach, FL | 4.0 | 2.0 | 1371 | $3,395 | $2.48 | 24d | 1 | 1.15mi |
| 512 Revere Rd West Palm Beach, FL | 4.0 | 2.0 | 1371 | $3,395 | $2.48 | 15d | 1 | 1.15mi |
| 2109 Dock St West Palm Beach, FL | 3.0 | 2.0 | 1593 | $3,500 | $2.20 | 2d | 1 | 1.27mi |
| 410 Franklin Rd West Palm Beach, FL | 4.0 | 2.0 | 1388 | $3,300 | $2.38 | 24d | 1 | 1.46mi |
| 255 Cortez Rd West Palm Beach, FL | 3.0 | 2.0 | 1674 | $22,500 | $13.44 | 24d | 1 | 1.48mi |
Listing history 27 events
-
2026-06-18days on market $888,000 Active 51 DOM
-
2026-06-17days on market $888,000 Active 50 DOM
-
2026-06-16days on market $888,000 Active 49 DOM
-
2026-06-15days on market $888,000 Active 48 DOM
-
2026-06-13pricedays on market $888,000 Active 46 DOM
-
2026-06-09days on market $899,900 Active 42 DOM
-
2026-06-08days on market $899,900 Active 41 DOM
-
2026-06-07days on market $899,900 Active 40 DOM
-
2026-06-04pricedays on market $899,900 Active 37 DOM
-
2026-06-03days on market $919,900 Active 36 DOM
-
2026-06-02days on market $919,900 Active 35 DOM
-
2026-06-01days on market $919,900 Active 34 DOM
-
2026-05-31days on market $919,900 Active 33 DOM
-
2026-05-19price $929,900
-
2026-05-06price $949,900
-
2026-04-28$975,000 Active
-
2009-12-22historical
-
2009-12-17soldstatus $67,653
-
2009-08-09historical
-
2009-08-09$229,000
-
2008-12-05historical
-
2008-03-05$290,000
-
2007-01-09$329,000
-
2005-12-29historical
-
2005-07-22$389,000
-
2003-06-04soldstatus $100,000
-
1972-01-01soldstatus $18,500
ⓘ Source: listings_history table (triggers on properties + properties_extension) + one-shot
backfill from property_details.listing_events for pre-trigger history.
Tax reassessment forecast FL · Resets to sale price
- Current annual tax
- $7,254 · $605/mo
- Projected year-2 tax
- $7,370 · $614/mo
- Expected delta
- +$116/yr (+$10/mo · 1.6%)
ⓘ Screening estimate from a state-policy table — verify with the county assessor before closing.
Climate risk First Street
- Flood 1/10 Low FEMA zone X (unshaded) · 0% chance over 30 yrs
- Wildfire 1/10 Low
- Heat 10/10 Extreme 7 d/yr ≥105°F today · 27 d/yr by 30 yrs out
- Wind 10/10 Extreme 99% chance of damaging wind over 30 yrs
- Air quality 2/10 Low 1 unhealthy d/yr today · 1 by 30 yrs out
Nearby sold comps map
Loading sold comps map…
Walkable amenities ~0.75 mi
Loading nearby amenities…
Taxation est. · year 1
- Rental income
- $83,412
- − Mortgage interest
- −$49,742
- − Property taxes
- −$7,254
- − Insurance
- −$4,440
- − Repairs & maintenance
- −$6,673
- − Management
- −$6,673
- − Depreciation
- −$25,833
- Taxable loss
- −$17,203
- Est. tax savings @ 24.0%
- +$4,129
- After-tax cash flow
- $2,449/yr
For passive investors: Depreciation is non-cash, so a rental often shows a tax loss while cash-flowing — sheltering income. Rental losses are passive: they offset passive income freely, and up to $25,000/yr can offset ordinary (W-2) income if you actively participate and your MAGI is under $100k (phasing out to $0 by $150k); unused losses carry forward. On sale, claimed depreciation is recaptured at up to 25%, and gains may owe capital-gains tax (a 1031 exchange can defer both). Figures are a year-1 estimate at your 24.0% rate — not tax advice; consult a CPA.
Schools (NCES district)
- District
- Palm Beach
- NCES district ID
- 1201500
- Math proficiency
- 46% ▼ -16.00%
- Reading proficiency
- 53% ▼ -4.00%
- Median HH income
- $53,943
- Composite
- 42.72/100
- National rank
- #3160
- State rank
- #34 of 73 in FL
Livability — West Palm Beach
- Score
- 82/100
- State rank
- #75
- US rank
- #1255
Category grades
Schools grade is shown separately in the Schools card above.
Census & demographics
- Census place
- West Palm Beach, FL
- County
- Palm Beach County · 1,438,312 people
- City population
- 222,012
- Metro
- Miami-Fort Lauderdale-Pompano Beach, FL
- Population (ZIP)
- 19,780
- Household income
- $87,341
- Rent vs Own
- Severe rent burden
- 1055.0
Population outlook (Palm Beach County) Hauer SSP2
- Today (2025)
- 1,637,487 people
- By 2030
- 1,743,255 · +6.5%
- By 2040
- 1,948,712 · +19.0%
- By 2050
- 2,132,979 · +30.3%
- By 2075
- 2,530,027 · +54.5%
- By 2100
- 2,706,979 · +65.3%
Race, ethnicity, and origin ACS 2023
- Neighborhood character
- Majority Hispanic (51%)
- Race & ethnicity
- Hispanic / Latino 51% White 44% Two or more races 24% Black 3% Asian 1%
- Hispanic origin (detail)
- Mexican 7% Puerto Rican 5% Cuban 17% Dominican 2%
- Common ancestry
- Scotch-Irish 2% Slovak 2% Romanian 2%
- Foreign-born
- 37% · Canada, Guatemala, Jamaica
- Languages at home
- 50% English-only · Spanish 44% Other Indo-European 2% French/Haitian/Cajun 1%
Political lean MEDSL · Palm Beach
- 2024 margin
- Toss-up / Even · D 50.0% · R 49.2%
- 2008→2024 swing
- -22.1pp toward R · 2008: 22.9pp · 2024: 0.8pp
- All cycles
- 2024: D+0.8 2020: D+12.8 2016: D+15.3 2012: D+17.0 2008: D+22.9
Not yet ingested
- Civics
- —
Market trends
- HPI YoY
- ▼ -662.68%
- Current HPI
- 509.781
- Rent YoY
- ▲ 3.44%
- Metro
- Miami-Fort Lauderdale-Pompano Beach, FL
- State GDP YoY
- ▲ 3.28%
- F500 in state
- 36
Industry mix (Fortune 500 HQ in FL)
| Industry | F500 HQs | Revenue |
|---|---|---|
| Industrial Technology | 2 | $29B |
|
||
| Insurance | 2 | $17B |
|
||
| Retail | 1 | $60B |
|
||
| Technology Distribution | 1 | $58B |
|
||
| Homebuilding | 1 | $35B |
|
||
| Technology Manufacturing | 1 | $35B |
|
||
Price history
+4926.5% since first listed14 events — show timeline
- 2026-05-19 Price Changed $929,900 Beaches MLS
- 2026-05-06 Price Changed $949,900 Beaches MLS
- 2026-04-28 Listed $975,000 Beaches MLS
- 2009-12-22 Listing Removed — Beaches MLS
- 2009-12-17 Sold (Public Records) $67,653 Public Records
- 2009-08-09 Listed $229,000 Beaches MLS
- 2009-08-09 Listing Removed — Beaches MLS
- 2008-12-05 Listing Removed — Beaches MLS
- 2008-03-05 Listed $290,000 Beaches MLS
- 2007-01-09 Listed $329,000 Beaches MLS
- 2005-12-29 Listing Removed — Beaches MLS
- 2005-07-22 Listed $389,000 Beaches MLS
- 2003-06-04 Sold (Public Records) $100,000 Public Records
- 1972-01-01 Sold (Public Records) $18,500 Public Records
Property tax history
+7.2%/yrLatest (2025): $7,254 · +11.3% YoY. Source: county tax records.
Cash-flow waterfall
monthlySold comps — $/sqft
last 12 mo · ≤1 miLoading sold comps…