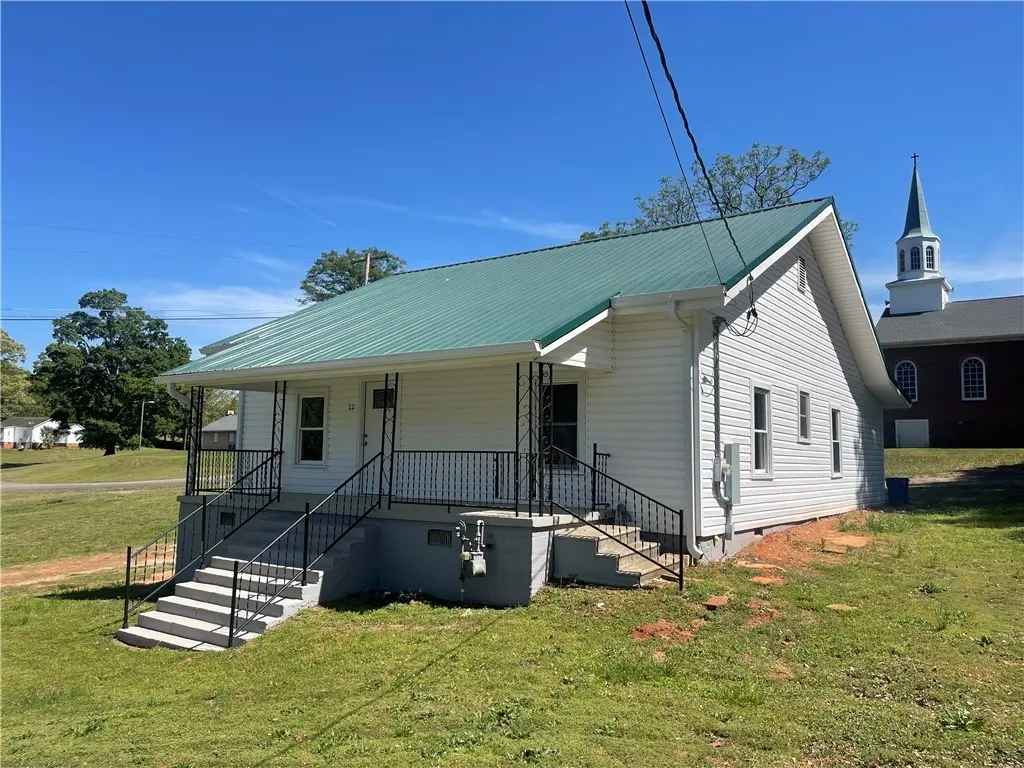
22 Third St · Parker, SC
Flood risk 1/10 · Minimal
- FEMA flood zone
- X (unshaded)
- Chance of flooding over 30 yrs
- 0.0%
- Est. flood insurance / yr
- $507 – $1,088
Fire risk 1/10 · Minimal
- Est. fire insurance / yr
- $783 – $1,453
Heat risk 6/10 · Moderate
- Hot days now (above 102°F)
- 7 days/yr
- Hot days in 30 yrs
- 17 days/yr
Wind risk 2/10 · Minimal
- Chance of severe wind over 30 yrs
- 1.0%
Air-quality risk 4/10 · Minor
- Unhealthy air days now
- 3 days/yr
- Unhealthy air days in 30 yrs
- 4 days/yr
Risk factors via First Street. Map © Google.
Why this score? — see what drove the C- grade
The composite is a weighted blend of 9 inputs, each scored 0–100. Each bar is that input's sub-score; the figure is the points it added to the 100-point composite (weight × sub-score).
- Cash flow +22.0/30.0
- ARV discount +7.5/15.0
- DSCR +7.1/10.0
- 1% rule +4.5/10.0
- Schools +4.2/10.0
- Livability +3.7/5.0
- Rent growth +2.5/5.0
- Condition / age +2.5/5.0
- Appreciation +0.0/10.0
$198,000
🖨 Deal sheet 📄 Offer letter ✓ Due diligence
Listing remarks
Totally remodeled classic southern Bungalow home! As you enter this home, the huge front porch will take you back to a much simpler time. .. but as you enter the home you will immediately feel like you are walking into a brand new construction home. Meticulously remodeled by a local general contractor, this home has been fully updated from top to bottom. The ceilings were even raised in the kitchen and living room to nearly 10 foot ceilings! The crawl space is walk-in with separate door- great for storage and access. New kitchen cabinets/countertops and appliances, luxury vinyl plank flooring throughout, new bathroom fixtures, new roof, wiring and plumbing. .. .this 3BR/2BA home is ready
Key facts
- Remodeled
- New wiring
- Front porch
Tags
Property features AI
Finance
- HOA & community: Short term rentals allowed
Exterior
- Parking: Driveway
- Security: Smoke detector(s)
- Utilities: Public water; Septic (septic tank) available; Electricity available; Natural gas available
- Home design: Single-story home; Metal roof; Vinyl siding; Crawlspace foundation; Property not in a subdivision and located outside city limits
- Construction: Vinyl siding construction; Metal roof; Crawlspace foundation; Built over 50 years ago
- Exterior features: Front porch; Porch
Interior
- Kitchen: Dishwasher; Gas cooktop; Gas oven; Gas range; Microwave; Refrigerator
- Bedrooms: 3 bedrooms on the main level (dimensions: approx. 8'2" x 15'8", 11'10" x 15'8", 15'4" x 15'11")
- Flooring: Luxury vinyl plank
- Bathrooms: 2 full bathrooms (both on the main level)
- Heating & cooling: Central heating (gas/natural gas); Heat pump; Central electric cooling
- Interior features: High ceilings; Smooth ceilings; Solid surface counters; Insulated vinyl tilt-in windows
- Laundry & utility: Washer hookup; Electric dryer hookup; Tankless water heater
Neighborhood map
What this means for you Summary
Snapshot
- This is a 2-bed/2.0-bath other listed at $198k.
Deal economics
- At list price, monthly cash flow is $317 ($4k/yr) — positive.
- The deal already cash-flows at list — no discount required.
- To meet the 1% rule (rent ≥ 1% of price), the offer needs to be $188k (5.2% below list).
- Recommended offer: $186k (6.0% below list) — sets the bar for market timing.
- Cap rate 8.2% vs local median 4.2% in Parker — top-decile yield for the area; either an underpriced asset or a hidden risk that comps aren't pricing in. Stress-test before assuming the spread holds.
Location & tenants
- Location reads 74/100 on livability (#31 in SC, #4,642 nationally) — a middle-class / working-renter tenant base. Strengths: commute A+, cost of living A+, housing A+; Watch: schools F, crime F, employment D-.
- Greenville 01 (suburban): math 44% / reading 54% proficiency, ranked #10 of 80 in SC (top 12%) — families likely to look elsewhere, expect single-tenant / working-renter base with shorter leases.
- Market conditions: 161 active listings in the ZIP; 40 comparable units currently listed for rent nearby; rentals at typical pace (median 14d on market — plan ~3-4 weeks tenant-placement turnaround); 5,595 units permitted in Greenville County in 2024 (566 in 5+ unit buildings).
- This rent runs 31% of the median local income ($72k/yr) — at the standard rent-burdened threshold; future hikes will face affordability resistance.
Forward outlook
- Local home prices are declining (-3.0%/yr); year-one equity from $1k of loan paydown is wiped out by about $6k of value loss. Plan a longer hold.
- Greenville County population projected at +34% by 2050 — long-run rental-demand tailwind backs the buy-and-hold thesis.
Negotiation context
- It's been on market 64 days — a 6% lower offer ($186k) is reasonable based on typical stale-listing flexibility.
- Current owner paid $13k; list at $198k implies a 1423% gain — meaningful room to come down on a strong offer.
Risks & watch-outs
- Watch-outs: built in 1946 — expect roof / HVAC / electrical / plumbing capex.
- Climate carrying-cost: extreme-heat days projected 7→17/yr by 2055 (HVAC capex compounding) — expect insurance premiums to compound above CPI over the hold.
Questions for the listing agent
- It's been on market 64 days. Have you received any prior offers? Is the seller open to a 6% concession, seller financing, or rate buy-down credit?
- Built in 1946 — when were the roof, HVAC, electrical panel, plumbing, and water heater last replaced?
- Why hasn't it sold? Are there any deal-killer items the seller is aware of (foundation, flood, title, zoning, code violations)?
- Is there a deadline driving the sale (1031 exchange, divorce, estate, relocation)? That informs how much negotiation room exists.
- Schools are F-rated, which usually means shorter tenancies and higher turnover. Who's the typical renter profile here, and what's been the actual vacancy rate?
- Crime grade is F in this area — have there been break-ins, vandalism, or insurance claims at this property in the last 3 years? What carrier currently insures it and at what premium?
- What's the average days-on-market for RENTAL listings here right now (not sales)? A rising rental-DOM trend means longer vacancies and softer asking-rent achievability than the comps imply.
- What's the recent tenant-quality profile in this submarket — average credit score on applications, eviction rate, late-payment / NSF rate, and stable-employment percentage? A property-management company in the area should have these aggregated.
- How much new for-sale + rental construction is in the pipeline within 1–3 miles? Heavy new supply typically softens prices + rents 12–24 months out; constrained supply supports both.
Investment metrics
- 1% rule
- 0.95% ✗
- Cap rate
- 8.21%
- Cash-on-cash
- 6.86%
- DSCR
- 1.31
- GRM
- 8.8
CMA / ARV
No comps found within radius.
Projected returns pro-forma
-3.0% appreciation · 3.0% rent growth · sell at horizon
- IRR
- -5.8%
- Equity multiple
- 0.78×
- Total profit
- $-12,003
- Equity at exit
- $29,522
- IRR
- 3.8%
- Equity multiple
- 1.27×
- Total profit
- $15,139
- Equity at exit
- $17,119
Cash invested: $55,440 (down + closing). Projections, not guarantees.
Landlord ↔ Tenant lean methodology
- Overall (STATE)
- 90 Strongly Landlord-Friendly
- State South Carolina
- 90 Strongly Landlord-Friendly · R+6
- County
- — inherits STATE
- City
- — inherits STATE
ZIP-level market 29670
- Home prices YoY
- -2.8%
- Active inventory
- 161
- Price-to-rent
- 8.8×
Monthly cashflow live
- Estimated rent
- $1,877 high interval (Pro) →
- Mortgage (P&I)
- −$1,038
- Tax from tax record
- −$45 /mo · $543/yr
- Insurance
- −$82
- HOA
- −$0
- Vacancy / Maint / Mgmt
- −$394
- Net cashflow
- $317
Break-even live
UW: 25.0% down · 7.5% · 30yr · 1.5% tax · 5.0% vac · 8.0% maint · 8.0% mgmt
Financing live
Cash to close
- Down payment
- $49,500
- Closing costs
- $5,940
- Reserves months
- —
- Total cash needed
- —
Loan-product check · same deal, 3 products live
Conventional
25% down · 7.5% · 30yr
- Down + closing
- —
- Monthly P&I
- —
- Monthly cashflow
- —
- DSCR
- —
- Eligible?
- —
Personal DTI + credit; lowest rate.
DSCR
20% down · 8.5% · 30yr
- Down + closing
- —
- Monthly P&I
- —
- Monthly cashflow
- —
- DSCR
- —
- Eligible?
- —
No personal income docs; deal must DSCR.
Hard money
10% down · 12.0% · 12mo
- Down + closing
- —
- Monthly P&I
- —
- Monthly cashflow
- —
- DSCR
- —
- Eligible?
- —
Short-term bridge; refi at stabilization.
Rent comps 40 comps
| Address | Beds | Baths | Sqft | Rent | $/sqft | DOM | Units | Dist |
|---|---|---|---|---|---|---|---|---|
| 1 E Main St Greenville, SC | 1.0–3.0 | 1.0–2.0 | 1241 | $2,098 | $1.69 | 3d | 28 | 0.11mi |
| 5 Charles St Greenville, SC | 3.0 | 2.0 | 1492 | $1,800 | $1.21 | 23d | 1 | 0.14mi |
| 7 Iola St Greenville, SC | 3.0 | 2.0 | 1165 | $2,500 | $2.15 | 14d | 1 | 0.22mi |
| 520 Perry Ave Greenville, SC | 3.0 | 2.0 | 1600 | $1,795 | $1.12 | 14d | 1 | 0.34mi |
| 19 Saco St Greenville, SC | 2.0 | 2.0 | 1050 | $2,400 | $2.29 | 23d | 1 | 0.40mi |
| 35 Burdette St Greenville, SC | 2.0 | 2.0 | 1600 | $1,950 | $1.22 | 23d | 1 | 0.44mi |
| 39 E 7th St Greenville, SC | 3.0 | 2.0 | 1120 | $1,750 | $1.56 | 3d | 1 | 0.45mi |
| 41 Burdette St #1 Greenville, SC | 3.0 | 2.0 | 1148 | $1,500 | $1.31 | 23d | 1 | 0.46mi |
| 33 9th St Greenville, SC | 2.0 | 1.0 | 886 | $1,000 | $1.13 | 23d | 1 | 0.49mi |
| 500 Birnie St Greenville, SC | 2.0 | 1.0 | 980 | $1,475 | $1.51 | 23d | 1 | 0.59mi |
| 4 Kilgore St Greenville, SC | 2.0 | 1.0 | 1050 | $1,500 | $1.43 | 23d | 1 | 0.69mi |
| 5 Zarline St Greenville, SC | 3.0 | 1.0 | 1060 | $1,095 | $1.03 | 19d | 1 | 0.70mi |
| 125 Ledbetter St Unit B Greenville, SC | 3.0 | 2.0 | 1270 | $1,850 | $1.46 | 3d | 1 | 0.76mi |
| 12 Catawba Ave Greenville, SC | 3.0 | 2.5 | 1399 | $1,650 | $1.18 | 14d | 1 | 0.82mi |
| 109 Virginia Ave Greenville, SC | 2.0 | 2.5 | 1134 | $1,699 | $1.50 | 23d | 1 | 0.89mi |
| 29 4th St Greenville, SC | 3.0 | 2.0 | 1120 | $1,695 | $1.51 | 3d | 1 | 0.90mi |
| 107 Virginia Ave Greenville, SC | 2.0 | 2.5 | 1134 | $1,699 | $1.50 | 23d | 1 | 0.90mi |
| 207 S Calhoun St Unit B Greenville, SC | 3.0 | 2.5 | 1730 | $2,597 | $1.50 | 14d | 1 | 1.01mi |
| 3 Frost St Greenville, SC | 3.0 | 2.0 | 1450 | $1,900 | $1.31 | 23d | 1 | 1.02mi |
| 420 Oscar St Greenville, SC | 3.0 | 2.0 | 1400 | $1,800 | $1.29 | 3d | 1 | 1.02mi |
| 5001 Assembly View Cir Greenville, SC | 1.0–3.0 | 1.0–2.0 | 975 | $1,328 | $1.36 | 3d | 27 | 1.03mi |
| 7 Hamilton Ave Unit 1 Greenville, SC | 3.0 | 3.0 | 1400 | $3,999 | $2.86 | 23d | 1 | 1.03mi |
| 106 Grace St Greenville, SC | 3.0 | 2.0 | 1562 | $2,695 | $1.73 | 3d | 1 | 1.06mi |
| 701 Easley Bridge Rd Greenville, SC | 3.0 | 1.0–2.5 | 1324 | $2,758 | $2.08 | 2d | 110 | 1.06mi |
| 25 Louise Ave Greenville, SC | 3.0 | 3.0 | 1600 | $1,999 | $1.25 | 23d | 1 | 1.07mi |
| 1108 S Main St Greenville, SC | 3.0 | 1.0–2.0 | 1060 | $2,883 | $2.72 | 3d | 25 | 1.19mi |
| 1027 S Main St #206 Greenville, SC | 2.0 | 2.5 | 1600 | $4,950 | $3.09 | 23d | 1 | 1.21mi |
| 102 Odessa St Greenville, SC | 2.0 | 2.0 | 1192 | $1,900 | $1.59 | 3d | 1 | 1.21mi |
| 802 Hampton Ave Unit A Greenville, SC | 2.0 | 1.0 | 900 | $1,300 | $1.44 | 23d | 1 | 1.23mi |
| 1250 WATER TOWER Cir Greenville, SC | 2.0 | 1.0–2.0 | 790 | $1,959 | $2.48 | 3d | 28 | 1.24mi |
| 409 Pinckney St Apt 2D Greenville, SC | 2.0 | 1.0 | 900 | $1,300 | $1.44 | 3d | 1 | 1.27mi |
| 1121 Tsali Cir Greenville, SC | 2.0 | 1.0–2.0 | 906 | $2,401 | $2.65 | 3d | 8 | 1.27mi |
| 3001 Lizzie Dr Greenville, SC | 1.0–3.0 | 1.0–2.0 | 976 | $1,118 | $1.15 | 23d | 1 | 1.28mi |
| 104 Wardlaw St Greenville, SC | 3.0 | 1.0–2.0 | 1126 | $3,579 | $3.18 | 3d | 42 | 1.30mi |
| 10 10th St Greenville, SC | 2.0 | 1.0 | 1152 | $1,100 | $0.95 | 3d | 1 | 1.30mi |
| 101 Reedy View Dr Greenville, SC | 2.0 | 1.0–2.0 | 862 | $3,577 | $4.15 | 3d | 31 | 1.30mi |
| 412 Green Ave Greenville, SC | 2.0 | 1.0 | 980 | $3,000 | $3.06 | 14d | 1 | 1.31mi |
| 44 4th Ave Greenville, SC | 3.0 | 2.0 | 1350 | $1,975 | $1.46 | 23d | 1 | 1.35mi |
| 366 Field St Greenville, SC | 2.0 | 1.0–2.0 | 926 | $4,698 | $5.07 | 3d | 9 | 1.41mi |
| 25 River St Greenville, SC | 2.0 | 1.0–2.0 | 842 | $3,066 | $3.64 | 3d | 10 | 1.44mi |
Listing history 17 events
-
2026-06-18days on market $198,000 Active 64 DOM
-
2026-06-17days on market $198,000 Active 63 DOM
-
2026-06-16pricedays on market $198,000 Active 62 DOM
-
2026-06-15days on market $219,000 Active 61 DOM
-
2026-06-13days on market $219,000 Active 59 DOM
-
2026-06-13days on market $219,000 Active 58 DOM
-
2026-06-10days on market $219,000 Active 56 DOM
-
2026-06-09days on market $219,000 Active 55 DOM
-
2026-06-08days on market $219,000 Active 54 DOM
-
2026-06-07days on market $219,000 Active 53 DOM
-
2026-06-03days on market $219,000 Active 49 DOM
-
2026-06-03days on market $219,000 Active 48 DOM
-
2026-06-01days on market $219,000 Active 47 DOM
-
2026-05-31days on market $219,000 Active 46 DOM
-
2026-05-19price $219,000
-
2026-04-15$229,000 Active
-
1989-06-22soldstatus $13,000
ⓘ Source: listings_history table (triggers on properties + properties_extension) + one-shot
backfill from property_details.listing_events for pre-trigger history.
Tax reassessment forecast SC · Resets to sale price
- Current annual tax
- $543 · $45/mo
- Projected year-2 tax
- $1,129 · $94/mo
- Expected delta
- +$586/yr (+$49/mo · 108.0%)
ⓘ Screening estimate from a state-policy table — verify with the county assessor before closing.
Climate risk First Street
- Flood 1/10 Low FEMA zone X (unshaded) · 0% chance over 30 yrs
- Wildfire 1/10 Low
- Heat 6/10 Major 7 d/yr ≥102°F today · 17 d/yr by 30 yrs out
- Wind 2/10 Low 100% chance of damaging wind over 30 yrs
- Air quality 4/10 Moderate 3 unhealthy d/yr today · 4 by 30 yrs out
Nearby sold comps map
Loading sold comps map…
Walkable amenities ~0.75 mi
Loading nearby amenities…
Taxation est. · year 1
- Rental income
- $22,524
- − Mortgage interest
- −$11,091
- − Property taxes
- −$543
- − Insurance
- −$990
- − Repairs & maintenance
- −$1,802
- − Management
- −$1,802
- − Depreciation
- −$5,760
- Taxable income
- $537
- Est. tax owed @ 24.0%
- −$129
- After-tax cash flow
- $3,673/yr
For passive investors: Depreciation is non-cash, so a rental often shows a tax loss while cash-flowing — sheltering income. Rental losses are passive: they offset passive income freely, and up to $25,000/yr can offset ordinary (W-2) income if you actively participate and your MAGI is under $100k (phasing out to $0 by $150k); unused losses carry forward. On sale, claimed depreciation is recaptured at up to 25%, and gains may owe capital-gains tax (a 1031 exchange can defer both). Figures are a year-1 estimate at your 24.0% rate — not tax advice; consult a CPA.
Schools (NCES district)
- District
- Greenville 01
- NCES district ID
- 4502310
- Math proficiency
- 44% ▼ -10.00%
- Reading proficiency
- 54% ▼ -2.00%
- Median HH income
- $49,596
- Composite
- 41.88/100
- National rank
- #3370
- State rank
- #10 of 80 in SC
Livability — Parker
- Score
- 74/100
- State rank
- #31
- US rank
- #4642
Category grades
Schools grade is shown separately in the Schools card above.
Census & demographics
- Census place
- Parker, SC
- County
- Anderson County · 99,076 people
- Metro
- Greenville-Anderson, SC
- Population (ZIP)
- 11,084
- Household income
- $72,445
- Rent vs Own
- Severe rent burden
- 280.0
Population outlook (Greenville County) Hauer SSP2
- Today (2025)
- 574,580 people
- By 2030
- 615,615 · +7.1%
- By 2040
- 695,373 · +21.0%
- By 2050
- 769,367 · +33.9%
- By 2075
- 933,296 · +62.4%
- By 2100
- 1,029,196 · +79.1%
Race, ethnicity, and origin ACS 2023
- Neighborhood character
- Predominantly White (75%)
- Race & ethnicity
- White 75% Black 15% Two or more races 5% Hispanic / Latino 2% Asian 1%
- Common ancestry
- Slovak 5% Lithuanian 5% Serbian 4%
- Foreign-born
- 3% · Canada
- Languages at home
- 96% English-only · Spanish 2% Other Indo-European 1%
Political lean MEDSL · Greenville
- 2024 margin
- Strong R (+22.2) · D 38.0% · R 60.2% · Other 1.8%
- 2008→2024 swing
- +1.7pp toward D · 2008: -23.9pp · 2024: -22.2pp
- All cycles
- 2024: R+22.2 2020: R+18.2 2016: R+24.7 2012: R+27.8 2008: R+23.9
Not yet ingested
- Civics
- —
Market trends
- HPI YoY
- ▼ -10.11%
- Current HPI
- 348.1373
- Rent YoY
- —
- Metro
- Greenville-Anderson, SC
- State GDP YoY
- ▲ 4.51%
- F500 in state
- 2
Industry mix (Fortune 500 HQ in SC)
| Industry | F500 HQs | Revenue |
|---|---|---|
| Packaging | 1 | $7B |
|
||
Price history
+1584.6% since first listed3 events — show timeline
- 2026-05-19 Price Changed $219,000 WUMLS
- 2026-04-15 Listed $229,000 WUMLS
- 1989-06-22 Sold (Public Records) $13,000 Public Records
Property tax history
+1.4%/yrLatest (2025): $543 · +11.7% YoY. Source: county tax records.
Cash-flow waterfall
monthlySold comps — $/sqft
last 12 mo · ≤1 miLoading sold comps…