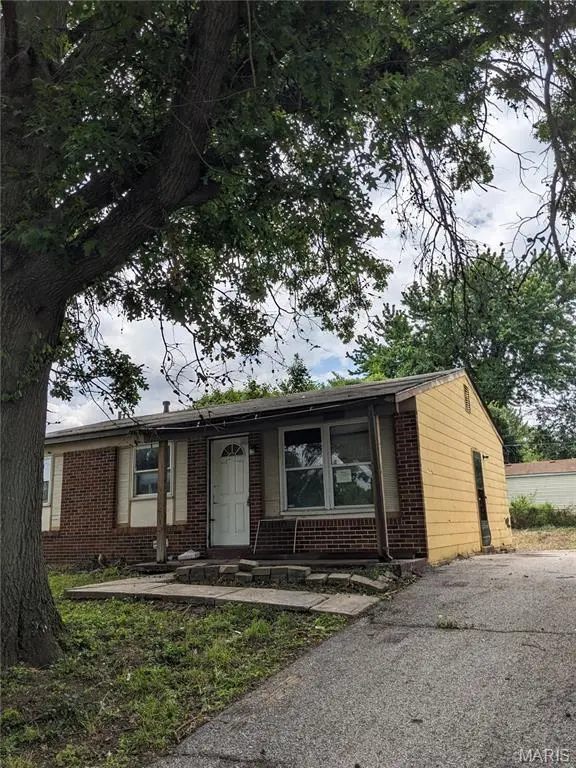
10333 Castle Dr · Castle Point, MO
Flood risk 1/10 · Minimal
- FEMA flood zone
- X (unshaded)
- Chance of flooding over 30 yrs
- 0.0%
- Est. flood insurance / yr
- $473 – $860
Fire risk 1/10 · Minimal
- Est. fire insurance / yr
- $1,054 – $1,958
Heat risk 5/10 · Moderate
- Hot days now (above 107°F)
- 7 days/yr
- Hot days in 30 yrs
- 21 days/yr
Wind risk 2/10 · Minimal
- Chance of severe wind over 30 yrs
- 1.0%
Air-quality risk 4/10 · Minor
- Unhealthy air days now
- 4 days/yr
- Unhealthy air days in 30 yrs
- 5 days/yr
Risk factors via First Street. Map © Google.
Why this score? — see what drove the B grade
The composite is a weighted blend of 9 inputs, each scored 0–100. Each bar is that input's sub-score; the figure is the points it added to the 100-point composite (weight × sub-score).
- Cash flow +30.0/30.0
- 1% rule +10.0/10.0
- DSCR +10.0/10.0
- ARV discount +7.5/15.0
- Appreciation +6.9/10.0
- Rent growth +3.7/5.0
- Livability +3.2/5.0
- Condition / age +2.5/5.0
- Schools +0.4/10.0
$47,900
🖨 Deal sheet (PDF) 📄 Offer letter ✓ Due diligence
Listing remarks
Charming 3-bed, 1-bath ranch home — 1,077 sq ft — smartly laid out for everyday living on a quiet cul-de-sac and just needs some loving care! Brick and vinyl exterior adds timeless curb appeal. Bright kitchen with French doors leading into the separate dining room creates elegant indoor flow for meals and entertaining. Full basement offers generous storage or potential for a finished living area. Large partial-fenced backyard provides outdoor privacy, 2 car garage, and an oversized driveway fits up to 4 additional cars — ideal for large households or guests. Conveniently located just minutes from from the highway, this home provides easy access while maintaining a peaceful
Key facts
- Bright kitchen
- Separate dining room
- French doors
Tags
Property features AI
Finance
- Other: Garage(s) listed as other structures; Above-grade finished living area recorded from public records
- HOA & community: Suburban neighborhood with street lights, restaurants and public bus access
Exterior
- Parking: Attached garage (2 spaces); Additional parking on driveway; Garage faces side; On-street parking; Asphalt surfaces
- Utilities: Public water; Public sewer; 220 volt electric; Cable available; Electricity connected; Natural gas connected; Phone available; Water connected; Sewer connected
- Home design: Single family residence; One story; Private ownership; Fixer condition
- Construction: Brick veneer and vinyl siding; Shingle, pitched/asphalt roof; Concrete perimeter foundation; Full unfinished poured concrete basement (8 ft+)
- Exterior features: Covered front porch; Private yard; Partial chain-link fencing in back yard; French doors; Located on a cul-de-sac with front yard, level lot and some trees; Near public transit
Interior
- Kitchen: Refrigerator; Gas water heater
- Bedrooms: 3 bedrooms (all on the main level)
- Flooring: Vinyl; Wood
- Bathrooms: 1 full bathroom (main level)
- Heating & cooling: Forced air heating (natural gas); Central air conditioning (electric)
- Interior features: Beamed ceilings; Ceiling fans; Open floor plan; Storage
- Laundry & utility: Laundry in basement
Neighborhood map
What this means for you Summary
Snapshot
- This is a 3-bed/1.0-bath single-family listed at $48k.
Deal economics
- At list price, monthly cash flow is $670 ($8k/yr) — positive.
- The deal already cash-flows at list — no discount required.
- Meets the 1% rule at list price ($1k rent vs $48k).
- Recommended offer: $47k (1.5% below list) — sets the bar for market timing.
- Cap rate 23.1% vs local median 13.0% in Castle Point — top-decile yield for the area; either an underpriced asset or a hidden risk that comps aren't pricing in. Stress-test before assuming the spread holds.
Location & tenants
- Location reads 64/100 on livability (#313 in MO) — a middle-class / working-renter tenant base. Strengths: cost of living A+, crime B; Watch: amenities F, commute F, employment F.
- Riverview Gardens (suburban): math 2% / reading 9% proficiency, ranked #324 of 324 in MO (top 100%) — low school quality limits family demand, transient renter base, plan for 1-2y turnover; 90% free/reduced lunch — lower-income household profile, screen leases tightly.
- Zoned schools: Lewis And Clark Elem. (math 2% / reading 2%, grade F, #1,099 of 1,115 statewide, top 100%, 145 students, 98% FRL); Riverview Gardens Sr. High (math 2% / reading 18%, grade F, #501 of 521 statewide, top 97%, 1,331 students, 100% FRL).
- Market conditions: Rents rising fast (+5.0%/yr); 372 active listings in the ZIP; 40 comparable units currently listed for rent nearby; rentals at typical pace (median 25d on market — plan ~3-4 weeks tenant-placement turnaround); lower-income renter base — watch delinquency; 920 units permitted in St. Louis County in 2024 (250 in 5+ unit buildings).
- This rent runs 38% of the median local income ($41k/yr) — at the standard rent-burdened threshold; future hikes will face affordability resistance.
Forward outlook
- In year one you build about $2k of equity ($331 loan paydown + $2k appreciation (3.8% local appreciation)).
- At projected returns (3.8% appreciation + 5.0% rent growth), your $13k cash investment doubles in ~2 years — after that, you're playing with house money.
Negotiation context
- It's been on market 20 days — a 2% lower offer ($47k) is reasonable based on typical stale-listing flexibility.
- 2 sale attempts since 2y ago with the ask held roughly flat each time — persistent listings suggest the price (not the market) is what's stuck; bring a comps-based counter.
Risks & watch-outs
- Climate carrying-cost: extreme-heat days projected 7→21/yr by 2055 (HVAC capex compounding) — expect insurance premiums to compound above CPI over the hold.
Questions for the listing agent
- Built in 1969 — when were the roof, HVAC, electrical panel, plumbing, and water heater last replaced?
- Is there a deadline driving the sale (1031 exchange, divorce, estate, relocation)? That informs how much negotiation room exists.
- Schools are F-rated, which usually means shorter tenancies and higher turnover. Who's the typical renter profile here, and what's been the actual vacancy rate?
- What's the average days-on-market for RENTAL listings here right now (not sales)? A rising rental-DOM trend means longer vacancies and softer asking-rent achievability than the comps imply.
- What's the recent tenant-quality profile in this submarket — average credit score on applications, eviction rate, late-payment / NSF rate, and stable-employment percentage? A property-management company in the area should have these aggregated.
- How much new for-sale + rental construction is in the pipeline within 1–3 miles? Heavy new supply typically softens prices + rents 12–24 months out; constrained supply supports both.
Investment metrics
- 1% rule
- 2.74% ✓
- Cap rate
- 23.09%
- Cash-on-cash
- 59.99%
- DSCR
- 3.67
- GRM
- 3.0
CMA / ARV
- ARV (on-the-fly)
- $123,855
- Comps found
- 12
Show comp detail 12 sales within ~0.75 mi
| Address | Dist | Beds/Ba | Sqft | Sold | Price | $/sf | Match |
|---|---|---|---|---|---|---|---|
| 10417 Prince Dr | 0.13mi | 3/1.5 | 1,040 (-3%) | 2mo | $120,000 | $115 | 85 |
| 10557 Castle Dr | 0.34mi | 3/1.5 | 1,023 (-5%) | 1mo | $110,000 | $108 | 73 |
| 10231 Monarch Dr | 0.48mi | 3/2.0 | 1,073 (-0%) | 1mo | $189,999 | $177 | 72 |
| 10127 Monarch Dr | 0.53mi | 3/1.5 | 1,015 (-6%) | 1mo | $155,000 | $153 | 63 |
| 2442 Gardner Dr | 0.62mi | 3/2.0 | 1,054 (-2%) | 2mo | $59,900 | $57 | 62 |
| 10139 Edgefield Dr | 0.56mi | 3/2.0 | 1,140 (+6%) | 0mo | $119,900 | $105 | 60 |
| 9984 Duke Dr | 0.54mi | 3/1.0 | 960 (-11%) | 1mo | $54,000 | $56 | 56 |
| 10522 Byfield Dr | 0.71mi | 2/1.0 (-1) | 1,038 (-4%) | 1mo | $99,900 | $96 | 54 |
| 2360 Chambers Rd | 0.57mi | 2/1.0 (-1) | 1,168 (+8%) | 1mo | $44,900 | $38 | 54 |
| 10217 Viscount Dr | 0.58mi | 3/2.0 | 1,205 (+12%) | 2mo | $149,000 | $124 | 48 |
| 10228 Viscount Dr | 0.54mi | 3/1.5 | 925 (-14%) | 2mo | $155,000 | $168 | 47 |
| 1236 Bliss Dr | 0.73mi | 3/1.0 | 944 (-12%) | 0mo | $118,000 | $125 | 45 |
Match score weights: distance 35% · size 25% · config 20% · recency 20%. Top-matched comps best support the ARV.
Projected returns pro-forma
3.79% appreciation · 4.97% rent growth · sell at horizon
- IRR
- 67.6%
- Equity multiple
- 4.97×
- Total profit
- $53,199
- Equity at exit
- $23,700
- IRR
- 67.3%
- Equity multiple
- 10.79×
- Total profit
- $131,363
- Equity at exit
- $38,304
Cash invested: $13,412 (down + closing). Projections, not guarantees.
Landlord ↔ Tenant lean methodology
- Overall (STATE)
- 81 Strongly Landlord-Friendly
- State Missouri
- 81 Strongly Landlord-Friendly · R+10
- County
- — inherits STATE
- City
- — inherits STATE
ZIP-level market 63136
- Home prices YoY
- 0.9%
- Rents YoY
- 5.0%
- Active inventory
- 372
- Price-to-rent
- 3.0×
Monthly cashflow live
- Estimated rent
- $1,312 high interval (Pro) →
- Mortgage (P&I)
- −$251
- Tax from tax record
- −$95 /mo · $1,135/yr
- Insurance
- −$20
- HOA
- −$0
- Vacancy / Maint / Mgmt
- −$275
- Net cashflow
- $670
Break-even live
Sensitivity live
| Price | -10% $698 | -5% $684 | +0% $670 | +5% $657 | +10% $643 |
|---|---|---|---|---|---|
| Rent | -10% $567 | -5% $619 | +0% $670 | +5% $722 | +10% $774 |
| Rate | -1.0pp $695 | -0.5pp $683 | base $670 | +0.5pp $658 | +1.0pp $645 |
UW: 25.0% down · 7.5% · 30yr · 1.5% tax · 5.0% vac · 8.0% maint · 8.0% mgmt
Financing live
Cash to close
- Down payment
- $11,975
- Closing costs
- $1,437
- Reserves months
- —
- Total cash needed
- —
Loan-product check · same deal, 3 products live
Conventional
25% down · 7.5% · 30yr
- Down + closing
- —
- Monthly P&I
- —
- Monthly cashflow
- —
- DSCR
- —
- Eligible?
- —
Personal DTI + credit; lowest rate.
DSCR
20% down · 8.5% · 30yr
- Down + closing
- —
- Monthly P&I
- —
- Monthly cashflow
- —
- DSCR
- —
- Eligible?
- —
No personal income docs; deal must DSCR.
Hard money
10% down · 12.0% · 12mo
- Down + closing
- —
- Monthly P&I
- —
- Monthly cashflow
- —
- DSCR
- —
- Eligible?
- —
Short-term bridge; refi at stabilization.
Rent comps 40 comps
| Address | Beds | Baths | Sqft | Rent | $/sqft | DOM | Units | Dist |
|---|---|---|---|---|---|---|---|---|
| 10421 Prince Dr Saint Louis, MO | 3.0 | 2.0 | 1023 | $1,275 | $1.25 | 24d | 1 | 0.15mi |
| 10441 Prince Dr Saint Louis, MO | 4.0 | 1.5 | 1380 | $1,380 | $1.00 | 44d | 1 | 0.20mi |
| 10404 Earl Dr Saint Louis, MO | 2.0 | 1.0 | 770 | $1,100 | $1.43 | 4d | 1 | 0.21mi |
| 10139 Royal Dr Saint Louis, MO | 2.0 | 1.0 | 1016 | $900 | $0.89 | 44d | 1 | 0.26mi |
| 10365 Lord Dr Saint Louis, MO | 3.0 | 1.0 | 864 | $1,075 | $1.24 | 2d | 1 | 0.28mi |
| 10501 Duke Dr Saint Louis, MO | 2.0 | 1.0 | 1140 | $1,090 | $0.96 | 44d | 1 | 0.29mi |
| 10113 Duke Dr Saint Louis, MO | 3.0 | 1.0 | 770 | $1,325 | $1.72 | 44d | 1 | 0.33mi |
| 10409 Count Dr Saint Louis, MO | 3.0 | 1.0 | 912 | $1,100 | $1.21 | 22d | 1 | 0.35mi |
| 1520 Attica Dr Saint Louis, MO | 2.0 | 1.0 | 1062 | $1,200 | $1.13 | 24d | 1 | 0.37mi |
| 10557 Castle Dr Saint Louis, MO | 3.0 | 2.0 | 1023 | $1,300 | $1.27 | 15d | 1 | 0.37mi |
| 10512 Count Dr Saint Louis, MO | 3.0 | 1.0 | 888 | $1,195 | $1.35 | 15d | 1 | 0.40mi |
| 10322 Monarch Dr Saint Louis, MO | 3.0 | 2.0 | 1073 | $1,728 | $1.61 | 24d | 1 | 0.41mi |
| 10112 Count Dr Saint Louis, MO | 2.0 | 1.0 | 792 | $1,000 | $1.26 | 8d | 1 | 0.42mi |
| 10113 Count Dr Saint Louis, MO | 2.0 | 1.0 | 882 | $775 | $0.88 | 44d | 1 | 0.44mi |
| 10504 Baron Dr Saint Louis, MO | 3.0 | 1.0 | 1000 | $1,300 | $1.30 | 8d | 1 | 0.44mi |
| 13061 Lord Dr St. Louis, MO | 2.0 | 1.0 | 900 | $1,040 | $1.16 | 22d | 1 | 0.45mi |
| 2326 Chambers Rd Saint Louis, MO | 2.0 | 1.0 | 1056 | $1,050 | $0.99 | 24d | 1 | 0.58mi |
| 1253 Avant Dr Saint Louis, MO | 2.0 | 1.0 | 795 | $1,295 | $1.63 | 18d | 1 | 0.66mi |
| 1253 Avant Dr Saint Louis, MO | 2.0 | 1.0 | 795 | $1,295 | $1.63 | 15d | 1 | 0.66mi |
| 2321 Noll Dr Saint Louis, MO | 3.0 | 1.0 | 975 | $1,320 | $1.35 | 24d | 1 | 0.67mi |
| 2257 Chambers Rd Saint Louis, MO | 3.0 | 1.0 | 1200 | $1,400 | $1.17 | 24d | 1 | 0.70mi |
| 9908 Norbridge Ln Saint Louis, MO | 2.0 | 2.0 | 1240 | $1,650 | $1.33 | 20d | 1 | 0.76mi |
| 1230 Roxton Dr Saint Louis, MO | 3.0 | 1.0 | 912 | $1,400 | $1.54 | 22d | 1 | 0.76mi |
| 1255 Bosworth Dr Saint Louis, MO | 3.0 | 1.0 | 1071 | $1,575 | $1.47 | 11d | 1 | 0.78mi |
| 1238 Hoyt Dr Saint Louis, MO | 3.0 | 1.0 | 1176 | $1,400 | $1.19 | 22d | 1 | 0.82mi |
| 10200 Tappan Dr Saint Louis, MO | 3.0 | 1.0 | 912 | $1,450 | $1.59 | 17d | 1 | 0.88mi |
| 9744 Lanier Dr Saint Louis, MO | 3.0 | 1.0 | 1014 | $1,345 | $1.33 | 44d | 1 | 0.89mi |
| 1115 Bakewell Dr Saint Louis, MO | 3.0 | 1.0 | 916 | $1,300 | $1.42 | 44d | 1 | 0.89mi |
| 2259 Ainsworth Dr Saint Louis, MO | 4.0 | 2.0 | 1500 | $1,776 | $1.18 | 44d | 1 | 0.90mi |
| 10129 Cavalier Ct Saint Louis, MO | 3.0 | 1.5 | 912 | $1,250 | $1.37 | 24d | 1 | 0.92mi |
| 10367 Coburg Lands Dr Saint Louis, MO | 3.0 | 1.0 | 912 | $1,270 | $1.39 | 44d | 1 | 0.93mi |
| 1208 Rapid Dr Saint Louis, MO | 3.0 | 1.0 | 992 | $1,375 | $1.39 | 5d | 1 | 0.93mi |
| 9723 Portage Dr Saint Louis, MO | 3.0 | 1.0 | 1014 | $1,450 | $1.43 | 8d | 1 | 0.95mi |
| 10508 Druid Dr Saint Louis, MO | 3.0 | 1.0 | 1122 | $1,475 | $1.31 | 17d | 1 | 1.01mi |
| 1009 Bliss Dr Saint Louis, MO | 3.0 | 1.0 | 912 | $1,400 | $1.54 | 44d | 1 | 1.03mi |
| 2257 Luxmore Dr Saint Louis, MO | 3.0 | 3.0 | 1073 | $1,495 | $1.39 | 24d | 1 | 1.05mi |
| 10128 Cloverdale Dr Saint Louis, MO | 2.0 | 1.0 | 792 | $1,000 | $1.26 | 24d | 1 | 1.06mi |
| 10128 Cloverdale Dr Saint Louis, MO | 2.0 | 1.0 | 792 | $1,000 | $1.26 | 44d | 1 | 1.06mi |
| 62 Capitol Hill Dr Saint Louis, MO | 3.0 | 2.0 | 1239 | $1,250 | $1.01 | 44d | 1 | 1.11mi |
| 10078 Green Valley Dr Saint Louis, MO | 3.0 | 1.0 | 900 | $1,325 | $1.47 | 8d | 1 | 1.14mi |
Listing history 14 events
-
2026-06-18days on market $47,900 Active 20 DOM
-
2026-06-17days on market $47,900 Active 19 DOM
-
2026-06-16days on market $47,900 Active 18 DOM
-
2026-06-15days on market $47,900 Active 17 DOM
-
2026-06-13days on market $47,900 Active 15 DOM
-
2026-06-13days on market $47,900 Active 14 DOM
-
2026-06-09days on market $47,900 Active 11 DOM
-
2026-06-08days on market $47,900 Active 10 DOM
-
2026-06-07days on market $47,900 Active 9 DOM
-
2026-06-05days on market $47,900 Active 6 DOM
-
2026-06-03days on market $47,900 Active 5 DOM
-
2026-06-02days on market $47,900 Active 4 DOM
-
2026-06-01days on market $47,900 Active 3 DOM
-
2026-05-31days on market $47,900 Active 2 DOM
ⓘ Source: listings_history table (triggers on properties + properties_extension) + one-shot
backfill from property_details.listing_events for pre-trigger history.
Tax reassessment forecast MO · Resets to sale price
- Current annual tax
- $1,135 · $95/mo
- Projected year-2 tax
- $1,135 · $95/mo
- Expected delta
- $0/yr ($0/mo · 0.0%)
ⓘ Screening estimate from a state-policy table — verify with the county assessor before closing.
Climate risk First Street
- Flood 1/10 Low FEMA zone X (unshaded) · 0% chance over 30 yrs
- Wildfire 1/10 Low
- Heat 5/10 Major 7 d/yr ≥107°F today · 21 d/yr by 30 yrs out
- Wind 2/10 Low 100% chance of damaging wind over 30 yrs
- Air quality 4/10 Moderate 4 unhealthy d/yr today · 5 by 30 yrs out
Nearby sold comps map
Loading sold comps map…
Walkable amenities ~0.75 mi
Loading nearby amenities…
Taxation est. · year 1
- Rental income
- $15,740
- − Mortgage interest
- −$2,683
- − Property taxes
- −$1,135
- − Insurance
- −$240
- − Repairs & maintenance
- −$1,259
- − Management
- −$1,259
- − Depreciation
- −$1,393
- Taxable income
- $7,771
- Est. tax owed @ 24.0%
- −$1,865
- After-tax cash flow
- $6,181/yr
For passive investors: Depreciation is non-cash, so a rental often shows a tax loss while cash-flowing — sheltering income. Rental losses are passive: they offset passive income freely, and up to $25,000/yr can offset ordinary (W-2) income if you actively participate and your MAGI is under $100k (phasing out to $0 by $150k); unused losses carry forward. On sale, claimed depreciation is recaptured at up to 25%, and gains may owe capital-gains tax (a 1031 exchange can defer both). Figures are a year-1 estimate at your 24.0% rate — not tax advice; consult a CPA.
Schools (NCES district)
- District
- Riverview Gardens
- NCES district ID
- 2926670
- Math proficiency
- 2% ▼ -6.00%
- Reading proficiency
- 9% ▼ -6.00%
- Median HH income
- $32,759
- Composite
- 4.22/100
- National rank
- #10058
- State rank
- #324 of 324 in MO
Livability — Castle Point
- Score
- 64/100
- State rank
- #313
- US rank
- #14373
Category grades
Schools grade is shown separately in the Schools card above.
Census & demographics
- Census place
- Castle Point, MO
- County
- Saint Louis County · 888,823 people
- Metro
- St. Louis, MO-IL
- Population (ZIP)
- 40,929
- Household income
- $41,154
- Rent vs Own
- Severe rent burden
- 3085.0
Population outlook (St. Louis County) Hauer SSP2
- Today (2025)
- 1,025,227 people
- By 2030
- 1,028,023 · +0.3%
- By 2040
- 1,020,940 · -0.4%
- By 2050
- 1,007,280 · -1.8%
- By 2075
- 987,277 · -3.7%
- By 2100
- 921,984 · -10.1%
Race, ethnicity, and origin ACS 2023
- Neighborhood character
- Predominantly Black (90%)
- Race & ethnicity
- Black 90% White 5% Two or more races 3%
- Foreign-born
- 1% · Canada
Political lean MEDSL · St. Louis
- 2024 margin
- Strong D (+23.4) · D 60.8% · R 37.4% · Other 1.7%
- 2008→2024 swing
- +3.5pp toward D · 2008: 19.9pp · 2024: 23.4pp
- All cycles
- 2024: D+23.4 2020: D+24.0 2016: D+16.2 2012: D+13.7 2008: D+19.9
Not yet ingested
- Civics
- —
Market trends
- HPI YoY
- ▲ 3.79%
- Current HPI
- 420.28
- Rent YoY
- ▲ 4.97%
- Metro
- St. Louis, MO-IL
- State GDP YoY
- ▲ 1.84%
- F500 in state
- 20
Industry mix (Fortune 500 HQ in MO)
| Industry | F500 HQs | Revenue |
|---|---|---|
| Healthcare | 1 | $163B |
|
||
| Insurance | 1 | $21B |
|
||
| Industrial Technology | 1 | $17B |
|
||
| Retail | 1 | $16B |
|
||
| Industrial Distribution | 1 | $10B |
|
||
| Utilities | 1 | $9B |
|
||
Price history
-31.6% since first listed5 events — show timeline
- 2026-05-29 Listed $47,900 MARIS as Distributed by MLS Grid
- 2024-09-28 Pending — MARIS as Distributed by MLS Grid
- 2024-09-04 Listed $55,000 MARIS as Distributed by MLS Grid
- 2024-08-22 Coming Soon — MARIS as Distributed by MLS Grid
- 2007-03-12 Sold (Public Records) $70,000 Public Records
Property tax history
+2.0%/yrLatest (2022): $1,135 · +0.4% YoY. Source: county tax records.
Cash-flow waterfall
monthlySold comps — $/sqft
last 12 mo · ≤1 miLoading sold comps…