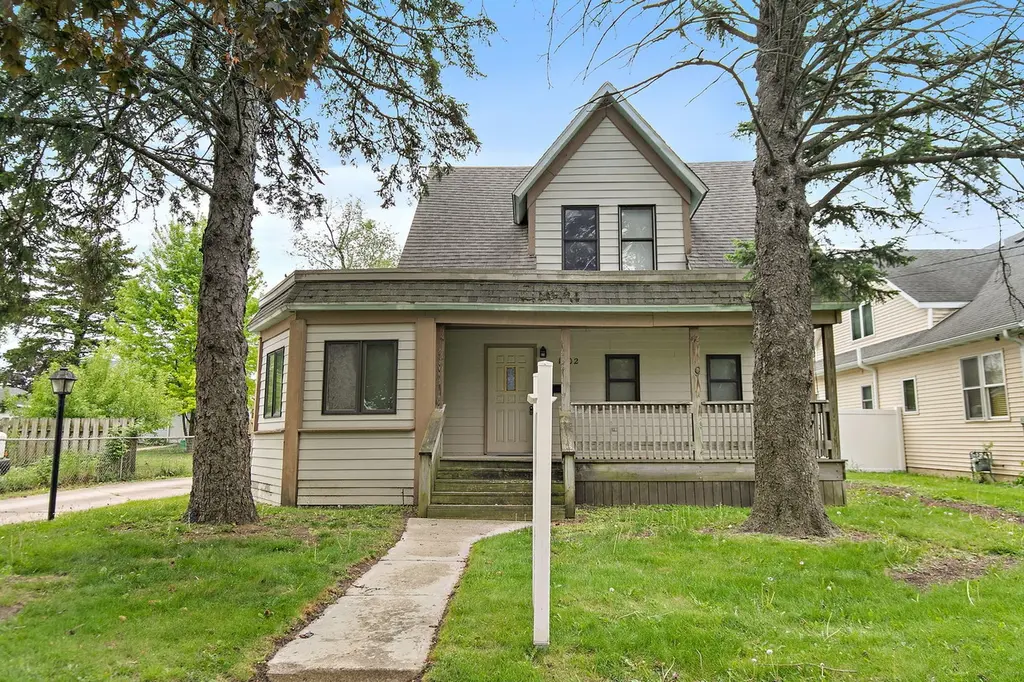
1302 State St · DeKalb, IL
Flood risk 1/10 · Minimal
- FEMA flood zone
- X (unshaded)
- Chance of flooding over 30 yrs
- 0.0%
- Est. flood insurance / yr
- $473 – $860
Fire risk 1/10 · Minimal
- Est. fire insurance / yr
- $804 – $1,492
Heat risk 2/10 · Minimal
- Hot days now (above 101°F)
- 7 days/yr
- Hot days in 30 yrs
- 15 days/yr
Wind risk 2/10 · Minimal
- Chance of severe wind over 30 yrs
- —
Air-quality risk 3/10 · Minor
- Unhealthy air days now
- 1 days/yr
- Unhealthy air days in 30 yrs
- 3 days/yr
Risk factors via First Street. Map © Google.
Why this score? — see what drove the C grade
The composite is a weighted blend of 9 inputs, each scored 0–100. Each bar is that input's sub-score; the figure is the points it added to the 100-point composite (weight × sub-score).
- Cash flow +23.5/30.0
- DSCR +7.6/10.0
- ARV discount +7.5/15.0
- 1% rule +7.2/10.0
- Rent growth +4.3/5.0
- Livability +3.9/5.0
- Condition / age +2.5/5.0
- Schools +1.2/10.0
- Appreciation +0.0/10.0
$153,000
🖨 Deal sheet 📄 Offer letter ✓ Due diligence
Listing remarks
IN RECEIPT OF MULTIPLE OFFERS: SELLERS REQUEST SUBMISSION OF ALL OFFERS BY SATURDAY, 5/16/202 AT NOON. Generously sized 3-bedroom, 1.5 bath home located in WL Ellwoods Addition. This property is truly a diamond in the rough, offering great potential for the right buyer. The home has been used as a rental for many years, and the owners are unsure of the ages of the mechanical systems or the roof. Not your typical Cape Cod-style home, the layout begins with a spacious living room that flows into the dining area. The eat-in kitchen features oak cabinets and a large window that brings in abundant natural light. Adjacent to the kitchen is a flexible space perfect for an office or play area. A co
Key facts
- Useful storage space
- Covered patio
- 8,712 sq ft lot
Tags
Property features AI
Finance
- Other: School bus service available; Lot dimensions approx. 60 x 145 (less than 0.25 acre)
- HOA & community: No master association fee required; Community features include sidewalks, street lights, and paved streets
Exterior
- Parking: Detached garage (owned); Concrete driveway; Approximately 1.5 garage spaces and about 4.5 total parking spaces (includes driveway)
- Utilities: Public water; Public sewer; Electric with circuit breakers
- Home design: Detached single-family home; 1.5-story design; Fee simple ownership; Rehab completed in 1990; Property over 100 years old
- Construction: Asphalt roof; Block and brick/mortar foundation; Other construction materials; Approximate finished area 1,200; Upper level area approx. 400; Total finished/unfinished area approx. 2,000
- Exterior features: Patio; Fenced yard
Interior
- Kitchen: Eating-area kitchen; Range; Dishwasher; Disposal
- Bedrooms: 3 bedrooms total (master bedroom on main level; additional bedrooms on second level); Loft (second level); Office (main level)
- Flooring: Carpet in most living areas and bedrooms; Vinyl in kitchen
- Bathrooms: 1 full bath; 1 half bath
- Heating & cooling: Natural gas heating; Central air conditioning; CO detectors installed
- Interior features: First-floor bedroom; Attic with dormer; Dining area combined with living room; Unfinished full basement with crawl space (approx. 800 unfinished)
- Laundry & utility: Laundry on main level; Dryer; Gas water heater
Neighborhood map
What this means for you Summary
Snapshot
- This is a 3-bed/1.5-bath other listed at $153k.
Deal economics
- At list price, monthly cash flow is $287 ($3k/yr) — positive.
- The deal already cash-flows at list — no discount required.
- Meets the 1% rule at list price ($2k rent vs $153k).
- Recommended offer: $151k (1.5% below list) — sets the bar for market timing.
- Cap rate 8.5% vs local median 4.4% in DeKalb — top-decile yield for the area; either an underpriced asset or a hidden risk that comps aren't pricing in. Stress-test before assuming the spread holds.
Location & tenants
- Location reads 77/100 on livability (#154 in IL, #2,835 nationally) — a middle-class / working-renter tenant base. Strengths: commute A+, cost of living A+, housing A+; Watch: amenities D+, crime D-, employment F.
- Dekalb CUSD 428 (suburban): math 11% / reading 16% proficiency, ranked #541 of 620 in IL (top 87%) — low school quality limits family demand, transient renter base, plan for 1-2y turnover.
- Zoned schools: Dekalb High School (math 18% / reading 28%, grade F, #312 of 693 statewide, top 46%, 2,083 students, 0% FRL) — zoned schools average 0% FRL vs 48% district-wide (48 pts lower); this property's tenant base skews higher-income than the district average.
- Market conditions: Rents rising fast (+7.3%/yr); 85 active listings in the ZIP; 4 comparable units currently listed for rent nearby; rentals lingering (median 44d on market — plan ~5-8 weeks vacancy on turnover, expect pricing pressure); 50% of comp listings sitting > 30 days — soft ceiling on asking rent; 260 units permitted in DeKalb County in 2024 (73 in 5+ unit buildings).
- At $1,872/mo this rent would consume 48% of the median local household income ($47k/yr) (locally 3794% of renters already pay >50% of income on rent) — very limited rent-growth headroom before tenants either downsize or default.
Forward outlook
- Local home prices are declining (-3.0%/yr); year-one equity from $1k of loan paydown is wiped out by about $5k of value loss. Plan a longer hold.
- DeKalb County population projected to shrink 5% by 2050 — rents likely to lag national; underwrite the cash flow, not the appreciation.
- At projected returns (-3.0% appreciation + 7.3% rent growth), your $43k cash investment doubles in ~8 years — after that, you're playing with house money.
Negotiation context
- It's been on market 27 days — a 2% lower offer ($151k) is reasonable based on typical stale-listing flexibility.
Risks & watch-outs
- Watch-outs: property tax is 2.6% of price; built in 1894 — expect roof / HVAC / electrical / plumbing capex.
Questions for the listing agent
- Built in 1894 — when were the roof, HVAC, electrical panel, plumbing, and water heater last replaced?
- Property tax is high relative to price — has the assessment been appealed recently, and will the sale trigger a re-assessment?
- Is there a deadline driving the sale (1031 exchange, divorce, estate, relocation)? That informs how much negotiation room exists.
- Schools are D-rated, which usually means shorter tenancies and higher turnover. Who's the typical renter profile here, and what's been the actual vacancy rate?
- Crime grade is D in this area — have there been break-ins, vandalism, or insurance claims at this property in the last 3 years? What carrier currently insures it and at what premium?
- What's the average days-on-market for RENTAL listings here right now (not sales)? A rising rental-DOM trend means longer vacancies and softer asking-rent achievability than the comps imply.
- What's the recent tenant-quality profile in this submarket — average credit score on applications, eviction rate, late-payment / NSF rate, and stable-employment percentage? A property-management company in the area should have these aggregated.
- How much new for-sale + rental construction is in the pipeline within 1–3 miles? Heavy new supply typically softens prices + rents 12–24 months out; constrained supply supports both.
Investment metrics
- 1% rule
- 1.22% ✓
- Cap rate
- 8.54%
- Cash-on-cash
- 8.03%
- DSCR
- 1.36
- GRM
- 6.8
CMA / ARV
No comps found within radius.
Projected returns pro-forma
-3.0% appreciation · 7.33% rent growth · sell at horizon
- IRR
- 1.2%
- Equity multiple
- 1.05×
- Total profit
- $2,088
- Equity at exit
- $22,813
- IRR
- 15.1%
- Equity multiple
- 2.49×
- Total profit
- $63,972
- Equity at exit
- $13,229
Cash invested: $42,840 (down + closing). Projections, not guarantees.
Landlord ↔ Tenant lean methodology
- Overall (STATE)
- 43 Moderately Tenant-Leaning
- State Illinois
- 43 Moderately Tenant-Leaning · D+7
- County
- — inherits STATE
- City
- — inherits STATE
ZIP-level market 60115
- Home prices YoY
- -31.9%
- Rents YoY
- 7.3%
- Active inventory
- 85
- Price-to-rent
- 6.8×
Monthly cashflow live
- Estimated rent
- $1,872 medium interval (Pro) →
- Mortgage (P&I)
- −$802
- Tax from tax record
- −$326 /mo · $3,912/yr
- Insurance
- −$64
- HOA
- −$0
- Vacancy / Maint / Mgmt
- −$393
- Net cashflow
- $287
Break-even live
UW: 25.0% down · 7.5% · 30yr · 1.5% tax · 5.0% vac · 8.0% maint · 8.0% mgmt
Financing live
Cash to close
- Down payment
- $38,250
- Closing costs
- $4,590
- Reserves months
- —
- Total cash needed
- —
Loan-product check · same deal, 3 products live
Conventional
25% down · 7.5% · 30yr
- Down + closing
- —
- Monthly P&I
- —
- Monthly cashflow
- —
- DSCR
- —
- Eligible?
- —
Personal DTI + credit; lowest rate.
DSCR
20% down · 8.5% · 30yr
- Down + closing
- —
- Monthly P&I
- —
- Monthly cashflow
- —
- DSCR
- —
- Eligible?
- —
No personal income docs; deal must DSCR.
Hard money
10% down · 12.0% · 12mo
- Down + closing
- —
- Monthly P&I
- —
- Monthly cashflow
- —
- DSCR
- —
- Eligible?
- —
Short-term bridge; refi at stabilization.
Rent comps 4 comps
| Address | Beds | Baths | Sqft | Rent | $/sqft | DOM | Units | Dist |
|---|---|---|---|---|---|---|---|---|
| 172 Oak Dr DeKalb, IL | 3.0 | 1.0 | 950 | $2,000 | $2.11 | 21d | 1 | 0.57mi |
| 219 S 7th St DeKalb, IL | 2.0 | 1.5 | 1054 | $1,700 | $1.61 | 6d | 1 | 0.62mi |
| 1472 Cambria Dr DeKalb, IL | 2.0 | 1.5 | 1200 | $1,750 | $1.46 | 44d | 1 | 0.94mi |
| 1535 Reserve Ln #1535 DeKalb, IL | 2.0 | 2.0 | 1488 | $2,300 | $1.55 | 44d | 1 | 1.00mi |
Listing history 12 events
-
2026-06-10status $153,000 Pending 27 DOM
-
2026-06-09days on market $153,000 Contingent - Continue to Show 27 DOM
-
2026-06-08days on market $153,000 Contingent - Continue to Show 26 DOM
-
2026-06-07days on market $153,000 Contingent - Continue to Show 25 DOM
-
2026-06-04days on market $153,000 Contingent - Continue to Show 22 DOM
-
2026-06-03days on market $153,000 Contingent - Continue to Show 21 DOM
-
2026-06-02days on market $153,000 Contingent - Continue to Show 20 DOM
-
2026-06-01days on market $153,000 Contingent - Continue to Show 19 DOM
-
2026-05-31days on market $153,000 Contingent - Continue to Show 18 DOM
-
2026-05-17historical Contingent - Continue to Show 1448-char remark
-
2026-05-12$153,000 Active 1448-char remark
-
1995-07-27soldstatus $60,000
ⓘ Source: listings_history table (triggers on properties + properties_extension) + one-shot
backfill from property_details.listing_events for pre-trigger history.
Tax reassessment forecast IL · Partial reset (capped growth)
- Current annual tax
- $3,912 · $326/mo
- Projected year-2 tax
- $3,912 · $326/mo
- Expected delta
- $0/yr ($0/mo · 0.0%)
ⓘ Screening estimate from a state-policy table — verify with the county assessor before closing.
Climate risk First Street
- Flood 1/10 Low FEMA zone X (unshaded) · 0% chance over 30 yrs
- Wildfire 1/10 Low
- Heat 2/10 Low 7 d/yr ≥101°F today · 15 d/yr by 30 yrs out
- Wind 2/10 Low
- Air quality 3/10 Moderate 1 unhealthy d/yr today · 3 by 30 yrs out
Nearby sold comps map
Loading sold comps map…
Walkable amenities ~0.75 mi
Loading nearby amenities…
Taxation est. · year 1
- Rental income
- $22,462
- − Mortgage interest
- −$8,570
- − Property taxes
- −$3,912
- − Insurance
- −$765
- − Repairs & maintenance
- −$1,797
- − Management
- −$1,797
- − Depreciation
- −$4,451
- Taxable income
- $1,170
- Est. tax owed @ 24.0%
- −$281
- After-tax cash flow
- $3,159/yr
For passive investors: Depreciation is non-cash, so a rental often shows a tax loss while cash-flowing — sheltering income. Rental losses are passive: they offset passive income freely, and up to $25,000/yr can offset ordinary (W-2) income if you actively participate and your MAGI is under $100k (phasing out to $0 by $150k); unused losses carry forward. On sale, claimed depreciation is recaptured at up to 25%, and gains may owe capital-gains tax (a 1031 exchange can defer both). Figures are a year-1 estimate at your 24.0% rate — not tax advice; consult a CPA.
Schools (NCES district)
- District
- Dekalb CUSD 428
- NCES district ID
- 1712000
- Math proficiency
- 11% ▼ -9.00%
- Reading proficiency
- 16% ▼ -6.00%
- Median HH income
- $42,007
- Composite
- 11.74/100
- National rank
- #9685
- State rank
- #541 of 620 in IL
Livability — DeKalb
- Score
- 77/100
- State rank
- #154
- US rank
- #2835
Category grades
Schools grade is shown separately in the Schools card above.
Census & demographics
- Census place
- DeKalb, IL
- County
- DeKalb County · 64,760 people
- City population
- 42,536
- Metro
- Chicago-Naperville-Elgin, IL-IN-WI
- Population (ZIP)
- 42,536
- Household income
- $47,043
- Rent vs Own
- Severe rent burden
- 3794.0
Population outlook (DeKalb County) Hauer SSP2
- Today (2025)
- 104,983 people
- By 2030
- 104,428 · -0.5%
- By 2040
- 102,199 · -2.7%
- By 2050
- 99,303 · -5.4%
- By 2075
- 93,978 · -10.5%
- By 2100
- 88,527 · -15.7%
Race, ethnicity, and origin ACS 2023
- Neighborhood character
- Diverse neighborhood (Simpson 0.61)
- Race & ethnicity
- White 58% Hispanic / Latino 18% Black 15% Two or more races 12% Asian 4%
- Hispanic origin (detail)
- Mexican 14% Puerto Rican 2%
- Common ancestry
- Romanian 5% Portuguese 3% Lithuanian 2%
- Foreign-born
- 9% · Canada, China
- Languages at home
- 82% English-only · Spanish 10% Arabic 2% Other Indo-European 2%
Political lean MEDSL · DeKalb
- 2024 margin
- Toss-up / Even · D 50.1% · R 48.1% · Other 1.7%
- 2008→2024 swing
- -14.8pp toward R · 2008: 16.8pp · 2024: 2.0pp
- All cycles
- 2024: D+2.0 2020: D+5.7 2016: D+3.0 2012: D+5.5 2008: D+16.8
Not yet ingested
- Civics
- —
Market trends
- HPI YoY
- ▼ -89.56%
- Current HPI
- 191.1189
- Rent YoY
- ▲ 7.33%
- Metro
- Chicago-Naperville-Elgin, IL-IN-WI
- State GDP YoY
- ▲ 1.59%
- F500 in state
- 60
Industry mix (Fortune 500 HQ in IL)
| Industry | F500 HQs | Revenue |
|---|---|---|
| Insurance | 4 | $201B |
|
||
| Consumer Goods | 4 | $87B |
|
||
| Industrial Machinery | 3 | $64B |
|
||
| Healthcare | 2 | $55B |
|
||
| Retail / Pharmacy | 1 | $148B |
|
||
| Agriculture / Food | 1 | $86B |
|
||
Price history
+166.7% since first listed5 events — show timeline
- 2026-06-17 Sold (MLS) $160,000 MRED as Distributed by MLS Grid
- 2026-06-09 Pending — MRED as Distributed by MLS Grid
- 2026-05-17 Contingent — MRED as Distributed by MLS Grid
- 2026-05-12 Listed $153,000 MRED as Distributed by MLS Grid
- 1995-07-27 Sold (Public Records) $60,000 Public Records
Property tax history
+1.1%/yrLatest (2025): $3,912 · +8.6% YoY. Source: county tax records.
Cash-flow waterfall
monthlySold comps — $/sqft
last 12 mo · ≤1 miLoading sold comps…