 🏗️ New Construction
Canby Plan · Happy Valley, OR
Flood risk 1/10 · Minimal
- FEMA flood zone
- X (unshaded)
- Chance of flooding over 30 yrs
- 0.0%
- Est. flood insurance / yr
- $507 – $1,088
Fire risk 3/10 · Minor
- Est. fire insurance / yr
- $498 – $926
Heat risk 3/10 · Minor
- Hot days now (above 93°F)
- 7 days/yr
- Hot days in 30 yrs
- 15 days/yr
Wind risk 1/10 · Minimal
- Chance of severe wind over 30 yrs
- —
Air-quality risk 10/10 · Severe
- Unhealthy air days now
- 14 days/yr
- Unhealthy air days in 30 yrs
- 16 days/yr
Risk factors via First Street. Map © Google.
Why this score? — see what drove the B grade
The composite is a weighted blend of 9 inputs, each scored 0–100. Each bar is that input's sub-score; the figure is the points it added to the 100-point composite (weight × sub-score).
- Cash flow +30.0/30.0
- 1% rule +10.0/10.0
- DSCR +10.0/10.0
- ARV discount +7.5/15.0
- Condition / age +4.0/5.0
- Livability +3.8/5.0
- Schools +3.2/10.0
- Rent growth +3.1/5.0
- Appreciation +0.0/10.0
$209,900
🖨 Deal sheet 📄 Offer letter ✓ Due diligence
Listing remarks
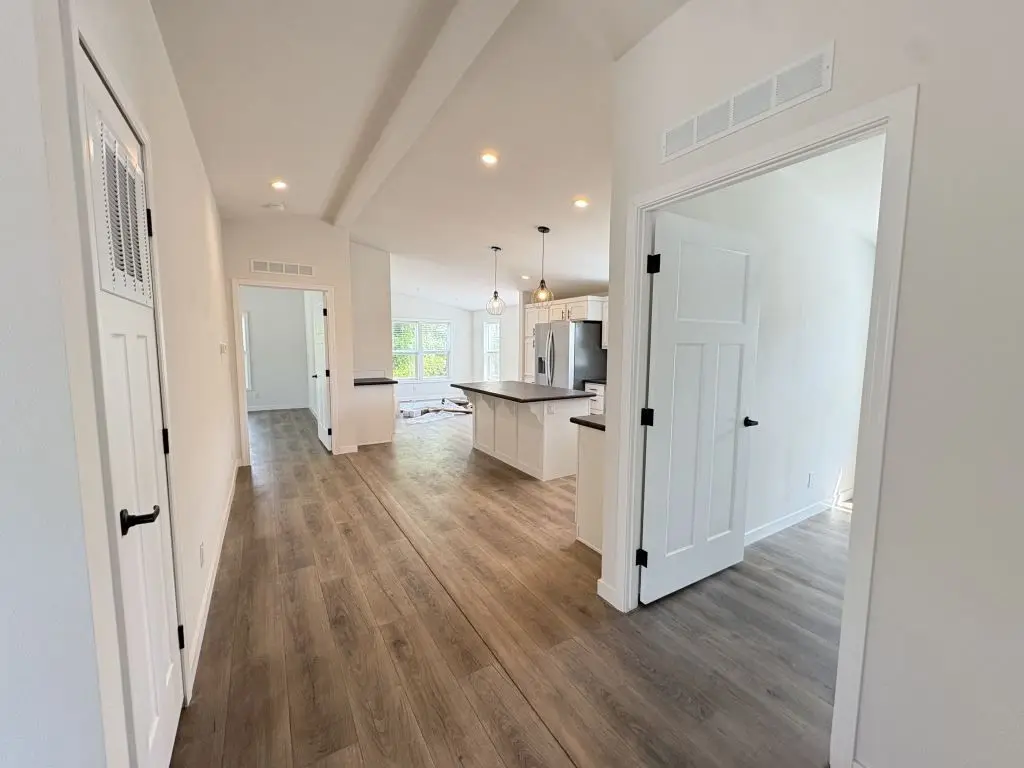
55+ age qualified community. COMING SOON! Currently under construction. Welcome to Shadowbrook, a 55+ age-qualified active and vibrant community, where your dream home is coming to life. We are excited to offer a modern brand new 2026 3 bed, 2 bath home for sale, featuring approximately 1500.80 sq ft of thoughtfully designed living space. Located in Clackamas, this soon-to-be-completed property will offer the perfect blend of modern design and timeless comfort. Construction is underway, and soon you'll be able to step inside and experience open-concept floor plan, high ceilings, natural light home has to offer. The spacious kitchen is beautifully designed with a kitchen island, stainless st
Key facts
- Spacious kitchen
- Kitchen island
- Listed 38 days
Tags
Property features AI
Finance
- Financial info: List price $199,900
Exterior
- Home design: Single-family plan home
- Exterior features: Located at 13640 SE Highway 212, Clackamas, OR 97015
Interior
- Bedrooms: 3 bedrooms
- Bathrooms: 2 bathrooms
- Interior features: Plan home (Canby plan)
Neighborhood map
What this means for you Summary
Snapshot
- This is a 3-bed/2.0-bath manufactured listed at $210k. Condition is rated good.
Deal economics
- At list price, monthly cash flow is $1k ($15k/yr) — positive.
- The deal already cash-flows at list — no discount required.
- Meets the 1% rule at list price ($2k rent vs $210k).
- Recommended offer: $204k (3.0% below list) — sets the bar for market timing.
- Cap rate 20.1% vs local median 2.5% in Happy Valley — top-decile yield for the area; either an underpriced asset or a hidden risk that comps aren't pricing in. Stress-test before assuming the spread holds.
Location & tenants
- Location reads 76/100 on livability (#76 in OR, #3,386 nationally) — a middle-class / working-renter tenant base. Strengths: employment A+, housing A+, crime A; Watch: amenities F, cost of living F.
- North Clackamas SD 12 (suburban): math 29% / reading 43% proficiency, ranked #22 of 58 in OR (top 38%) — families likely to look elsewhere, expect single-tenant / working-renter base with shorter leases.
- Market conditions: Rents rising (+2.5%/yr); 120 active listings in the ZIP; 9 comparable units currently listed for rent nearby; rentals at typical pace (median 24d on market — plan ~3-4 weeks tenant-placement turnaround); solid renter incomes; 946 units permitted in Clackamas County in 2024 (188 in 5+ unit buildings).
- This rent runs 34% of the median local income ($87k/yr) — at the standard rent-burdened threshold; future hikes will face affordability resistance.
Forward outlook
- Local home prices are declining (-3.0%/yr); year-one equity from $736 of loan paydown is wiped out by about $3k of value loss. Plan a longer hold.
- Clackamas County population projected at +25% by 2050 — long-run rental-demand tailwind backs the buy-and-hold thesis.
- At projected returns (-3.0% appreciation + 2.5% rent growth), your $30k cash investment doubles in ~3 years — after that, you're playing with house money.
Negotiation context
- It's been on market 38 days — a 3% lower offer ($204k) is reasonable based on typical stale-listing flexibility.
Questions for the listing agent
- It's been on market 38 days. Have you received any prior offers? Is the seller open to a 3% concession, seller financing, or rate buy-down credit?
- Is there a deadline driving the sale (1031 exchange, divorce, estate, relocation)? That informs how much negotiation room exists.
- Schools are A-rated — typically a magnet for longer-tenancy family renters. What's the average tenant stay here, and is there a school-zone premium baked into asking?
- What's the average days-on-market for RENTAL listings here right now (not sales)? A rising rental-DOM trend means longer vacancies and softer asking-rent achievability than the comps imply.
- What's the recent tenant-quality profile in this submarket — average credit score on applications, eviction rate, late-payment / NSF rate, and stable-employment percentage? A property-management company in the area should have these aggregated.
- How much new for-sale + rental construction is in the pipeline within 1–3 miles? Heavy new supply typically softens prices + rents 12–24 months out; constrained supply supports both.
Investment metrics
- 1% rule
- 2.33% ✓
- Cap rate
- 20.08%
- Cash-on-cash
- 49.22%
- DSCR
- 3.19
- GRM
- 3.6
CMA / ARV
- ARV (median comp)
- $106,500
- List price
- $209,900
- Delta
- 97.09%
- Verdict
- OVERPRICED
- Comps
- 20 within 1.0 mi
Show comp detail 12 sales within ~0.75 mi
| Address | Dist | Beds/Ba | Sqft | Sold | Price | $/sf | Match |
|---|---|---|---|---|---|---|---|
| 13640 SE Highway 212 #10 | 0.07mi | 2/2.0 (-1) | 1,440 (-4%) | 1mo | $100,000 | $69 | 84 |
| 13900 SE Highway 212 #62 | 0.11mi | 2/2.0 (-1) | 1,450 (-3%) | 4mo | $84,000 | $58 | 81 |
| 13640 SE Highway 212 #57 | 0.20mi | 3/2.0 | 1,566 (+4%) | 7mo | $159,500 | $102 | 77 |
| 13900 SE Highway 212 #31 | 0.18mi | 3/2.0 | 1,400 (-7%) | 9mo | $92,000 | $66 | 73 |
| 13900 SE Highway 212 #185 | 0.18mi | 3/2.0 | 1,296 (-14%) | 2mo | $145,000 | $112 | 67 |
| 15146 SE 122nd Ave | 0.68mi | 3/2.0 | 1,512 (+1%) | 0mo | $181,000 | $120 | 66 |
| 15174 SE 122nd Ave #87 | 0.68mi | 3/2.0 | 1,540 (+3%) | 1mo | $198,000 | $129 | 64 |
| 13640 SE Highway 212 #89 | 0.05mi | 2/2.0 (-1) | 1,300 (-13%) | 8mo | $40,000 | $31 | 64 |
| 13900 SE Hwy 212 #16 | 0.21mi | 3/2.0 | 1,296 (-14%) | 5mo | $105,000 | $81 | 63 |
| 16368 SE 135th Ave #10 | 0.37mi | 3/2.0 | 1,296 (-14%) | 2mo | $108,000 | $83 | 58 |
| 13640 SE Highway 212 #69 | 0.14mi | 2/2.0 (-1) | 1,296 (-14%) | 10mo | $105,200 | $81 | 57 |
| 15116 SE 122nd Ave #58 | 0.73mi | 3/2.0 | 1,344 (-10%) | 8mo | $130,000 | $97 | 42 |
Match score weights: distance 35% · size 25% · config 20% · recency 20%. Top-matched comps best support the ARV.
Projected returns pro-forma
-3.0% appreciation · 2.48% rent growth · sell at horizon
- IRR
- 46.3%
- Equity multiple
- 2.99×
- Total profit
- $59,396
- Equity at exit
- $15,879
- IRR
- 51.8%
- Equity multiple
- 5.93×
- Total profit
- $146,949
- Equity at exit
- $9,208
Cash invested: $29,820 (down + closing). Projections, not guarantees.
Landlord ↔ Tenant lean methodology
- Overall (STATE)
- 28 Tenant-Leaning
- State Oregon
- 28 Tenant-Leaning · D+6
- County
- — inherits STATE
- City
- — inherits STATE
ZIP-level market 97015
- Rents YoY
- 2.5%
- Active inventory
- 120
- Price-to-rent
- 7.1×
Monthly cashflow live
- Estimated rent
- $2,480 high interval (Pro) →
- Mortgage (P&I)
- −$558
- Tax est. 1.5%
- −$133 /mo · $1,598/yr
- Insurance
- −$44
- HOA
- −$0
- Vacancy / Maint / Mgmt
- −$521
- Net cashflow
- $1,223
Break-even live
UW: 25.0% down · 7.5% · 30yr · 1.5% tax · 5.0% vac · 8.0% maint · 8.0% mgmt
Financing live
Cash to close
- Down payment
- $26,625
- Closing costs
- $3,195
- Reserves months
- —
- Total cash needed
- —
Loan-product check · same deal, 3 products live
Conventional
25% down · 7.5% · 30yr
- Down + closing
- —
- Monthly P&I
- —
- Monthly cashflow
- —
- DSCR
- —
- Eligible?
- —
Personal DTI + credit; lowest rate.
DSCR
20% down · 8.5% · 30yr
- Down + closing
- —
- Monthly P&I
- —
- Monthly cashflow
- —
- DSCR
- —
- Eligible?
- —
No personal income docs; deal must DSCR.
Hard money
10% down · 12.0% · 12mo
- Down + closing
- —
- Monthly P&I
- —
- Monthly cashflow
- —
- DSCR
- —
- Eligible?
- —
Short-term bridge; refi at stabilization.
Rent comps 9 comps
| Address | Beds | Baths | Sqft | Rent | $/sqft | DOM | Units | Dist |
|---|---|---|---|---|---|---|---|---|
| 13300 SE Hubbard Rd Clackamas, OR | 3.0 | 1.0–2.0 | 818 | $2,290 | $2.80 | 2d | 6 | 0.40mi |
| 12301 SE Hubbard Rd Clackamas, OR | 2.0–3.0 | 1.0–2.0 | 936 | $2,063 | $2.20 | 10d | 4 | 0.80mi |
| 13898 SE Rogers Ln Clackamas, OR | 3.0 | 2.0 | 1488 | $2,599 | $1.75 | 43d | 1 | 0.91mi |
| 14439 SE Oregon Trail Dr Clackamas, OR | 3.0 | 2.0 | 1650 | $2,615 | $1.58 | 1d | 1 | 0.98mi |
| 14095 SE Summerfield Loop Happy Valley, OR | 3.0 | 2.5 | 1453 | $2,695 | $1.85 | 43d | 1 | 1.15mi |
| 14154 SE Summerfield Loop Unit 14194 Happy Valley, OR | 3.0 | 2.5 | 1125 | $2,250 | $2.00 | 24d | 1 | 1.28mi |
| 14194 SE Summerfield Loop Happy Valley, OR | 3.0 | 2.5 | 1125 | $2,250 | $2.00 | 24d | 1 | 1.28mi |
| 13120 SE 128th Ave Happy Valley, OR | 3.0 | 2.5 | 1861 | $2,900 | $1.56 | 43d | 1 | 1.37mi |
| 13777 SE 115th Ave Clackamas, OR | 3.0 | 3.0 | 2088 | $3,495 | $1.67 | 24d | 1 | 1.49mi |
Listing history 14 events
-
2026-06-18days on market $209,900 Active 38 DOM
-
2026-06-17days on market $209,900 Active 37 DOM
-
2026-06-16days on market $209,900 Active 36 DOM
-
2026-06-15days on market $209,900 Active 35 DOM
-
2026-06-13days on market $209,900 Active 33 DOM
-
2026-06-09days on market $209,900 Active 29 DOM
-
2026-06-08days on market $209,900 Active 28 DOM
-
2026-06-07days on market $209,900 Active 27 DOM
-
2026-06-05days on market $209,900 Active 24 DOM
-
2026-06-03days on market $209,900 Active 23 DOM
-
2026-06-02days on market $209,900 Active 22 DOM
-
2026-06-01days on market $209,900 Active 21 DOM
-
2026-05-31days on market $209,900 Active 20 DOM
-
2026-05-11$199,900 Active 1500-char remark
ⓘ Source: listings_history table (triggers on properties + properties_extension) + one-shot
backfill from property_details.listing_events for pre-trigger history.
Climate risk First Street
- Flood 1/10 Low FEMA zone X (unshaded) · 0% chance over 30 yrs
- Wildfire 3/10 Moderate
- Heat 3/10 Moderate 7 d/yr ≥93°F today · 15 d/yr by 30 yrs out
- Wind 1/10 Low
- Air quality 10/10 Extreme 14 unhealthy d/yr today · 16 by 30 yrs out
Nearby sold comps map
Loading sold comps map…
Walkable amenities ~0.75 mi
Loading nearby amenities…
Taxation est. · year 1
- Rental income
- $29,760
- − Mortgage interest
- −$5,966
- − Property taxes
- −$1,598
- − Insurance
- −$532
- − Repairs & maintenance
- −$2,381
- − Management
- −$2,381
- − Depreciation
- −$3,098
- Taxable income
- $13,805
- Est. tax owed @ 24.0%
- −$3,313
- After-tax cash flow
- $11,365/yr
For passive investors: Depreciation is non-cash, so a rental often shows a tax loss while cash-flowing — sheltering income. Rental losses are passive: they offset passive income freely, and up to $25,000/yr can offset ordinary (W-2) income if you actively participate and your MAGI is under $100k (phasing out to $0 by $150k); unused losses carry forward. On sale, claimed depreciation is recaptured at up to 25%, and gains may owe capital-gains tax (a 1031 exchange can defer both). Figures are a year-1 estimate at your 24.0% rate — not tax advice; consult a CPA.
Condition & rehab AI · 11 photos
This home is in excellent condition with a modern design and ample living space. It is move-in ready and has the potential for further value increases with minor updates.
Value-add opportunities
- Both Landscaping and curb appeal improvements — Enhances the home's curb appeal and can attract more buyers.
- Both Add smart home features — Improves convenience and can increase the home's value in the market.
- Both Add a smart thermostat — Enhances comfort and energy efficiency, which can increase the home's value.
- Both Add a smart security system — Enhances safety and can increase the home's value in the market.
Renovation cost estimate screening
Value-add ROI direction
- Both Landscaping and curb appeal improvements — Enhances the home's curb appeal and can attract more buyers. ↑
- Both Add smart home features — Improves convenience and can increase the home's value in the market. ↑
- Both Add a smart thermostat — Enhances comfort and energy efficiency, which can increase the home's value. ↑
- Both Add a smart security system — Enhances safety and can increase the home's value in the market. ↑
ⓘ Cost ranges are severity-bucket heuristics (US national rule-of-thumb). Get contractor quotes + a written scope before underwriting a rehab budget.
Schools (NCES district)
- District
- North Clackamas SD 12
- NCES district ID
- 4108830
- Math proficiency
- 29% ▼ -14.00%
- Reading proficiency
- 43% ▼ -13.00%
- Median HH income
- $60,217
- Composite
- 32.1/100
- National rank
- #5807
- State rank
- #22 of 58 in OR
Livability — Happy Valley
- Score
- 76/100
- State rank
- #76
- US rank
- #3386
Category grades
Schools grade is shown separately in the Schools card above.
Census & demographics
- County
- Clackamas County · 361,406 people
- City population
- 34,567
- Metro
- Portland-Vancouver-Hillsboro, OR-WA
- Population (ZIP)
- 24,433
- Household income
- $87,333
- Rent vs Own
- Severe rent burden
- 1166.0
Population outlook (Clackamas County) Hauer SSP2
- Today (2025)
- 458,456 people
- By 2030
- 485,185 · +5.8%
- By 2040
- 532,932 · +16.2%
- By 2050
- 574,445 · +25.3%
- By 2075
- 665,497 · +45.2%
- By 2100
- 697,488 · +52.1%
Race, ethnicity, and origin ACS 2023
- Neighborhood character
- Predominantly White (66%)
- Race & ethnicity
- White 66% Hispanic / Latino 15% Two or more races 12% Asian 11% Black 2%
- Hispanic origin (detail)
- Mexican 13%
- Common ancestry
- Italian 4% Scotch-Irish 4% Lithuanian 3%
- Foreign-born
- 15% · Canada, China, Vietnam
- Languages at home
- 74% English-only · Spanish 11% Chinese 5% Russian/Polish/Slavic 3%
Political lean MEDSL · Clackamas
- 2024 margin
- Lean D (+9.7) · D 53.4% · R 43.6% · Other 3.0%
- 2008→2024 swing
- -0.6pp no change · 2008: 10.4pp · 2024: 9.7pp
- All cycles
- 2024: D+9.7 2020: D+11.1 2016: D+6.1 2012: D+3.5 2008: D+10.4
Not yet ingested
- Civics
- —
Market trends
- HPI YoY
- ▼ -170.50%
- Current HPI
- 295.7295
- Rent YoY
- ▲ 2.48%
- Metro
- Portland-Vancouver-Hillsboro, OR-WA
- State GDP YoY
- ▲ 2.05%
- F500 in state
- 2
Industry mix (Fortune 500 HQ in OR)
| Industry | F500 HQs | Revenue |
|---|---|---|
| Consumer Goods | 1 | $51B |
|
||
Cash-flow waterfall
monthlySold comps — $/sqft
last 12 mo · ≤1 miLoading sold comps…