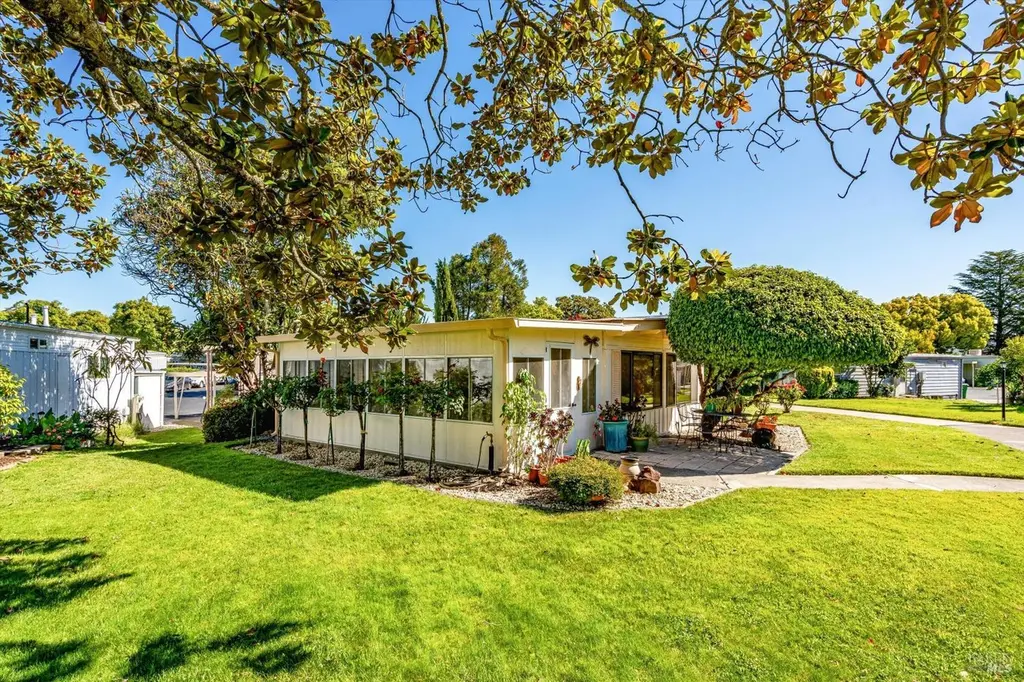
158 Chiquita Camino · Sonoma, CA
Flood risk 9/10 · Severe
- FEMA flood zone
- X (unshaded)
- Chance of flooding over 30 yrs
- 0.99%
- Est. flood insurance / yr
- $507 – $1,088
Fire risk 6/10 · Moderate
- Est. fire insurance / yr
- $659 – $1,223
Heat risk 4/10 · Minor
- Hot days now (above 95°F)
- 7 days/yr
- Hot days in 30 yrs
- 14 days/yr
Wind risk 1/10 · Minimal
- Chance of severe wind over 30 yrs
- —
Air-quality risk 9/10 · Severe
- Unhealthy air days now
- 19 days/yr
- Unhealthy air days in 30 yrs
- 19 days/yr
Risk factors via First Street. Map © Google.
Why this score? — see what drove the B- grade
The composite is a weighted blend of 9 inputs, each scored 0–100. Each bar is that input's sub-score; the figure is the points it added to the 100-point composite (weight × sub-score).
- Cash flow +30.0/30.0
- 1% rule +10.0/10.0
- DSCR +10.0/10.0
- Condition / age +4.0/5.0
- Livability +3.7/5.0
- Schools +3.4/10.0
- ARV discount +2.8/15.0
- Rent growth +2.7/5.0
- Appreciation +0.0/10.0
$160,000
🖨 Deal sheet 📄 Offer letter ✓ Due diligence
Listing remarks
158 Chiquita Camino, located in the Moon Valley Residential Community. A calm, well-kept community nestled in a peaceful natural setting. This 2-bedroom, 2-bath home features large windows that fill the space with natural light, creating a bright and inviting atmosphere. New flooring throughout adds a fresh touch and enhances the home's comfortable layout. Perfectly positioned within the community, this home provides a peaceful and private setting while being only moments from all that Sonoma has to offer, including boutique shopping, acclaimed dining, celebrated wineries, scenic hiking trails, and the historic Sonoma Plaza. An exceptional opportunity to enjoy living in one of the community
Key facts
- Large windows
- Scenic hiking trails
- New flooring
Tags
Property features AI
Finance
- Financial info: Land lease: No; Land lease amount listed separately
- HOA & community: No homeowners association; Located in Sonoma area; Moon Valley Residential Community park
Exterior
- Parking: Covered parking (1 space)
- Utilities: Public sewer; No on-site power production
- Home design: Manufactured in park (double wide)
- Construction: Roadliner make; Dualwide manufacturer; Aluminum skirting
- Exterior features: Enclosed patio
Interior
- Bedrooms: 2 bedrooms
- Flooring: Laminate
- Bathrooms: 2 full bathrooms; Shower stall(s)
- Heating & cooling: Central heating; No cooling
- Interior features: Laminate flooring; Stacked washer/dryer included
- Laundry & utility: Stacked washer/dryer included
Neighborhood map
What this means for you Summary
Snapshot
- This is a 2-bed/2.0-bath manufactured listed at $160k. Condition is rated good.
Deal economics
- At list price, monthly cash flow is $1k ($17k/yr) — positive.
- The deal already cash-flows at list — no discount required.
- Meets the 1% rule at list price ($3k rent vs $160k).
- Recommended offer: $158k (1.5% below list) — sets the bar for market timing.
- Cap rate 17.2% vs local median 1.4% in Sonoma — top-decile yield for the area; either an underpriced asset or a hidden risk that comps aren't pricing in. Stress-test before assuming the spread holds.
Location & tenants
- Location reads 74/100 on livability (#146 in CA, #4,943 nationally) — a middle-class / working-renter tenant base. Strengths: amenities A+, employment A+, health & safety A+; Watch: commute F, cost of living F.
- Sonoma Valley Unified (town): math 27% / reading 42% proficiency, ranked #849 of 1,400 in CA (top 61%) — families likely to look elsewhere, expect single-tenant / working-renter base with shorter leases.
- Market conditions: Rents flat; 263 active listings in the ZIP; 16 comparable units currently listed for rent nearby; rentals at typical pace (median 24d on market — plan ~3-4 weeks tenant-placement turnaround); solid renter incomes; 1,039 units permitted in Sonoma County in 2024 (185 in 5+ unit buildings).
- This rent runs 37% of the median local income ($105k/yr) — at the standard rent-burdened threshold; future hikes will face affordability resistance.
Forward outlook
- Local home prices are declining (-3.0%/yr); year-one equity from $1k of loan paydown is wiped out by about $5k of value loss. Plan a longer hold.
- Sonoma County population projected at +8% by 2050 — modest demand growth; plan on rents tracking national, not racing it.
- At projected returns (-3.0% appreciation + 0.8% rent growth), your $45k cash investment doubles in ~4 years — after that, you're playing with house money.
Negotiation context
- It's been on market 30 days — a 2% lower offer ($158k) is reasonable based on typical stale-listing flexibility.
Risks & watch-outs
- Watch-outs: flood insurance adds $66/mo.
- Climate carrying-cost: severe flood risk; major wildfire risk — expect insurance premiums to compound above CPI over the hold.
Questions for the listing agent
- Built in 1966 — when were the roof, HVAC, electrical panel, plumbing, and water heater last replaced?
- What's the actual annual flood-insurance premium (NFIP or private), and is the property in a SFHA with mandatory coverage?
- Is there a deadline driving the sale (1031 exchange, divorce, estate, relocation)? That informs how much negotiation room exists.
- What's the average days-on-market for RENTAL listings here right now (not sales)? A rising rental-DOM trend means longer vacancies and softer asking-rent achievability than the comps imply.
- What's the recent tenant-quality profile in this submarket — average credit score on applications, eviction rate, late-payment / NSF rate, and stable-employment percentage? A property-management company in the area should have these aggregated.
- How much new for-sale + rental construction is in the pipeline within 1–3 miles? Heavy new supply typically softens prices + rents 12–24 months out; constrained supply supports both.
Investment metrics
- 1% rule
- 2.03% ✓
- Cap rate
- 17.21%
- Cash-on-cash
- 38.99%
- DSCR
- 2.73
- GRM
- 4.1
CMA / ARV
- ARV (on-the-fly)
- $145,000
- Comps found
- 9
Show comp detail 9 sales within ~0.75 mi
| Address | Dist | Beds/Ba | Sqft | Sold | Price | $/sf | Match |
|---|---|---|---|---|---|---|---|
| 122 Paseo Palencia | 0.08mi | 2/2.0 | 1,000 (0%) | 9mo | $215,000 | $215 | 89 |
| 298 La Serena Dr | 0.08mi | 2/2.0 | 1,000 (0%) | 10mo | $145,000 | $145 | 88 |
| 270 Manuella Ln | 0.09mi | 2/2.0 | 1,040 (+4%) | 2mo | $160,000 | $154 | 88 |
| 160 Chiquita Camino | 0.04mi | 2/2.0 | 1,120 (+12%) | 1mo | $199,000 | $178 | 77 |
| 341 El Castillo Vista Way #341 | 0.10mi | 2/2.0 | 1,080 (+8%) | 10mo | $199,000 | $184 | 74 |
| 154 Chiquita Camino | 0.05mi | 2/1.0 | 900 (-10%) | 8mo | $78,000 | $87 | 71 |
| 148 Chiquita Camino | 0.05mi | 2/2.0 | 1,140 (+14%) | 11mo | $140,000 | $123 | 65 |
| 219 Cazares Cir | 0.04mi | 2/2.0 | 1,100 (+10%) | 21mo | $75,000 | $68 | 64 |
| 312 Janero Pl | 0.16mi | 2/2.0 | 1,150 (+15%) | 17mo | $115,000 | $100 | 54 |
Match score weights: distance 35% · size 25% · config 20% · recency 20%. Top-matched comps best support the ARV.
Projected returns pro-forma
-3.0% appreciation · 0.79% rent growth · sell at horizon
- IRR
- 30.5%
- Equity multiple
- 2.24×
- Total profit
- $55,579
- Equity at exit
- $23,857
- IRR
- 36.5%
- Equity multiple
- 4.01×
- Total profit
- $134,991
- Equity at exit
- $13,834
Cash invested: $44,800 (down + closing). Projections, not guarantees.
Landlord ↔ Tenant lean methodology
- Overall (STATE)
- 18 Strongly Tenant-Friendly
- State California
- 18 Strongly Tenant-Friendly · D+13
- County
- — inherits STATE
- City
- — inherits STATE
ZIP-level market 95476
- Rents YoY
- 0.8%
- Active inventory
- 263
- Price-to-rent
- 4.1×
Monthly cashflow live
- Estimated rent
- $3,242 high interval (Pro) →
- Mortgage (P&I)
- −$839
- Tax est. 1.5%
- −$200 /mo · $2,400/yr
- Insurance
- −$67
- Flood insurance flood zone
- −$66 /mo · $798/yr
- HOA
- −$0
- Vacancy / Maint / Mgmt
- −$681
- Net cashflow
- $1,389
Break-even live
UW: 25.0% down · 7.5% · 30yr · 1.5% tax · 5.0% vac · 8.0% maint · 8.0% mgmt
Financing live
Cash to close
- Down payment
- $40,000
- Closing costs
- $4,800
- Reserves months
- —
- Total cash needed
- —
Loan-product check · same deal, 3 products live
Conventional
25% down · 7.5% · 30yr
- Down + closing
- —
- Monthly P&I
- —
- Monthly cashflow
- —
- DSCR
- —
- Eligible?
- —
Personal DTI + credit; lowest rate.
DSCR
20% down · 8.5% · 30yr
- Down + closing
- —
- Monthly P&I
- —
- Monthly cashflow
- —
- DSCR
- —
- Eligible?
- —
No personal income docs; deal must DSCR.
Hard money
10% down · 12.0% · 12mo
- Down + closing
- —
- Monthly P&I
- —
- Monthly cashflow
- —
- DSCR
- —
- Eligible?
- —
Short-term bridge; refi at stabilization.
Rent comps 16 comps
| Address | Beds | Baths | Sqft | Rent | $/sqft | DOM | Units | Dist |
|---|---|---|---|---|---|---|---|---|
| 790 2nd St W Sonoma, CA | 1.0–2.0 | 1.0–1.5 | 975 | $2,660 | $2.73 | 14d | 3 | 0.54mi |
| 655 W Spain St Sonoma, CA | 2.0 | 2.5 | 1349 | $3,525 | $2.61 | 14d | 1 | 0.61mi |
| 663 Spring Ln Sonoma, CA | 2.0 | 1.0 | 1050 | $3,200 | $3.05 | 44d | 1 | 0.64mi |
| 434 Bernice Ln Unit 1546207P Sonoma, CA | 2.0 | 2.0 | 979 | $4,564 | $4.66 | 14d | 1 | 0.65mi |
| 208 Todd Ave Sonoma, CA | 3.0 | 2.5 | 1384 | $3,800 | $2.75 | 14d | 1 | 0.65mi |
| 1211 Broadway Unit 1213 Sonoma, CA | 2.0 | 2.5 | 1200 | $3,600 | $3.00 | 23d | 1 | 0.70mi |
| 342 Church St Sonoma, CA | 1.0 | 1.0 | 700 | $2,600 | $3.71 | 44d | 1 | 0.70mi |
| 1207 Broadway Unit 1209 Sonoma, CA | 2.0 | 2.5 | 1200 | $3,750 | $3.12 | 44d | 1 | 0.70mi |
| 1207 Broadway Sonoma, CA | 2.0 | 2.5 | 1200 | $3,600 | $3.00 | 23d | 1 | 0.70mi |
| 340 Church St Sonoma, CA | 3.0 | 2.5 | 1282 | $3,750 | $2.93 | 44d | 1 | 0.71mi |
| 210 Tuscany Pl Sonoma, CA | 1.0–2.0 | 1.0–2.0 | 1200 | $2,750 | $2.29 | 14d | 1 | 0.90mi |
| 21 Ramon St Sonoma, CA | 2.0 | 2.0 | 1440 | $2,250 | $1.56 | 23d | 1 | 1.00mi |
| 19019 5th St W Sonoma, CA | 3.0 | 2.0 | 1286 | $3,400 | $2.64 | 14d | 1 | 1.14mi |
| 336 Las Casitas Ct Sonoma, CA | 2.0 | 1.5 | 1158 | $2,500 | $2.16 | 44d | 1 | 1.23mi |
| 126 Blue Wing Dr Sonoma, CA | 2.0 | 2.0 | 1156 | $2,975 | $2.57 | 14d | 2 | 1.29mi |
| 126 Blue Wing Dr #11 Sonoma, CA | 2.0 | 2.0 | 1156 | $3,200 | $2.77 | 14d | 1 | 1.30mi |
Listing history 17 events
-
2026-06-18days on market $160,000 Active 30 DOM
-
2026-06-17days on market $160,000 Active 29 DOM
-
2026-06-16days on market $160,000 Active 28 DOM
-
2026-06-15days on market $160,000 Active 27 DOM
-
2026-06-14days on market $160,000 Active 25 DOM
-
2026-06-13days on market $160,000 Active 24 DOM
-
2026-06-10days on market $160,000 Active 22 DOM
-
2026-06-09days on market $160,000 Active 21 DOM
-
2026-06-08days on market $160,000 Active 20 DOM
-
2026-06-07days on market $160,000 Active 19 DOM
-
2026-06-05days on market $160,000 Active 16 DOM
-
2026-06-03days on market $160,000 Active 15 DOM
-
2026-06-02days on market $160,000 Active 14 DOM
-
2026-06-01days on market $160,000 Active 13 DOM
-
2026-05-31days on market $160,000 Active 12 DOM
-
2026-05-30days on market $160,000 Active 11 DOM
-
2026-05-19$160,000 Active
ⓘ Source: listings_history table (triggers on properties + properties_extension) + one-shot
backfill from property_details.listing_events for pre-trigger history.
Climate risk First Street
- Flood 9/10 Extreme FEMA zone X (unshaded) · 99% chance over 30 yrs
- Wildfire 6/10 Major
- Heat 4/10 Moderate 7 d/yr ≥95°F today · 14 d/yr by 30 yrs out
- Wind 1/10 Low
- Air quality 9/10 Extreme 19 unhealthy d/yr today · 19 by 30 yrs out
Nearby sold comps map
Loading sold comps map…
Walkable amenities ~0.75 mi
Loading nearby amenities…
Taxation est. · year 1
- Rental income
- $38,905
- − Mortgage interest
- −$8,962
- − Property taxes
- −$2,400
- − Insurance
- −$1,598
- − Repairs & maintenance
- −$3,112
- − Management
- −$3,112
- − Depreciation
- −$4,655
- Taxable income
- $15,066
- Est. tax owed @ 24.0%
- −$3,616
- After-tax cash flow
- $13,053/yr
For passive investors: Depreciation is non-cash, so a rental often shows a tax loss while cash-flowing — sheltering income. Rental losses are passive: they offset passive income freely, and up to $25,000/yr can offset ordinary (W-2) income if you actively participate and your MAGI is under $100k (phasing out to $0 by $150k); unused losses carry forward. On sale, claimed depreciation is recaptured at up to 25%, and gains may owe capital-gains tax (a 1031 exchange can defer both). Figures are a year-1 estimate at your 24.0% rate — not tax advice; consult a CPA.
Condition & rehab AI · 30 photos
This home is in good condition with fresh updates and a well-maintained exterior, making it a great investment opportunity.
Value-add opportunities
- Resale Paint exterior siding — Enhances curb appeal and home value.
- Rental Trim and prune bushes — Maintains a well-maintained appearance for tenants.
Renovation cost estimate screening
Value-add ROI direction
- Resale Paint exterior siding — Enhances curb appeal and home value. ↑
- Rental Trim and prune bushes — Maintains a well-maintained appearance for tenants. ↑
ⓘ Cost ranges are severity-bucket heuristics (US national rule-of-thumb). Get contractor quotes + a written scope before underwriting a rehab budget.
Schools (NCES district)
- District
- Sonoma Valley Unified
- NCES district ID
- 0637200
- Math proficiency
- 27% ▼ -1.00%
- Reading proficiency
- 42% ▲ 1.00%
- Median HH income
- $63,880
- Composite
- 33.88/100
- National rank
- #10355
- State rank
- #849 of 1400 in CA
Livability — Sonoma
- Score
- 74/100
- State rank
- #146
- US rank
- #4943
Category grades
Schools grade is shown separately in the Schools card above.
Census & demographics
- Census place
- Sonoma, CA
- County
- Sonoma County · 449,805 people
- City population
- 35,196
- Metro
- Santa Rosa-Petaluma, CA
- Population (ZIP)
- 35,196
- Household income
- $105,374
- Rent vs Own
- Severe rent burden
- 1218.0
Population outlook (Sonoma County) Hauer SSP2
- Today (2025)
- 539,935 people
- By 2030
- 554,870 · +2.8%
- By 2040
- 573,262 · +6.2%
- By 2050
- 580,715 · +7.6%
- By 2075
- 579,229 · +7.3%
- By 2100
- 547,835 · +1.5%
Race, ethnicity, and origin ACS 2023
- Neighborhood character
- Predominantly White (66%)
- Race & ethnicity
- White 66% Hispanic / Latino 28% Two or more races 13% Asian 2% Black 1%
- Hispanic origin (detail)
- Mexican 23%
- Common ancestry
- Italian 5% Lithuanian 4% Portuguese 3%
- Foreign-born
- 16% · Canada, Dominican Republic
- Languages at home
- 75% English-only · Spanish 21% Other Indo-European 1% Other Asian/Pacific 0%
Political lean MEDSL · Sonoma
- 2024 margin
- Solid D (+46.2) · D 71.4% · R 25.2% · Other 3.3%
- 2008→2024 swing
- -3.4pp toward R · 2008: 49.6pp · 2024: 46.2pp
- All cycles
- 2024: D+46.2 2020: D+51.5 2016: D+47.9 2012: D+44.9 2008: D+49.6
Not yet ingested
- Civics
- —
Market trends
- HPI YoY
- ▼ -1116.03%
- Current HPI
- 236.6408
- Rent YoY
- ▲ 0.79%
- Metro
- Santa Rosa-Petaluma, CA
- State GDP YoY
- ▲ 3.21%
- F500 in state
- 116
Industry mix (Fortune 500 HQ in CA)
| Industry | F500 HQs | Revenue |
|---|---|---|
| Technology | 27 | $1,492B |
|
||
| Financial Services | 3 | $174B |
|
||
| Retail | 3 | $44B |
|
||
| Insurance | 3 | $26B |
|
||
| Media / Entertainment | 2 | $115B |
|
||
| Pharmaceuticals / Biotech | 2 | $62B |
|
||
Price history
1 event — show timeline
- 2026-05-19 Listed $160,000 BAREIS
Cash-flow waterfall
monthlySold comps — $/sqft
last 12 mo · ≤1 miLoading sold comps…