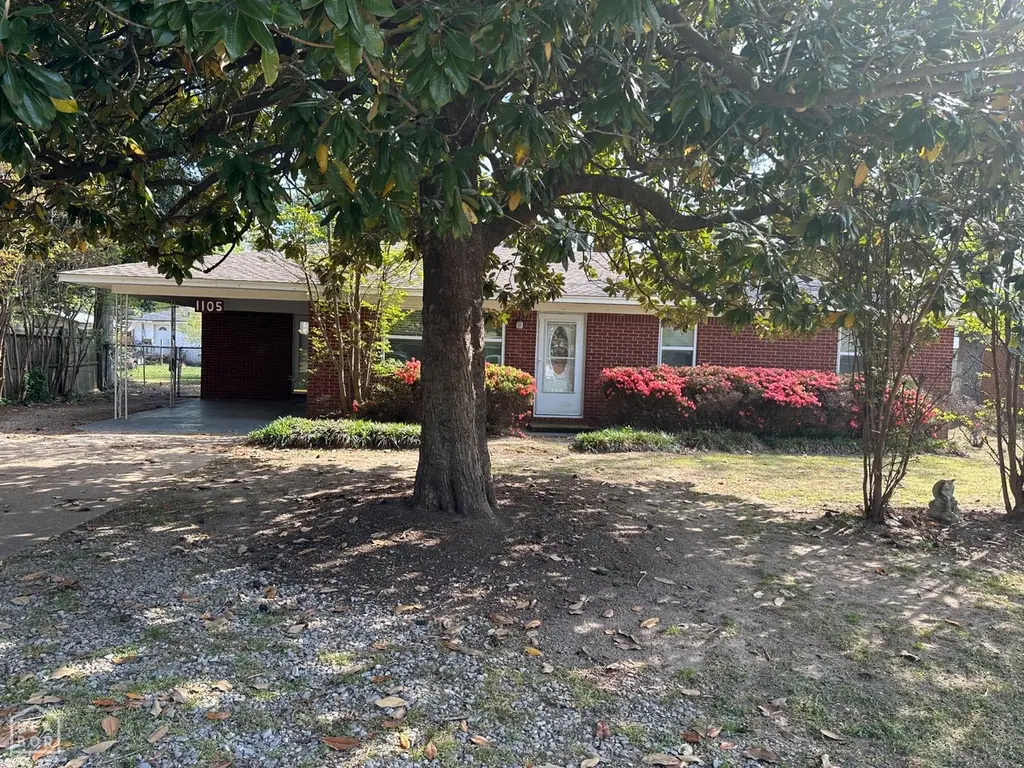
1105 Estelle · Lake City, AR
Flood risk 1/10 · Minimal
- FEMA flood zone
- X
- Chance of flooding over 30 yrs
- 0.0%
- Est. flood insurance / yr
- $507 – $1,088
Fire risk 1/10 · Minimal
- Est. fire insurance / yr
- $1,499 – $2,785
Heat risk 6/10 · Moderate
- Hot days now (above 109°F)
- 7 days/yr
- Hot days in 30 yrs
- 22 days/yr
Wind risk 4/10 · Minor
- Chance of severe wind over 30 yrs
- 8.0%
Air-quality risk 1/10 · Minimal
- Unhealthy air days now
- 0 days/yr
- Unhealthy air days in 30 yrs
- 0 days/yr
Risk factors via First Street. Map © Google.
Why this score? — see what drove the C+ grade
The composite is a weighted blend of 9 inputs, each scored 0–100. Each bar is that input's sub-score; the figure is the points it added to the 100-point composite (weight × sub-score).
- Cash flow +24.0/30.0
- Appreciation +10.0/10.0
- DSCR +7.7/10.0
- 1% rule +5.2/10.0
- ARV discount +4.3/15.0
- Livability +3.2/5.0
- Schools +3.1/10.0
- Rent growth +2.5/5.0
- Condition / age +2.5/5.0
$154,900
🖨 Deal sheet 📄 Offer letter ✓ Due diligence
Listing remarks MLS
Ready to move into, this is his families home and he has lived there for years and had been putting new features like shingles, central heat and air, stove, flooring. He has put new doors and new windows so that this home is one of the best in the neighborhood. see it before it's gone. New price
Key facts
- New doors
- New flooring
- Updated home
Tags
Neighborhood map
What this means for you Summary
Snapshot
- This is a 3-bed/1.0-bath single-family listed at $155k.
Deal economics
- At list price, monthly cash flow is $303 ($4k/yr) — positive.
- The deal already cash-flows at list — no discount required.
- Meets the 1% rule at list price ($2k rent vs $155k).
- Cap rate 8.6% vs local median 5.2% in Lake City — top-decile yield for the area; either an underpriced asset or a hidden risk that comps aren't pricing in. Stress-test before assuming the spread holds.
Location & tenants
- Location reads 64/100 on livability (#180 in AR) — a middle-class / working-renter tenant base. Strengths: cost of living A+, housing A+, crime A; Watch: schools D, amenities F, commute F.
- Riverside School District (rural): math 32% / reading 42% proficiency, ranked #103 of 238 in AR (top 43%) — families likely to look elsewhere, expect single-tenant / working-renter base with shorter leases.
- Market conditions: 35 active listings in the ZIP; 1 comparable units currently listed for rent nearby; 926 units permitted in Craighead County in 2024 (69 in 5+ unit buildings).
Forward outlook
- In year one you build about $17k of equity ($1k loan paydown + $15k appreciation (10.0% local appreciation)).
- Craighead County population projected at +38% by 2050 — long-run rental-demand tailwind backs the buy-and-hold thesis.
- At projected returns (10.0% appreciation + 3.0% rent growth), your $43k cash investment doubles in ~3 years — after that, you're playing with house money.
- By year 3, paydown + projected appreciation supports a ~$42k cash-out refi (75% LTV) — recoverable capital for the next deal without selling this one.
Negotiation context
- Only 14 days on market — expect competitive offers; lowballing is unlikely to land.
Risks & watch-outs
- Climate carrying-cost: extreme-heat days projected 7→22/yr by 2055 (HVAC capex compounding) — expect insurance premiums to compound above CPI over the hold.
Questions for the listing agent
- Is there a deadline driving the sale (1031 exchange, divorce, estate, relocation)? That informs how much negotiation room exists.
- Schools are D-rated, which usually means shorter tenancies and higher turnover. Who's the typical renter profile here, and what's been the actual vacancy rate?
- What's the average days-on-market for RENTAL listings here right now (not sales)? A rising rental-DOM trend means longer vacancies and softer asking-rent achievability than the comps imply.
- What's the recent tenant-quality profile in this submarket — average credit score on applications, eviction rate, late-payment / NSF rate, and stable-employment percentage? A property-management company in the area should have these aggregated.
- How much new for-sale + rental construction is in the pipeline within 1–3 miles? Heavy new supply typically softens prices + rents 12–24 months out; constrained supply supports both.
Investment metrics
- 1% rule
- 1.02% ✓
- Cap rate
- 8.64%
- Cash-on-cash
- 8.37%
- DSCR
- 1.37
- GRM
- 8.2
CMA / ARV
- ARV (median comp)
- $144,598
- List price
- $154,900
- Delta
- 7.12%
- Verdict
- FAIR
- Comps
- 20 within 1.0 mi
Show comp detail 12 sales within ~0.75 mi
| Address | Dist | Beds/Ba | Sqft | Sold | Price | $/sf | Match |
|---|---|---|---|---|---|---|---|
| 1003 Sixth | 0.26mi | 3/2.0 | 1,300 (-1%) | 2mo | $219,000 | $168 | 80 |
| 1003 Sixth | 0.31mi | 3/2.0 | 1,300 (-1%) | 2mo | $219,000 | $168 | 78 |
| 1102 Estelle | 0.03mi | 3/1.0 | 1,121 (-15%) | 2mo | $145,000 | $129 | 73 |
| 204 Catfish Dr | 0.18mi | 3/2.0 | 1,161 (-12%) | 1mo | $167,500 | $144 | 68 |
| 806 Ladd | 0.56mi | 4/1.0 (+1) | 1,325 (+1%) | 2mo | $130,000 | $98 | 65 |
| 1997 Teal Cv | 0.71mi | 3/2.0 | 1,263 (-4%) | 2mo | $194,000 | $154 | 55 |
| 2001 Mallard Dr | 0.71mi | 3/2.0 | 1,339 (+2%) | 7mo | $212,500 | $159 | 54 |
| 106 Stone | 0.58mi | 3/1.0 | 1,160 (-12%) | 2mo | $121,400 | $105 | 52 |
| 1009 Opal Cir | 0.56mi | 3/1.0 | 1,121 (-15%) | 4mo | $133,900 | $119 | 46 |
| 100 Dennis St | 0.57mi | 3/2.0 | 1,172 (-11%) | 8mo | $150,000 | $128 | 45 |
| 911 Grimes St | 0.61mi | 3/1.0 | 1,121 (-15%) | 10mo | $85,000 | $76 | 39 |
| 106 Waterfowl | 0.69mi | 4/2.0 (+1) | 1,435 (+9%) | 8mo | $238,000 | $166 | 36 |
Match score weights: distance 35% · size 25% · config 20% · recency 20%. Top-matched comps best support the ARV.
Projected returns pro-forma
9.97% appreciation · 3.0% rent growth · sell at horizon
- IRR
- 30.3%
- Equity multiple
- 3.38×
- Total profit
- $103,237
- Equity at exit
- $139,179
- IRR
- 26.3%
- Equity multiple
- 7.66×
- Total profit
- $288,654
- Equity at exit
- $299,755
Cash invested: $43,372 (down + closing). Projections, not guarantees.
Landlord ↔ Tenant lean methodology
- Overall (STATE)
- 92 Strongly Landlord-Friendly
- State Arkansas
- 92 Strongly Landlord-Friendly · R+14
- County
- — inherits STATE
- City
- — inherits STATE
ZIP-level market 72437
- Home prices YoY
- 3.5%
- Active inventory
- 35
- Price-to-rent
- 8.2×
Monthly cashflow live
- Estimated rent
- $1,575 medium interval (Pro) →
- Mortgage (P&I)
- −$812
- Tax from tax record
- −$65 /mo · $777/yr
- Insurance
- −$65
- HOA
- −$0
- Vacancy / Maint / Mgmt
- −$331
- Net cashflow
- $303
Break-even live
UW: 25.0% down · 7.5% · 30yr · 1.5% tax · 5.0% vac · 8.0% maint · 8.0% mgmt
Financing live
Cash to close
- Down payment
- $38,725
- Closing costs
- $4,647
- Reserves months
- —
- Total cash needed
- —
Loan-product check · same deal, 3 products live
Conventional
25% down · 7.5% · 30yr
- Down + closing
- —
- Monthly P&I
- —
- Monthly cashflow
- —
- DSCR
- —
- Eligible?
- —
Personal DTI + credit; lowest rate.
DSCR
20% down · 8.5% · 30yr
- Down + closing
- —
- Monthly P&I
- —
- Monthly cashflow
- —
- DSCR
- —
- Eligible?
- —
No personal income docs; deal must DSCR.
Hard money
10% down · 12.0% · 12mo
- Down + closing
- —
- Monthly P&I
- —
- Monthly cashflow
- —
- DSCR
- —
- Eligible?
- —
Short-term bridge; refi at stabilization.
Rent comps 1 comps
| Address | Beds | Baths | Sqft | Rent | $/sqft | DOM | Units | Dist |
|---|---|---|---|---|---|---|---|---|
| 1997 Teal Cv Lake City, AR | 3.0 | 2.0 | 1263 | $1,575 | $1.25 | 43d | 1 | 0.70mi |
Listing history 17 events
-
2026-06-19days on market $154,900 Active 14 DOM
-
2026-06-18days on market $154,900 Active 13 DOM
-
2026-06-17days on market $154,900 Active 12 DOM
-
2026-06-16days on market $154,900 Active 11 DOM
-
2026-06-15days on market $154,900 Active 10 DOM
-
2026-06-14days on market $154,900 Active 8 DOM
-
2026-06-12statusdays on market $154,900 Active 7 DOM
-
2026-06-09days on market $154,900 New Listing 4 DOM
-
2026-06-08days on market $154,900 New Listing 3 DOM
-
2026-06-07remarks 699-char remark
-
2026-06-07statusdays on market $154,900 New Listing 2 DOM
-
2026-05-31days on market $154,900 Active 99 DOM
-
2026-05-31days on market $154,900 Active 98 DOM
-
2026-05-11price $154,900 296-char remark
Show marketing remark (296 chars)
Ready to move into, this is his families home and he has lived there for years and had been putting new features like shingles, central heat and air, stove, flooring. He has put new doors and new windows so that this home is one of the best in the neighborhood. see it before it's gone. New price
-
2026-04-16price $157,000 296-char remark
Show marketing remark (296 chars)
Ready to move into, this is his families home and he has lived there for years and had been putting new features like shingles, central heat and air, stove, flooring. He has put new doors and new windows so that this home is one of the best in the neighborhood. see it before it's gone. New price
-
2026-03-11price $159,500 296-char remark
Show marketing remark (296 chars)
Ready to move into, this is his families home and he has lived there for years and had been putting new features like shingles, central heat and air, stove, flooring. He has put new doors and new windows so that this home is one of the best in the neighborhood. see it before it's gone. New price
-
2026-02-22$169,500 Active 296-char remark
Show marketing remark (296 chars)
Ready to move into, this is his families home and he has lived there for years and had been putting new features like shingles, central heat and air, stove, flooring. He has put new doors and new windows so that this home is one of the best in the neighborhood. see it before it's gone. New price
ⓘ Source: listings_history table (triggers on properties + properties_extension) + one-shot
backfill from property_details.listing_events for pre-trigger history.
Tax reassessment forecast AR · Resets to sale price
- Current annual tax
- $777 · $65/mo
- Projected year-2 tax
- $991 · $83/mo
- Expected delta
- +$214/yr (+$18/mo · 27.6%)
ⓘ Screening estimate from a state-policy table — verify with the county assessor before closing.
Climate risk First Street
- Flood 1/10 Low FEMA zone X · 0% chance over 30 yrs
- Wildfire 1/10 Low
- Heat 6/10 Major 7 d/yr ≥109°F today · 22 d/yr by 30 yrs out
- Wind 4/10 Moderate 8% chance of damaging wind over 30 yrs
- Air quality 1/10 Low 0 unhealthy d/yr today · 0 by 30 yrs out
Nearby sold comps map
Loading sold comps map…
Walkable amenities ~0.75 mi
Loading nearby amenities…
Taxation est. · year 1
- Rental income
- $18,900
- − Mortgage interest
- −$8,677
- − Property taxes
- −$777
- − Insurance
- −$774
- − Repairs & maintenance
- −$1,512
- − Management
- −$1,512
- − Depreciation
- −$4,506
- Taxable income
- $1,141
- Est. tax owed @ 24.0%
- −$274
- After-tax cash flow
- $3,358/yr
For passive investors: Depreciation is non-cash, so a rental often shows a tax loss while cash-flowing — sheltering income. Rental losses are passive: they offset passive income freely, and up to $25,000/yr can offset ordinary (W-2) income if you actively participate and your MAGI is under $100k (phasing out to $0 by $150k); unused losses carry forward. On sale, claimed depreciation is recaptured at up to 25%, and gains may owe capital-gains tax (a 1031 exchange can defer both). Figures are a year-1 estimate at your 24.0% rate — not tax advice; consult a CPA.
Schools (NCES district)
- District
- Riverside School District
- NCES district ID
- 0500012
- Math proficiency
- 32% ▼ -14.00%
- Reading proficiency
- 42% ▼ -9.00%
- Median HH income
- $37,959
- Composite
- 30.82/100
- National rank
- #6136
- State rank
- #103 of 238 in AR
Livability — Lake City
- Score
- 64/100
- State rank
- #180
- US rank
- #14568
Category grades
Schools grade is shown separately in the Schools card above.
Census & demographics
- Census place
- Lake City, AR
- Population (ZIP)
- 3,386
Population outlook (Craighead County) Hauer SSP2
- Today (2025)
- 122,235 people
- By 2030
- 131,338 · +7.4%
- By 2040
- 149,862 · +22.6%
- By 2050
- 168,034 · +37.5%
- By 2075
- 208,094 · +70.2%
- By 2100
- 233,251 · +90.8%
Race, ethnicity, and origin ACS 2023
- Neighborhood character
- Predominantly White (94%)
- Race & ethnicity
- White 94% Two or more races 4% Black 1%
- Common ancestry
- Italian 2% Slovak 2% Iranian 1%
- Languages at home
- 99% English-only · Spanish 1%
Political lean MEDSL · Craighead
- 2024 margin
- Solid R (+37.4) · D 30.1% · R 67.5% · Other 2.4%
- 2008→2024 swing
- -12.9pp toward R · 2008: -24.5pp · 2024: -37.4pp
- All cycles
- 2024: R+37.4 2020: R+35.4 2016: R+35.2 2012: R+31.1 2008: R+24.5
Not yet ingested
- Civics
- —
Market trends
- HPI YoY
- ▲ 9.97%
- Current HPI
- 295.1637
- Rent YoY
- —
- Metro
- —
- State GDP YoY
- ▲ 3.80%
- F500 in state
- 10
Industry mix (Fortune 500 HQ in AR)
| Industry | F500 HQs | Revenue |
|---|---|---|
| Retail | 1 | $681B |
|
||
| Food / Agriculture | 1 | $53B |
|
||
| Retail / Energy | 1 | $22B |
|
||
| Transportation / Logistics | 1 | $12B |
|
||
| Energy | 1 | $4B |
|
||
Price history
-8.6% since first listed4 events — show timeline
- 2026-05-11 Price Changed $154,900 NEABOR MLS
- 2026-04-16 Price Changed $157,000 NEABOR MLS
- 2026-03-11 Price Changed $159,500 NEABOR MLS
- 2026-02-22 Listed $169,500 NEABOR MLS
Property tax history
+9.5%/yrLatest (2025): $777 · +259.5% YoY. Source: county tax records.
Cash-flow waterfall
monthlySold comps — $/sqft
last 12 mo · ≤1 miLoading sold comps…