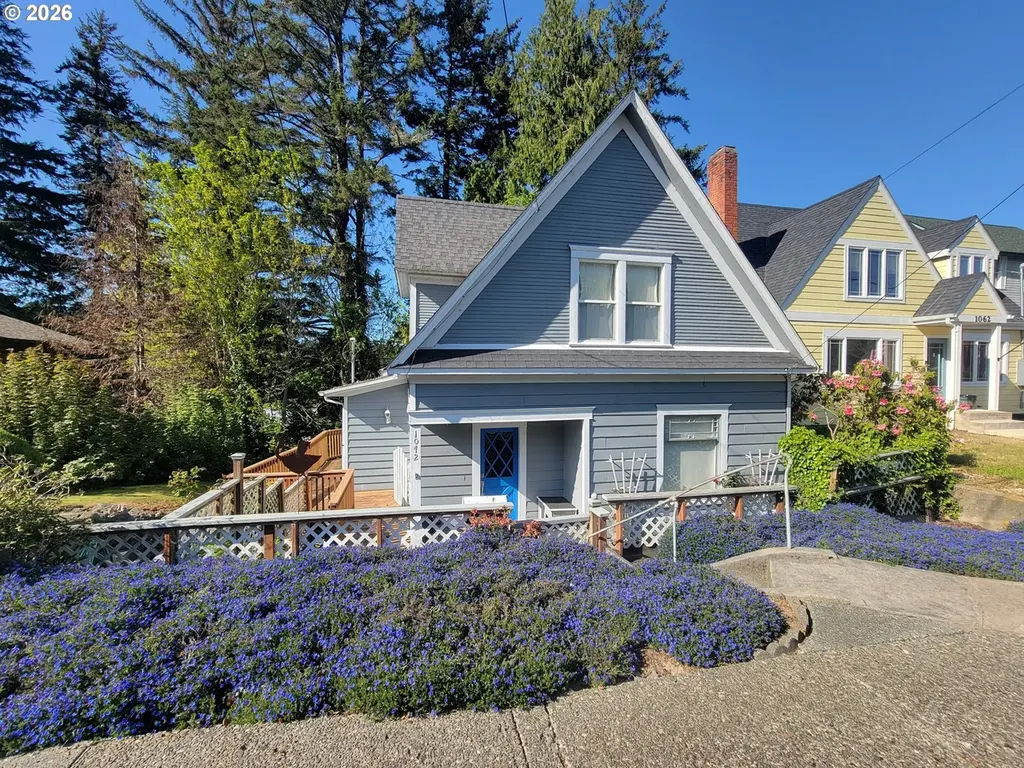
1072 Elrod Ave · Coos Bay, OR
Flood risk 1/10 · Minimal
- FEMA flood zone
- X (unshaded)
- Chance of flooding over 30 yrs
- 0.0%
- Est. flood insurance / yr
- $507 – $1,088
Fire risk 3/10 · Minor
- Est. fire insurance / yr
- $498 – $926
Heat risk 1/10 · Minimal
- Hot days now (above 76°F)
- 8 days/yr
- Hot days in 30 yrs
- 23 days/yr
Wind risk 1/10 · Minimal
- Chance of severe wind over 30 yrs
- —
Air-quality risk 6/10 · Moderate
- Unhealthy air days now
- 9 days/yr
- Unhealthy air days in 30 yrs
- 9 days/yr
Risk factors via First Street. Map © Google.
Why this score? — see what drove the F grade
The composite is a weighted blend of 9 inputs, each scored 0–100. Each bar is that input's sub-score; the figure is the points it added to the 100-point composite (weight × sub-score).
- ARV discount +10.2/15.0
- Cash flow +7.1/30.0
- Rent growth +4.7/5.0
- Livability +3.1/5.0
- Schools +2.5/10.0
- Condition / age +2.5/5.0
- DSCR +1.3/10.0
- 1% rule +1.1/10.0
- Appreciation +0.0/10.0
$299,000
🖨 Deal sheet (PDF) 📄 Offer letter ✓ Due diligence
Listing remarks
This charming 3-bedroom, 2-bath, 2,028 sq. ft. home is filled with beautiful historic details, including rich wood trim and beautiful floors. The nicely sized living room opens to an elegant dining room just off the kitchen, which features a large pantry and convenient access to the deck. Step back in time and unwind in the beautiful clawfoot tub, perfect for a relaxing evening. The laundry room comes complete with abundant storage space utility sink, and work shop area with workbench, and abundant storage space. Additional features include a gas furnace and an on-demand water heater. Conveniently located close to shopping, post office & library. This home is full of timeless charm a
Key facts
- Rich wood trim
- Historic details
- Large pantry
Tags
Property features AI
Finance
- Other: Lot approximately 0.15 acre (5,000 to 6,999 sq ft range)
Exterior
- Parking: On-street parking
- Utilities: Public water; Public sewer; Electricity and gas available
- Home design: Single-family residence (residential); Not attached to another property; Approximately maintained condition; Built in 1905; Entry levels include main, upper, and lower; No significant view noted
- Construction: Composition roof; Pillar/post/pier foundation; Wood siding construction; Year built: 1905
- Exterior features: Deck; Workshop; Yard; Wood siding; Level to sloped lot; Paved road access
Interior
- Kitchen: Cooktop; Built-in oven; Dishwasher; Free-standing refrigerator; Pantry
- Bedrooms: Primary bedroom on upper level with double closet and wall-to-wall carpet; Second bedroom on upper level with closet and wood floors; Third bedroom on upper level with closet and wall-to-wall carpet
- Flooring: Hardwood floors; Wood floors; Wall-to-wall carpet
- Bathrooms: Two full bathrooms (one on main level, one on upper level)
- Heating & cooling: Forced air heating; No central cooling mentioned; Hot water: gas tankless
- Interior features: Hardwood and wood floors; High ceilings; Soaking tub; Partial basement; Walk-in shower (accessibility feature); Accessible features present
- Laundry & utility: Laundry room on lower level
Neighborhood map
What this means for you Summary
Snapshot
- This is a 3-bed/1.5-bath single-family listed at $299k.
Deal economics
- At list price, monthly cash flow is $-430 ($-5k/yr) — negative.
- To cash-flow at today's rent, offer at most $223k (25.4% below list).
- To meet the 1% rule (rent ≥ 1% of price), the offer needs to be $183k (38.9% below list).
- Recommended offer: $183k (38.9% below list) — sets the bar for 1% rule.
Location & tenants
- Location reads 61/100 on livability (#257 in OR) — a middle-class / working-renter tenant base. Strengths: housing A+, health & safety A+, cost of living A; Watch: crime F, amenities F, commute F.
- Coos Bay SD 9 (town): math 22% / reading 39% proficiency, ranked #45 of 58 in OR (top 78%) — families likely to look elsewhere, expect single-tenant / working-renter base with shorter leases.
- Zoned schools: Marshfield Senior High School (math 17% / reading 54%, grade F, #89 of 143 statewide, top 62%, 835 students, 31% FRL) — zoned schools average 31% FRL vs 55% district-wide (24 pts lower); this property's tenant base skews higher-income than the district average.
- Market conditions: Rents rising fast (+8.7%/yr); 342 active listings in the ZIP; 1 comparable units currently listed for rent nearby; 122 units permitted in Coos County in 2024 (16 in 5+ unit buildings).
- This rent runs 36% of the median local income ($62k/yr) — at the standard rent-burdened threshold; future hikes will face affordability resistance.
Forward outlook
- Local home prices are declining (-3.0%/yr); year-one equity from $2k of loan paydown is wiped out by about $9k of value loss. Plan a longer hold.
- Coos County population projected to shrink 9% by 2050 — rents likely to lag national; underwrite the cash flow, not the appreciation.
Negotiation context
- It's been on market 18 days — a 2% lower offer ($295k) is reasonable based on typical stale-listing flexibility.
Risks & watch-outs
- Watch-outs: built in 1905 — expect roof / HVAC / electrical / plumbing capex.
Questions for the listing agent
- What do current leases actually rent for vs. the listed asking? Can we see a recent rent roll and the last 12 months of T-12 income?
- Built in 1905 — when were the roof, HVAC, electrical panel, plumbing, and water heater last replaced?
- Is there a deadline driving the sale (1031 exchange, divorce, estate, relocation)? That informs how much negotiation room exists.
- Schools are D-rated, which usually means shorter tenancies and higher turnover. Who's the typical renter profile here, and what's been the actual vacancy rate?
- Crime grade is F in this area — have there been break-ins, vandalism, or insurance claims at this property in the last 3 years? What carrier currently insures it and at what premium?
- The area grade is low — what's the realistic commute time and amenity access for the typical tenant pool here? Any planned neighborhood developments (good or bad) we should know about?
- What's the average days-on-market for RENTAL listings here right now (not sales)? A rising rental-DOM trend means longer vacancies and softer asking-rent achievability than the comps imply.
- What's the recent tenant-quality profile in this submarket — average credit score on applications, eviction rate, late-payment / NSF rate, and stable-employment percentage? A property-management company in the area should have these aggregated.
- How much new for-sale + rental construction is in the pipeline within 1–3 miles? Heavy new supply typically softens prices + rents 12–24 months out; constrained supply supports both.
Investment metrics
- 1% rule
- 0.61% ✗
- Cap rate
- 4.57%
- Cash-on-cash
- -6.17%
- DSCR
- 0.73
- GRM
- 13.6
CMA / ARV
- ARV (median comp)
- $317,922
- List price
- $299,000
- Delta
- -5.95%
- Verdict
- FAIR
- Comps
- 20 within 1.0 mi
Show comp detail 12 sales within ~0.75 mi
| Address | Dist | Beds/Ba | Sqft | Sold | Price | $/sf | Match |
|---|---|---|---|---|---|---|---|
| 1063 Elrod Ave | 0.05mi | 2/1.0 (-1) | 936 (+4%) | 11mo | $289,000 | $309 | 75 |
| 980 Anderson Ave | 0.20mi | 2/1.0 (-1) | 945 (+5%) | 11mo | $260,000 | $275 | 66 |
| 978 S 7th St | 0.48mi | 2/1.0 (-1) | 880 (-2%) | 9mo | $318,000 | $361 | 59 |
| 1159 Elrod Ave | 0.04mi | 2/1.0 (-1) | 812 (-10%) | 23mo | $142,870 | $176 | 56 |
| 844 8th Ter | 0.42mi | 2/1.0 (-1) | 914 (+2%) | 20mo | $225,000 | $246 | 54 |
| 1173 Park Ave | 0.41mi | 2/1.0 (-1) | 822 (-9%) | 11mo | $185,000 | $225 | 50 |
| 570 Ingersoll St | 0.41mi | 2/1.0 (-1) | 1,016 (+13%) | 13mo | $240,000 | $236 | 41 |
| 1021 S 5th St | 0.56mi | 2/1.0 (-1) | 818 (-9%) | 14mo | $234,000 | $286 | 40 |
| 563 Johnson Ave | 0.53mi | 2/1.0 (-1) | 786 (-13%) | 14mo | $235,000 | $299 | 35 |
| 845 Southwest Blvd | 0.75mi | 2/1.0 (-1) | 848 (-6%) | 20mo | $320,000 | $377 | 32 |
| 1159 S 10th St | 0.62mi | 3/2.0 | 1,000 (+11%) | 22mo | $259,900 | $260 | 32 |
| 1066 S 8th St | 0.55mi | 2/1.0 (-1) | 800 (-11%) | 22mo | $160,000 | $200 | 31 |
Match score weights: distance 35% · size 25% · config 20% · recency 20%. Top-matched comps best support the ARV.
Projected returns pro-forma
-3.0% appreciation · 8.0% rent growth · sell at horizon
- IRR
- -22.2%
- Equity multiple
- 0.21×
- Total profit
- $-66,286
- Equity at exit
- $44,582
- IRR
- -7.9%
- Equity multiple
- 0.41×
- Total profit
- $-49,415
- Equity at exit
- $25,852
Cash invested: $83,720 (down + closing). Projections, not guarantees.
Landlord ↔ Tenant lean methodology
- Overall (STATE)
- 28 Tenant-Leaning
- State Oregon
- 28 Tenant-Leaning · D+6
- County
- — inherits STATE
- City
- — inherits STATE
ZIP-level market 97420
- Rents YoY
- 8.7%
- Active inventory
- 342
- Price-to-rent
- 13.6×
Monthly cashflow live
- Estimated rent
- $1,828 medium interval (Pro) →
- Mortgage (P&I)
- −$1,568
- Tax from tax record
- −$182 /mo · $2,178/yr
- Insurance
- −$125
- HOA
- −$0
- Vacancy / Maint / Mgmt
- −$384
- Net cashflow
- $-430
Break-even live
Sensitivity live
| Price | -10% $-261 | -5% $-346 | +0% $-430 | +5% $-515 | +10% $-600 |
|---|---|---|---|---|---|
| Rent | -10% $-575 | -5% $-502 | +0% $-430 | +5% $-358 | +10% $-286 |
| Rate | -1.0pp $-280 | -0.5pp $-354 | base $-430 | +0.5pp $-508 | +1.0pp $-587 |
UW: 25.0% down · 7.5% · 30yr · 1.5% tax · 5.0% vac · 8.0% maint · 8.0% mgmt
Financing live
Cash to close
- Down payment
- $74,750
- Closing costs
- $8,970
- Reserves months
- —
- Total cash needed
- —
Loan-product check · same deal, 3 products live
Conventional
25% down · 7.5% · 30yr
- Down + closing
- —
- Monthly P&I
- —
- Monthly cashflow
- —
- DSCR
- —
- Eligible?
- —
Personal DTI + credit; lowest rate.
DSCR
20% down · 8.5% · 30yr
- Down + closing
- —
- Monthly P&I
- —
- Monthly cashflow
- —
- DSCR
- —
- Eligible?
- —
No personal income docs; deal must DSCR.
Hard money
10% down · 12.0% · 12mo
- Down + closing
- —
- Monthly P&I
- —
- Monthly cashflow
- —
- DSCR
- —
- Eligible?
- —
Short-term bridge; refi at stabilization.
Rent comps 1 comps
| Address | Beds | Baths | Sqft | Rent | $/sqft | DOM | Units | Dist |
|---|---|---|---|---|---|---|---|---|
| 995 S 10th St Coos Bay, OR | 2.0 | 1.0 | 850 | $1,375 | $1.62 | 44d | 1 | 0.41mi |
Listing history 4 events
-
2026-06-01status $299,000 Pending 18 DOM
-
2026-05-31days on market $299,000 Active 18 DOM
-
2026-05-30days on market $299,000 Active 17 DOM
-
2026-05-13$299,000 Active 739-char remark
ⓘ Source: listings_history table (triggers on properties + properties_extension) + one-shot
backfill from property_details.listing_events for pre-trigger history.
Tax reassessment forecast OR · Resets to sale price
- Current annual tax
- $2,178 · $182/mo
- Projected year-2 tax
- $2,900 · $242/mo
- Expected delta
- +$722/yr (+$60/mo · 33.1%)
ⓘ Screening estimate from a state-policy table — verify with the county assessor before closing.
Climate risk First Street
- Flood 1/10 Low FEMA zone X (unshaded) · 0% chance over 30 yrs
- Wildfire 3/10 Moderate
- Heat 1/10 Low 8 d/yr ≥76°F today · 23 d/yr by 30 yrs out
- Wind 1/10 Low
- Air quality 6/10 Major 9 unhealthy d/yr today · 9 by 30 yrs out
Nearby sold comps map
Loading sold comps map…
Walkable amenities ~0.75 mi
Loading nearby amenities…
Taxation est. · year 1
- Rental income
- $21,932
- − Mortgage interest
- −$16,749
- − Property taxes
- −$2,178
- − Insurance
- −$1,495
- − Repairs & maintenance
- −$1,755
- − Management
- −$1,755
- − Depreciation
- −$8,698
- Taxable loss
- −$10,698
- Est. tax savings @ 24.0%
- +$2,567
- After-tax cash flow
- $-2,596/yr
For passive investors: Depreciation is non-cash, so a rental often shows a tax loss while cash-flowing — sheltering income. Rental losses are passive: they offset passive income freely, and up to $25,000/yr can offset ordinary (W-2) income if you actively participate and your MAGI is under $100k (phasing out to $0 by $150k); unused losses carry forward. On sale, claimed depreciation is recaptured at up to 25%, and gains may owe capital-gains tax (a 1031 exchange can defer both). Figures are a year-1 estimate at your 24.0% rate — not tax advice; consult a CPA.
Schools (NCES district)
- District
- Coos Bay SD 9
- NCES district ID
- 4103660
- Math proficiency
- 22% ▼ -6.00%
- Reading proficiency
- 39% ▼ -4.00%
- Median HH income
- $38,630
- Composite
- 25.46/100
- National rank
- #7450
- State rank
- #45 of 58 in OR
Livability — Coos Bay
- Score
- 61/100
- State rank
- #257
- US rank
- #17474
Category grades
Schools grade is shown separately in the Schools card above.
Census & demographics
- Census place
- Coos Bay, OR
- County
- Coos County · 27,621 people
- City population
- 27,621
- Metro
- Coos Bay, OR
- Population (ZIP)
- 27,621
- Household income
- $61,574
- Rent vs Own
- Severe rent burden
- 799.0
Population outlook (Coos County) Hauer SSP2
- Today (2025)
- 62,222 people
- By 2030
- 61,120 · -1.8%
- By 2040
- 58,478 · -6.0%
- By 2050
- 56,819 · -8.7%
- By 2075
- 54,915 · -11.7%
- By 2100
- 51,403 · -17.4%
Race, ethnicity, and origin ACS 2023
- Neighborhood character
- Predominantly White (81%)
- Race & ethnicity
- White 81% Hispanic / Latino 10% Two or more races 8% Native American 2% Asian 1%
- Hispanic origin (detail)
- Mexican 7%
- Common ancestry
- Italian 5% Slovak 3% Lithuanian 3%
- Foreign-born
- 5% · Canada, Vietnam
- Languages at home
- 92% English-only · Spanish 6%
Political lean MEDSL · Coos
- 2024 margin
- R (+19.9) · D 38.7% · R 58.5% · Other 2.8%
- 2008→2024 swing
- -16.8pp toward R · 2008: -3.1pp · 2024: -19.9pp
- All cycles
- 2024: R+19.9 2020: R+20.5 2016: R+24.3 2012: R+6.3 2008: R+3.1
Not yet ingested
- Civics
- —
Market trends
- HPI YoY
- ▼ -315.58%
- Current HPI
- 198.3249
- Rent YoY
- ▲ 8.65%
- Metro
- Coos Bay, OR
- State GDP YoY
- ▲ 2.05%
- F500 in state
- 2
Industry mix (Fortune 500 HQ in OR)
| Industry | F500 HQs | Revenue |
|---|---|---|
| Consumer Goods | 1 | $51B |
|
||
Price history
2 events — show timeline
- 2026-06-01 Pending — RMLS
- 2026-05-13 Listed $299,000 RMLS
Property tax history
+3.7%/yrLatest (2025): $2,178 · +1.5% YoY. Source: county tax records.
Cash-flow waterfall
monthlySold comps — $/sqft
last 12 mo · ≤1 miLoading sold comps…