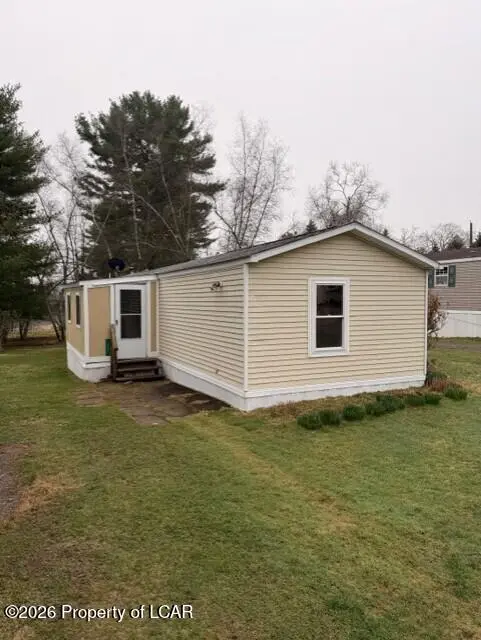
11 1st Ln · Ross, PA
Flood risk No data
- FEMA flood zone
- —
- Chance of flooding over 30 yrs
- —
- Est. flood insurance / yr
- —
Fire risk No data
- Est. fire insurance / yr
- —
Heat risk No data
- Hot days now (above threshold)
- —
- Hot days in 30 yrs
- —
Wind risk No data
- Chance of severe wind over 30 yrs
- —
Air-quality risk No data
- Unhealthy air days now
- —
- Unhealthy air days in 30 yrs
- —
Risk factors via First Street. Map © Google.
Why this score? — see what drove the B grade
The composite is a weighted blend of 9 inputs, each scored 0–100. Each bar is that input's sub-score; the figure is the points it added to the 100-point composite (weight × sub-score).
- Cash flow +30.0/30.0
- 1% rule +10.0/10.0
- DSCR +10.0/10.0
- ARV discount +7.5/15.0
- Appreciation +4.5/10.0
- Schools +4.3/10.0
- Rent growth +2.5/5.0
- Livability +2.5/5.0
- Condition / age +2.5/5.0
$64,500
🖨 Deal sheet (PDF) 📄 Offer letter ✓ Due diligence
Listing remarks
SWEET VALLEY SENIOR MOBILE HOME COMMUNITY, SPACE RENT $460 PER MONTH, INCLUDES WATER, SEWER & GARBAGE. NEW FLOORS & CARPET THROUGHOUT.
Key facts
- New floors
- Built 1983
- Listed 52 days
Tags
Property features AI
Exterior
- Home design: Residential mobile home; One level
- Construction: Vinyl siding
- Exterior features: Cleared lot
Interior
- Kitchen: Eat-in kitchen
- Bathrooms: 2 full bathrooms
- Heating & cooling: Oil heating; Forced air heating
- Interior features: Eat-in kitchen; 6 total rooms
Neighborhood map
What this means for you Summary
Snapshot
- This is a 3-bed/2.0-bath manufactured listed at $64k.
Deal economics
- At list price, monthly cash flow is $604 ($7k/yr) — positive.
- The deal already cash-flows at list — no discount required.
- Meets the 1% rule at list price ($1k rent vs $64k).
- Recommended offer: $63k (3.0% below list) — sets the bar for market timing.
Location & tenants
- Location reads: area grade B — affects rentability + tenant quality, not the cash-flow math above.
- Lake-Lehman SD (rural): math 39% / reading 59% proficiency, ranked #176 of 539 in PA (top 33%) — families likely to look elsewhere, expect single-tenant / working-renter base with shorter leases.
- Market conditions: 19 active listings in the ZIP; 349 units permitted in Luzerne County in 2024 (16 in 5+ unit buildings).
Forward outlook
- Local home prices are declining (-1.0%/yr); year-one equity from $446 of loan paydown is wiped out by about $626 of value loss. Plan a longer hold.
- Luzerne County population projected at +4% by 2050 — modest demand growth; plan on rents tracking national, not racing it.
- At projected returns (-1.0% appreciation + 3.0% rent growth), your $18k cash investment doubles in ~3 years — after that, you're playing with house money.
Negotiation context
- It's been on market 52 days — a 3% lower offer ($63k) is reasonable based on typical stale-listing flexibility.
Questions for the listing agent
- It's been on market 52 days. Have you received any prior offers? Is the seller open to a 3% concession, seller financing, or rate buy-down credit?
- Is there a deadline driving the sale (1031 exchange, divorce, estate, relocation)? That informs how much negotiation room exists.
- What's the average days-on-market for RENTAL listings here right now (not sales)? A rising rental-DOM trend means longer vacancies and softer asking-rent achievability than the comps imply.
- What's the recent tenant-quality profile in this submarket — average credit score on applications, eviction rate, late-payment / NSF rate, and stable-employment percentage? A property-management company in the area should have these aggregated.
- How much new for-sale + rental construction is in the pipeline within 1–3 miles? Heavy new supply typically softens prices + rents 12–24 months out; constrained supply supports both.
Investment metrics
- 1% rule
- 1.93% ✓
- Cap rate
- 17.54%
- Cash-on-cash
- 40.16%
- DSCR
- 2.79
- GRM
- 4.3
CMA / ARV
- ARV (median comp)
- $20,000
- List price
- $64,500
- Delta
- 222.50%
- Verdict
- OVERPRICED
- Comps
- 1 within 2.0 mi
Projected returns pro-forma
-0.97% appreciation · 3.0% rent growth · sell at horizon
- IRR
- 39.7%
- Equity multiple
- 2.87×
- Total profit
- $33,704
- Equity at exit
- $15,658
- IRR
- 43.8%
- Equity multiple
- 5.66×
- Total profit
- $84,173
- Equity at exit
- $16,517
Cash invested: $18,060 (down + closing). Projections, not guarantees.
Landlord ↔ Tenant lean methodology
- Overall (STATE)
- 62 Landlord-Friendly
- State Pennsylvania
- 62 Landlord-Friendly · EVEN
- County
- — inherits STATE
- City
- — inherits STATE
ZIP-level market 18621
- Home prices YoY
- -0.3%
- Active inventory
- 19
- Price-to-rent
- 4.3×
Monthly cashflow live
- Estimated rent
- $1,246 medium interval (Pro) →
- Mortgage (P&I)
- −$338
- Tax from tax record
- −$14 /mo · $173/yr
- Insurance
- −$27
- HOA
- −$0
- Vacancy / Maint / Mgmt
- −$262
- Net cashflow
- $604
Break-even live
Sensitivity live
| Price | -10% $641 | -5% $623 | +0% $604 | +5% $586 | +10% $568 |
|---|---|---|---|---|---|
| Rent | -10% $506 | -5% $555 | +0% $604 | +5% $654 | +10% $703 |
| Rate | -1.0pp $637 | -0.5pp $621 | base $604 | +0.5pp $588 | +1.0pp $571 |
UW: 25.0% down · 7.5% · 30yr · 1.5% tax · 5.0% vac · 8.0% maint · 8.0% mgmt
Financing live
Cash to close
- Down payment
- $16,125
- Closing costs
- $1,935
- Reserves months
- —
- Total cash needed
- —
Loan-product check · same deal, 3 products live
Conventional
25% down · 7.5% · 30yr
- Down + closing
- —
- Monthly P&I
- —
- Monthly cashflow
- —
- DSCR
- —
- Eligible?
- —
Personal DTI + credit; lowest rate.
DSCR
20% down · 8.5% · 30yr
- Down + closing
- —
- Monthly P&I
- —
- Monthly cashflow
- —
- DSCR
- —
- Eligible?
- —
No personal income docs; deal must DSCR.
Hard money
10% down · 12.0% · 12mo
- Down + closing
- —
- Monthly P&I
- —
- Monthly cashflow
- —
- DSCR
- —
- Eligible?
- —
Short-term bridge; refi at stabilization.
Listing history 15 events
-
2026-06-18days on market $64,500 Active 52 DOM
-
2026-06-17days on market $64,500 Active 51 DOM
-
2026-06-16days on market $64,500 Active 50 DOM
-
2026-06-15days on market $64,500 Active 49 DOM
-
2026-06-14days on market $64,500 Active 47 DOM
-
2026-06-13days on market $64,500 Active 46 DOM
-
2026-06-10days on market $64,500 Active 44 DOM
-
2026-06-09days on market $64,500 Active 43 DOM
-
2026-06-08days on market $64,500 Active 42 DOM
-
2026-06-07days on market $64,500 Active 41 DOM
-
2026-06-02days on market $64,500 Active 36 DOM
-
2026-06-01days on market $64,500 Active 35 DOM
-
2026-05-31days on market $64,500 Active 34 DOM
-
2026-05-30days on market $64,500 Active 33 DOM
-
2026-04-27$64,500 Active 146-char remark
ⓘ Source: listings_history table (triggers on properties + properties_extension) + one-shot
backfill from property_details.listing_events for pre-trigger history.
Tax reassessment forecast PA · Partial reset (capped growth)
- Current annual tax
- $173 · $14/mo
- Projected year-2 tax
- $596 · $50/mo
- Expected delta
- +$423/yr (+$35/mo · 244.2%)
ⓘ Screening estimate from a state-policy table — verify with the county assessor before closing.
Nearby sold comps map
Loading sold comps map…
Walkable amenities ~0.75 mi
Loading nearby amenities…
Taxation est. · year 1
- Rental income
- $14,947
- − Mortgage interest
- −$3,613
- − Property taxes
- −$173
- − Insurance
- −$322
- − Repairs & maintenance
- −$1,196
- − Management
- −$1,196
- − Depreciation
- −$1,876
- Taxable income
- $6,571
- Est. tax owed @ 24.0%
- −$1,577
- After-tax cash flow
- $5,677/yr
For passive investors: Depreciation is non-cash, so a rental often shows a tax loss while cash-flowing — sheltering income. Rental losses are passive: they offset passive income freely, and up to $25,000/yr can offset ordinary (W-2) income if you actively participate and your MAGI is under $100k (phasing out to $0 by $150k); unused losses carry forward. On sale, claimed depreciation is recaptured at up to 25%, and gains may owe capital-gains tax (a 1031 exchange can defer both). Figures are a year-1 estimate at your 24.0% rate — not tax advice; consult a CPA.
Schools (NCES district)
- District
- Lake-Lehman SD
- NCES district ID
- 4213020
- Math proficiency
- 39% ▼ -6.00%
- Reading proficiency
- 59% ▼ -5.00%
- Median HH income
- $60,161
- Composite
- 42.85/100
- National rank
- #3129
- State rank
- #176 of 539 in PA
Livability — Ross
No livability data for this city. (Only ~50 U.S. cities are tracked.)
Census & demographics
- Population (ZIP)
- 4,903
Population outlook (Luzerne County) Hauer SSP2
- Today (2025)
- 319,505 people
- By 2030
- 319,943 · +0.1%
- By 2040
- 322,643 · +1.0%
- By 2050
- 330,817 · +3.5%
- By 2075
- 379,145 · +18.7%
- By 2100
- 431,908 · +35.2%
Race, ethnicity, and origin ACS 2023
- Neighborhood character
- Predominantly White (90%)
- Race & ethnicity
- White 90% Two or more races 4% Black 3% Hispanic / Latino 3%
- Common ancestry
- Romanian 22% Iranian 2% Lithuanian 2%
- Foreign-born
- 0% · Canada
- Languages at home
- 97% English-only · Spanish 3%
Political lean MEDSL · Luzerne
- 2024 margin
- R (+19.2) · D 40.0% · R 59.2%
- 2008→2024 swing
- -27.6pp toward R · 2008: 8.4pp · 2024: -19.2pp
- All cycles
- 2024: R+19.2 2020: R+14.4 2016: R+19.6 2012: D+4.8 2008: D+8.4
Not yet ingested
- Civics
- —
Market trends
- HPI YoY
- ▼ -0.97%
- Current HPI
- 282.6249
- Rent YoY
- —
- Metro
- —
- State GDP YoY
- ▲ 1.68%
- F500 in state
- 34
Industry mix (Fortune 500 HQ in PA)
| Industry | F500 HQs | Revenue |
|---|---|---|
| Healthcare | 2 | $309B |
|
||
| Insurance | 2 | $27B |
|
||
| Telecommunications / Media | 1 | $124B |
|
||
| Industrial Distribution | 1 | $22B |
|
||
| Financial Services | 1 | $20B |
|
||
| Chemicals / Materials | 1 | $18B |
|
||
Price history
1 event — show timeline
- 2026-04-27 Listed $64,500 LCAR
Property tax history
+1.6%/yrLatest (2026): $173 · +1.9% YoY. Source: county tax records.
Cash-flow waterfall
monthlySold comps — $/sqft
last 12 mo · ≤1 miLoading sold comps…