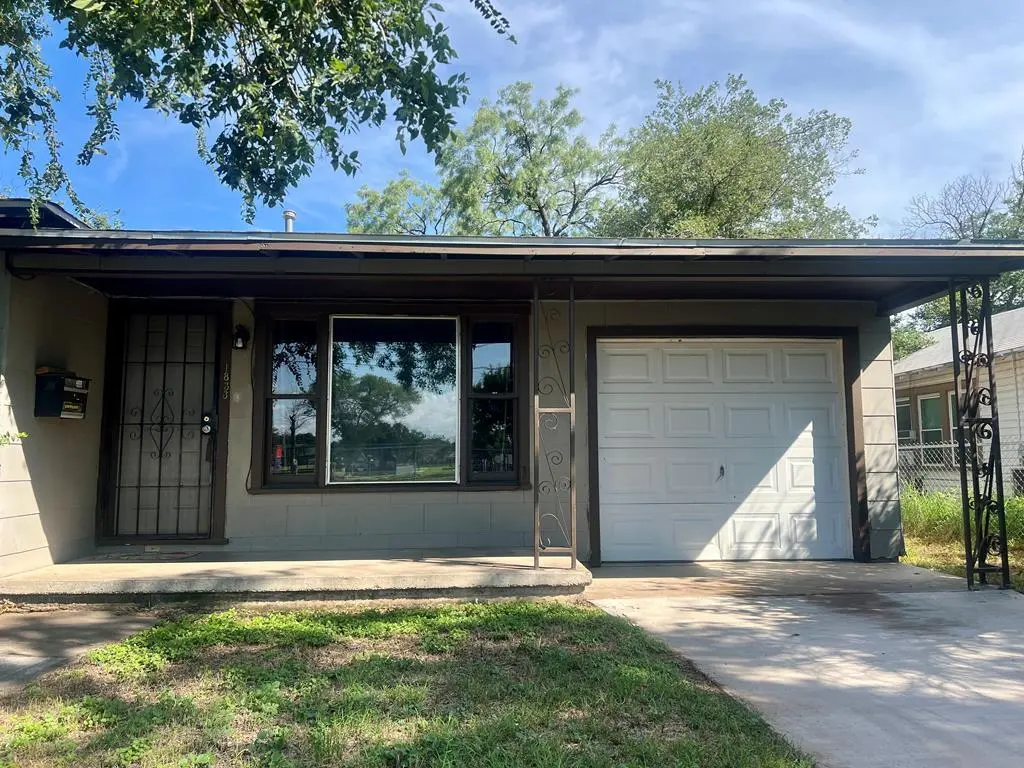
1833 Willow St · San Angelo, TX
Flood risk 1/10 · Minimal
- FEMA flood zone
- X (unshaded)
- Chance of flooding over 30 yrs
- 0.0%
- Est. flood insurance / yr
- $507 – $1,088
Fire risk 6/10 · Moderate
- Est. fire insurance / yr
- $1,222 – $2,270
Heat risk 7/10 · Major
- Hot days now (above 104°F)
- 7 days/yr
- Hot days in 30 yrs
- 23 days/yr
Wind risk 4/10 · Minor
- Chance of severe wind over 30 yrs
- 12.0%
Air-quality risk 1/10 · Minimal
- Unhealthy air days now
- 0 days/yr
- Unhealthy air days in 30 yrs
- 0 days/yr
Risk factors via First Street. Map © Google.
Why this score? — see what drove the B grade
The composite is a weighted blend of 9 inputs, each scored 0–100. Each bar is that input's sub-score; the figure is the points it added to the 100-point composite (weight × sub-score).
- Cash flow +21.0/30.0
- ARV discount +14.8/15.0
- Appreciation +10.0/10.0
- DSCR +6.7/10.0
- 1% rule +5.8/10.0
- Rent growth +3.9/5.0
- Livability +3.7/5.0
- Schools +2.6/10.0
- Condition / age +2.5/5.0
$134,900
🖨 Deal sheet (PDF) 📄 Offer letter ✓ Due diligence
Listing remarks MLS
Take a look at this great starter home or investment property! Offering a large bonus utility room that could act as a 3rd bedroom and original hardwood floors that flow throughout! Centrally located off Loop 306.
Key facts
- Centrally located
- Bonus utility room
- Garage
Tags
Neighborhood map
What this means for you Summary
Snapshot
- This is a 2-bed/1.0-bath single-family listed at $135k.
Deal economics
- At list price, monthly cash flow is $190 ($2k/yr) — positive.
- The deal already cash-flows at list — no discount required.
- Meets the 1% rule at list price ($1k rent vs $135k).
- Recommended offer: $119k (12.0% below list) — sets the bar for market timing.
- Cap rate 8.0% vs local median 3.8% in San Angelo — top-decile yield for the area; either an underpriced asset or a hidden risk that comps aren't pricing in. Stress-test before assuming the spread holds.
Location & tenants
- Location reads 73/100 on livability (#199 in TX) — a middle-class / working-renter tenant base. Strengths: cost of living A+, housing A+, health & safety A+; Watch: employment C-, schools F, amenities F.
- San Angelo ISD (urban): math 27% / reading 33% proficiency, ranked #627 of 826 in TX (top 76%) — families likely to look elsewhere, expect single-tenant / working-renter base with shorter leases.
- Market conditions: Rents rising fast (+5.8%/yr); 331 active listings in the ZIP; 28 comparable units currently listed for rent nearby; rentals lingering (median 45d on market — plan ~5-8 weeks vacancy on turnover, expect pricing pressure); 61% of comp listings sitting > 30 days — soft ceiling on asking rent; 233 units permitted in Tom Green County in 2024 (0 in 5+ unit buildings).
Forward outlook
- In year one you build about $14k of equity ($933 loan paydown + $13k appreciation (10.0% local appreciation)).
- Tom Green County population projected at +35% by 2050 — long-run rental-demand tailwind backs the buy-and-hold thesis.
- At projected returns (10.0% appreciation + 5.8% rent growth), your $38k cash investment doubles in ~3 years — after that, you're playing with house money.
- By year 3, paydown + projected appreciation supports a ~$37k cash-out refi (75% LTV) — recoverable capital for the next deal without selling this one.
Negotiation context
- It's been on market 337 days — a 12% lower offer ($119k) is reasonable based on typical stale-listing flexibility.
- 3 sale attempts since 4y ago with the ask held roughly flat each time — persistent listings suggest the price (not the market) is what's stuck; bring a comps-based counter.
Risks & watch-outs
- Climate carrying-cost: major wildfire risk; extreme-heat days projected 7→23/yr by 2055 (HVAC capex compounding) — expect insurance premiums to compound above CPI over the hold.
Questions for the listing agent
- It's been on market 337 days. Have you received any prior offers? Is the seller open to a 12% concession, seller financing, or rate buy-down credit?
- Why hasn't it sold? Are there any deal-killer items the seller is aware of (foundation, flood, title, zoning, code violations)?
- Is there a deadline driving the sale (1031 exchange, divorce, estate, relocation)? That informs how much negotiation room exists.
- Schools are F-rated, which usually means shorter tenancies and higher turnover. Who's the typical renter profile here, and what's been the actual vacancy rate?
- What's the average days-on-market for RENTAL listings here right now (not sales)? A rising rental-DOM trend means longer vacancies and softer asking-rent achievability than the comps imply.
- What's the recent tenant-quality profile in this submarket — average credit score on applications, eviction rate, late-payment / NSF rate, and stable-employment percentage? A property-management company in the area should have these aggregated.
- How much new for-sale + rental construction is in the pipeline within 1–3 miles? Heavy new supply typically softens prices + rents 12–24 months out; constrained supply supports both.
Investment metrics
- 1% rule
- 1.08% ✓
- Cap rate
- 7.98%
- Cash-on-cash
- 6.04%
- DSCR
- 1.27
- GRM
- 7.7
CMA / ARV
- ARV (median comp)
- $161,201
- List price
- $134,900
- Delta
- -16.32%
- Verdict
- UNDERPRICED
- Comps
- 20 within 1.0 mi
Show comp detail 12 sales within ~0.75 mi
| Address | Dist | Beds/Ba | Sqft | Sold | Price | $/sf | Match |
|---|---|---|---|---|---|---|---|
| 2019 Freeland Ave | 0.21mi | 2/1.0 | 1,008 (-3%) | 4mo | $127,500 | $126 | 81 |
| 206 N Van Buren St | 0.32mi | 2/1.0 | 1,008 (-3%) | 1mo | $167,500 | $166 | 79 |
| 2005 Bailey St | 0.23mi | 2/2.0 | 1,104 (+6%) | 4mo | $129,000 | $117 | 72 |
| 215 Westland St | 0.41mi | 2/1.0 | 971 (-7%) | 1mo | $124,900 | $129 | 69 |
| 2105 Coleman St | 0.33mi | 3/1.0 (+1) | 1,105 (+6%) | 2mo | $160,000 | $145 | 67 |
| 1825 N St St | 0.29mi | 2/1.0 | 940 (-10%) | 5mo | $100,000 | $106 | 66 |
| 1024 N Bishop St | 0.52mi | 3/1.0 (+1) | 1,070 (+3%) | 1mo | $135,000 | $126 | 65 |
| 2403 Freeland Ave | 0.49mi | 2/2.0 | 1,120 (+8%) | 2mo | $179,900 | $161 | 59 |
| 2410 Lindell Ave | 0.73mi | 2/1.0 | 960 (-8%) | 2mo | $157,000 | $164 | 52 |
| 1906 Juanita Ave | 0.66mi | 2/2.0 | 964 (-8%) | 3mo | $165,000 | $171 | 51 |
| 2414 Chestnut St | 0.53mi | 2/1.0 | 910 (-13%) | 4mo | $142,000 | $156 | 51 |
| 2319 North St | 0.48mi | 3/1.0 (+1) | 1,180 (+13%) | 1mo | $129,500 | $110 | 49 |
Match score weights: distance 35% · size 25% · config 20% · recency 20%. Top-matched comps best support the ARV.
Projected returns pro-forma
10.0% appreciation · 5.78% rent growth · sell at horizon
- IRR
- 29.8%
- Equity multiple
- 3.38×
- Total profit
- $89,817
- Equity at exit
- $121,529
- IRR
- 26.8%
- Equity multiple
- 8.00×
- Total profit
- $264,570
- Equity at exit
- $262,081
Cash invested: $37,772 (down + closing). Projections, not guarantees.
Landlord ↔ Tenant lean methodology
- Overall (STATE)
- 87 Strongly Landlord-Friendly
- State Texas
- 87 Strongly Landlord-Friendly · R+5
- County
- — inherits STATE
- City
- — inherits STATE
ZIP-level market 76901
- Home prices YoY
- 6.4%
- Rents YoY
- 5.8%
- Active inventory
- 331
- Price-to-rent
- 7.7×
Monthly cashflow live
- Estimated rent
- $1,459 high interval (Pro) →
- Mortgage (P&I)
- −$707
- Tax from tax record
- −$198 /mo · $2,382/yr
- Insurance
- −$56
- HOA
- −$0
- Vacancy / Maint / Mgmt
- −$306
- Net cashflow
- $190
Break-even live
Sensitivity live
| Price | -10% $267 | -5% $228 | +0% $190 | +5% $152 | +10% $114 |
|---|---|---|---|---|---|
| Rent | -10% $75 | -5% $133 | +0% $190 | +5% $248 | +10% $305 |
| Rate | -1.0pp $258 | -0.5pp $224 | base $190 | +0.5pp $155 | +1.0pp $120 |
UW: 25.0% down · 7.5% · 30yr · 1.5% tax · 5.0% vac · 8.0% maint · 8.0% mgmt
Financing live
Cash to close
- Down payment
- $33,725
- Closing costs
- $4,047
- Reserves months
- —
- Total cash needed
- —
Loan-product check · same deal, 3 products live
Conventional
25% down · 7.5% · 30yr
- Down + closing
- —
- Monthly P&I
- —
- Monthly cashflow
- —
- DSCR
- —
- Eligible?
- —
Personal DTI + credit; lowest rate.
DSCR
20% down · 8.5% · 30yr
- Down + closing
- —
- Monthly P&I
- —
- Monthly cashflow
- —
- DSCR
- —
- Eligible?
- —
No personal income docs; deal must DSCR.
Hard money
10% down · 12.0% · 12mo
- Down + closing
- —
- Monthly P&I
- —
- Monthly cashflow
- —
- DSCR
- —
- Eligible?
- —
Short-term bridge; refi at stabilization.
Rent comps 28 comps
| Address | Beds | Baths | Sqft | Rent | $/sqft | DOM | Units | Dist |
|---|---|---|---|---|---|---|---|---|
| 1835 Willow St San Angelo, TX | 3.0 | 1.0 | 1267 | $1,750 | $1.38 | 44d | 1 | 0.01mi |
| 711 N Monroe St San Angelo, TX | 3.0 | 1.0 | 1345 | $1,500 | $1.12 | 44d | 1 | 0.23mi |
| 121 N Van Buren St Unit A San Angelo, TX | 2.0 | 1.0 | 715 | $1,095 | $1.53 | 21d | 1 | 0.35mi |
| 2102 Webster St San Angelo, TX | 3.0 | 1.0 | 1233 | $1,750 | $1.42 | 44d | 1 | 0.42mi |
| 705 Childress St San Angelo, TX | 2.0 | 1.0 | 872 | $1,400 | $1.61 | 44d | 1 | 0.58mi |
| 2430 Rio Grande St San Angelo, TX | 3.0 | 1.0 | 1200 | $1,395 | $1.16 | 44d | 1 | 0.64mi |
| 212 S Fillmore St Unit B San Angelo, TX | 2.0 | 1.0 | 800 | $999 | $1.25 | 44d | 1 | 0.70mi |
| 902 Shiloh St Unit RE-908-C San Angelo, TX | 2.0 | 1.5 | 925 | $1,175 | $1.27 | 44d | 1 | 0.70mi |
| 902 Shiloh St Unit RE-908-20 San Angelo, TX | 1.0 | 1.0 | 800 | $1,025 | $1.28 | 44d | 1 | 0.70mi |
| 902 Shiloh St Unit RE-908-16 San Angelo, TX | 2.0 | 1.0 | 875 | $1,125 | $1.29 | 44d | 1 | 0.70mi |
| 2630 Waco St San Angelo, TX | 3.0 | 2.0 | 1024 | $1,600 | $1.56 | 21d | 1 | 0.75mi |
| 2629 Forest Park Ave San Angelo, TX | 3.0 | 2.0 | 1336 | $1,895 | $1.42 | 44d | 1 | 0.79mi |
| 1929 Raney St San Angelo, TX | 1.0–2.0 | 1.0–2.0 | 765 | $1,000 | $1.31 | 21d | 4 | 0.80mi |
| 2065 Live Oak St San Angelo, TX | 2.0 | 1.0 | 720 | $950 | $1.32 | 44d | 1 | 0.85mi |
| 1905 Meadowbrook Dr San Angelo, TX | 3.0 | 2.0 | 1184 | $1,400 | $1.18 | 44d | 1 | 0.86mi |
| 2102 Raney St San Angelo, TX | 3.0 | 1.0 | 1040 | $1,295 | $1.25 | 21d | 1 | 0.87mi |
| 2804 Abilene St San Angelo, TX | 3.0 | 2.0 | 1304 | $1,550 | $1.19 | 44d | 1 | 0.88mi |
| 1405 Hassell St San Angelo, TX | 3.0 | 2.0 | 1064 | $1,950 | $1.83 | 44d | 1 | 1.02mi |
| 706 W 16th St San Angelo, TX | 3.0 | 2.0 | 1298 | $1,590 | $1.22 | 21d | 1 | 1.04mi |
| 810 W 19th St San Angelo, TX | 3.0 | 2.0 | 1090 | $1,249 | $1.15 | 21d | 1 | 1.06mi |
| 1717 Greenwood St San Angelo, TX | 1.0 | 1.0 | 754 | $625 | $0.83 | 21d | 1 | 1.07mi |
| 1210 Guthrie St San Angelo, TX | 3.0 | 2.0 | 1157 | $1,400 | $1.21 | 21d | 1 | 1.14mi |
| 540 W 16th St San Angelo, TX | 3.0 | 2.0 | 1090 | $1,364 | $1.25 | 44d | 1 | 1.18mi |
| 2802 Field St San Angelo, TX | 3.0 | 2.0 | 1384 | $1,600 | $1.16 | 44d | 1 | 1.20mi |
| 1725 West Avenue M Unit M San Angelo, TX | 2.0 | 1.0 | 1202 | $1,350 | $1.12 | 21d | 1 | 1.21mi |
| 1818 S Lincoln St San Angelo, TX | 2.0 | 1.0–2.0 | 555 | $1,199 | $2.16 | 21d | 19 | 1.24mi |
| 1714 Cordell Dr San Angelo, TX | 3.0 | 2.0 | 1416 | $1,850 | $1.31 | 44d | 1 | 1.40mi |
| 2013 Rosemont Dr San Angelo, TX | 3.0 | 2.0 | 1400 | $2,100 | $1.50 | 21d | 1 | 1.42mi |
Listing history 26 events
-
2026-06-19days on market $134,900 Active 337 DOM
-
2026-06-18days on market $134,900 Active 336 DOM
-
2026-06-17days on market $134,900 Active 335 DOM
-
2026-06-16days on market $134,900 Active 334 DOM
-
2026-06-15days on market $134,900 Active 333 DOM
-
2026-06-14days on market $134,900 Active 331 DOM
-
2026-06-13days on market $134,900 Active 330 DOM
-
2026-06-10days on market $134,900 Active 328 DOM
-
2026-06-09days on market $134,900 Active 327 DOM
-
2026-06-08days on market $134,900 Active 326 DOM
-
2026-06-07days on market $134,900 Active 325 DOM
-
2026-06-02days on market $134,900 Active 320 DOM
-
2026-06-01days on market $134,900 Active 319 DOM
-
2026-05-31days on market $134,900 Active 318 DOM
-
2026-05-30days on market $134,900 Active 317 DOM
-
2026-02-10price $134,900 213-char remark
Show marketing remark (213 chars)
Take a look at this great starter home or investment property! Offering a large bonus utility room that could act as a 3rd bedroom and original hardwood floors that flow throughout! Centrally located off Loop 306.
-
2026-01-18status Active 213-char remark
Show marketing remark (213 chars)
Take a look at this great starter home or investment property! Offering a large bonus utility room that could act as a 3rd bedroom and original hardwood floors that flow throughout! Centrally located off Loop 306.
-
2025-11-21price $136,000 213-char remark
Show marketing remark (213 chars)
Take a look at this great starter home or investment property! Offering a large bonus utility room that could act as a 3rd bedroom and original hardwood floors that flow throughout! Centrally located off Loop 306.
-
2025-08-19price $138,000 213-char remark
Show marketing remark (213 chars)
Take a look at this great starter home or investment property! Offering a large bonus utility room that could act as a 3rd bedroom and original hardwood floors that flow throughout! Centrally located off Loop 306.
-
2025-07-14$139,999 Active 213-char remark
Show marketing remark (213 chars)
Take a look at this great starter home or investment property! Offering a large bonus utility room that could act as a 3rd bedroom and original hardwood floors that flow throughout! Centrally located off Loop 306.
-
2022-06-17soldstatus
-
2022-06-17soldstatus
-
2022-06-10soldstatus Closed 973-char remark
Show marketing remark (973 chars)
Freshly remodeled 2 bed/1 bath home, with a large bonus utility room that could act as a 3rd bedroom, cradled stately in the heart of San Angelo. This home is perfect for young families as the front porch looks out onto the Austin Elementary playground! Being right across the street from the elementary school and in a great neighborhood, you can have piece of mind when your child is able to walk themselves to school each morning. The large back yard is perfect for all pets and the location is easily accessible as it is a block away from Loop 306 in San Angelo. As you walk into this home, you immediately notice the refinished, original hardwood floors that flow throughout the house and into the kitchen. In the kitchen, durable tile floors give way to a newly built rustic wooden counter top that match the hardwood floors throughout other rooms in the house. Be the envy of your neighborhood while paying a fraction of the price as this home is priced to sell NOW!
-
2022-04-22historical 973-char remark
Show marketing remark (973 chars)
Freshly remodeled 2 bed/1 bath home, with a large bonus utility room that could act as a 3rd bedroom, cradled stately in the heart of San Angelo. This home is perfect for young families as the front porch looks out onto the Austin Elementary playground! Being right across the street from the elementary school and in a great neighborhood, you can have piece of mind when your child is able to walk themselves to school each morning. The large back yard is perfect for all pets and the location is easily accessible as it is a block away from Loop 306 in San Angelo. As you walk into this home, you immediately notice the refinished, original hardwood floors that flow throughout the house and into the kitchen. In the kitchen, durable tile floors give way to a newly built rustic wooden counter top that match the hardwood floors throughout other rooms in the house. Be the envy of your neighborhood while paying a fraction of the price as this home is priced to sell NOW!
-
2022-03-18$119,500 973-char remark
Show marketing remark (973 chars)
Freshly remodeled 2 bed/1 bath home, with a large bonus utility room that could act as a 3rd bedroom, cradled stately in the heart of San Angelo. This home is perfect for young families as the front porch looks out onto the Austin Elementary playground! Being right across the street from the elementary school and in a great neighborhood, you can have piece of mind when your child is able to walk themselves to school each morning. The large back yard is perfect for all pets and the location is easily accessible as it is a block away from Loop 306 in San Angelo. As you walk into this home, you immediately notice the refinished, original hardwood floors that flow throughout the house and into the kitchen. In the kitchen, durable tile floors give way to a newly built rustic wooden counter top that match the hardwood floors throughout other rooms in the house. Be the envy of your neighborhood while paying a fraction of the price as this home is priced to sell NOW!
-
2021-08-31soldstatus
ⓘ Source: listings_history table (triggers on properties + properties_extension) + one-shot
backfill from property_details.listing_events for pre-trigger history.
Tax reassessment forecast TX · Resets to sale price
- Current annual tax
- $2,382 · $198/mo
- Projected year-2 tax
- $2,469 · $206/mo
- Expected delta
- +$87/yr (+$7/mo · 3.6%)
ⓘ Screening estimate from a state-policy table — verify with the county assessor before closing.
Climate risk First Street
- Flood 1/10 Low FEMA zone X (unshaded) · 0% chance over 30 yrs
- Wildfire 6/10 Major
- Heat 7/10 Severe 7 d/yr ≥104°F today · 23 d/yr by 30 yrs out
- Wind 4/10 Moderate 12% chance of damaging wind over 30 yrs
- Air quality 1/10 Low 0 unhealthy d/yr today · 0 by 30 yrs out
Nearby sold comps map
Loading sold comps map…
Walkable amenities ~0.75 mi
Loading nearby amenities…
Taxation est. · year 1
- Rental income
- $17,503
- − Mortgage interest
- −$7,556
- − Property taxes
- −$2,382
- − Insurance
- −$674
- − Repairs & maintenance
- −$1,400
- − Management
- −$1,400
- − Depreciation
- −$3,924
- Taxable income
- $166
- Est. tax owed @ 24.0%
- −$40
- After-tax cash flow
- $2,242/yr
For passive investors: Depreciation is non-cash, so a rental often shows a tax loss while cash-flowing — sheltering income. Rental losses are passive: they offset passive income freely, and up to $25,000/yr can offset ordinary (W-2) income if you actively participate and your MAGI is under $100k (phasing out to $0 by $150k); unused losses carry forward. On sale, claimed depreciation is recaptured at up to 25%, and gains may owe capital-gains tax (a 1031 exchange can defer both). Figures are a year-1 estimate at your 24.0% rate — not tax advice; consult a CPA.
Schools (NCES district)
- District
- San Angelo ISD
- NCES district ID
- 4838700
- Math proficiency
- 27% ▼ -9.00%
- Reading proficiency
- 33% ▼ -3.00%
- Median HH income
- $43,501
- Composite
- 25.56/100
- National rank
- #7427
- State rank
- #627 of 826 in TX
Livability — San Angelo
- Score
- 73/100
- State rank
- #199
- US rank
- #5030
Category grades
Schools grade is shown separately in the Schools card above.
Census & demographics
- Census place
- San Angelo, TX
- County
- Tom Green County · 113,188 people
- City population
- 81,357
- Metro
- San Angelo, TX
- Population (ZIP)
- 31,831
- Household income
- $69,450
- Rent vs Own
- Severe rent burden
- 1034.0
Population outlook (Tom Green County) Hauer SSP2
- Today (2025)
- 135,110 people
- By 2030
- 144,090 · +6.6%
- By 2040
- 162,561 · +20.3%
- By 2050
- 182,158 · +34.8%
- By 2075
- 232,274 · +71.9%
- By 2100
- 268,218 · +98.5%
Race, ethnicity, and origin ACS 2023
- Neighborhood character
- Majority White (55%)
- Race & ethnicity
- White 55% Hispanic / Latino 41% Two or more races 17% Black 2%
- Hispanic origin (detail)
- Mexican 38%
- Common ancestry
- Lithuanian 3% Slovak 3% Iranian 1%
- Foreign-born
- 5% · Canada
- Languages at home
- 77% English-only · Spanish 21% German/W. Germanic 1%
Political lean MEDSL · Tom Green
- 2024 margin
- Solid R (+48.0) · D 25.5% · R 73.5% · Other 1.0%
- 2008→2024 swing
- -6.3pp toward R · 2008: -41.7pp · 2024: -48.0pp
- All cycles
- 2024: R+48.0 2020: R+44.4 2016: R+47.9 2012: R+47.9 2008: R+41.7
Not yet ingested
- Civics
- —
Market trends
- HPI YoY
- ▲ 47.96%
- Current HPI
- 798.58
- Rent YoY
- ▲ 5.78%
- Metro
- San Angelo, TX
- State GDP YoY
- ▲ 3.95%
- F500 in state
- 110
Industry mix (Fortune 500 HQ in TX)
| Industry | F500 HQs | Revenue |
|---|---|---|
| Energy | 16 | $1,198B |
|
||
| Technology | 5 | $198B |
|
||
| Engineering / Construction | 4 | $72B |
|
||
| Energy Services | 3 | $60B |
|
||
| Utilities | 3 | $41B |
|
||
| Healthcare | 2 | $330B |
|
||
Price history
+12.9% since first listed11 events — show timeline
- 2026-02-10 Price Changed $134,900 SAAR TX
- 2026-01-18 Relisted — SAAR TX
- 2025-11-21 Price Changed $136,000 SAAR TX
- 2025-08-19 Price Changed $138,000 SAAR TX
- 2025-07-14 Listed $139,999 SAAR TX
- 2022-06-17 Sold (Public Records) — Public Records
- 2022-06-17 Sold (Public Records) — Public Records
- 2022-06-10 Sold (MLS) — SAAR TX
- 2022-04-22 Delisted — SAAR TX
- 2022-03-18 Listed $119,500 SAAR TX
- 2021-08-31 Sold (Public Records) — Public Records
Property tax history
+9.3%/yrLatest (2025): $2,382 · +14.8% YoY. Source: county tax records.
Cash-flow waterfall
monthlySold comps — $/sqft
last 12 mo · ≤1 miLoading sold comps…