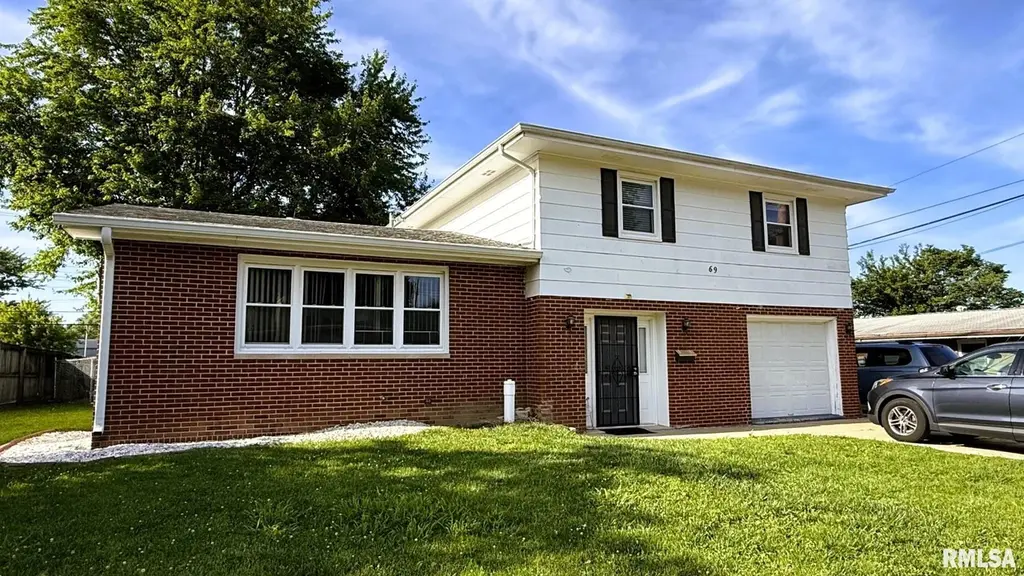
69 Nottingham Rd · Springfield, IL
Flood risk 1/10 · Minimal
- FEMA flood zone
- X (unshaded)
- Chance of flooding over 30 yrs
- 0.0%
- Est. flood insurance / yr
- $473 – $860
Fire risk 1/10 · Minimal
- Est. fire insurance / yr
- $804 – $1,492
Heat risk 4/10 · Minor
- Hot days now (above 105°F)
- 7 days/yr
- Hot days in 30 yrs
- 20 days/yr
Wind risk 2/10 · Minimal
- Chance of severe wind over 30 yrs
- 1.0%
Air-quality risk 2/10 · Minimal
- Unhealthy air days now
- 1 days/yr
- Unhealthy air days in 30 yrs
- 2 days/yr
Risk factors via First Street. Map © Google.
Why this score? — see what drove the D- grade
The composite is a weighted blend of 9 inputs, each scored 0–100. Each bar is that input's sub-score; the figure is the points it added to the 100-point composite (weight × sub-score).
- Cash flow +13.4/30.0
- ARV discount +4.8/15.0
- Rent growth +4.1/5.0
- DSCR +4.0/10.0
- Livability +4.0/5.0
- 1% rule +3.6/10.0
- Condition / age +2.5/5.0
- Schools +1.7/10.0
- Appreciation +0.0/10.0
$219,900
🖨 Deal sheet (PDF) 📄 Offer letter ✓ Due diligence
Listing remarks MLS
Super cute, remodeled home in popular Sherwood subdivision. Freshly painted, new fixtures, flooring, windows(2 yrs.), updated electrical, new kitchen sink, trim and backsplash, new bath, plumbing, tub, vanity and flooring. Nicely landscaped large fenced in backyard with patio. Move-in ready and pre-inspected too!!
Key facts
- 0.24 acre lot
- Garage
- Built 1961
Property features AI
Finance
- HOA & community: No association fee
Exterior
- Parking: Attached garage (1 car)
- Utilities: Public water; Public sewer
- Home design: Single-family residence; Residential zoning; 70 x 150 lot dimensions; Shingle roof
- Construction: Built in 1961; Shingle roof
- Exterior features: Fenced yard; Shed(s); Replacement windows; Level lot
Interior
- Kitchen: Dishwasher; Disposal; Microwave; Refrigerator
- Bedrooms: 3 bedrooms; Primary bedroom on upper level (approx. 14.3 x 11.7 ft, carpet, egress window); Second bedroom on upper level (approx. 12.5 x 11.6 ft, carpet, egress window); Third bedroom on upper level (approx. 12.6 x 12 ft, carpet, egress window)
- Flooring: Carpet in main living areas and bedrooms; Vinyl in kitchen; Laminate in family room; Other flooring in basement spaces
- Bathrooms: 2 full bathrooms
- Heating & cooling: Central air; Forced air heating
- Interior features: Cable available; Ceiling fans; High-speed internet; Partial basement
- Laundry & utility: No specific laundry appliances listed
Neighborhood map
What this means for you Summary
Snapshot
- This is a 3-bed/2.0-bath single-family listed at $220k.
Deal economics
- At list price, monthly cash flow is $2 ($29/yr) — positive.
- The deal already cash-flows at list — no discount required.
- To meet the 1% rule (rent ≥ 1% of price), the offer needs to be $190k (13.7% below list).
- Recommended offer: $190k (13.7% below list) — sets the bar for 1% rule.
- Cap rate 6.3% vs local median 4.9% in Springfield — meaningfully above typical; check what's discounted (condition, days-on-market, listing class) to confirm the premium yield is real.
Location & tenants
- Location reads 79/100 on livability (#122 in IL, #2,138 nationally) — a middle-class / working-renter tenant base. Strengths: amenities A+, commute A+, cost of living A+; Watch: crime F.
- Springfield SD 186 (urban): math 17% / reading 22% proficiency, ranked #438 of 620 in IL (top 71%) — low school quality limits family demand, transient renter base, plan for 1-2y turnover; 64% free/reduced lunch — lower-income household profile, screen leases tightly.
- Zoned schools: Sandburg Elem School (math 27% / reading 42%, grade F, #517 of 2,056 statewide, top 28%, 281 students, 0% FRL); Benjamin Franklin Middle School (math 23% / reading 31%, grade F, #302 of 665 statewide, top 47%, 713 students, 0% FRL); Springfield Southeast High Sch (math 17% / reading 22%, grade F, #397 of 693 statewide, top 61%, 1,261 students, 0% FRL) — zoned schools average 0% FRL vs 64% district-wide (64 pts lower); this property's tenant base skews higher-income than the district average.
- Market conditions: Rents rising fast (+6.3%/yr); 183 active listings in the ZIP; 2 comparable units currently listed for rent nearby; 225 units permitted in Sangamon County in 2024 (48 in 5+ unit buildings).
- This rent runs 33% of the median local income ($70k/yr) — at the standard rent-burdened threshold; future hikes will face affordability resistance.
Forward outlook
- Local home prices are declining (-3.0%/yr); year-one equity from $2k of loan paydown is wiped out by about $7k of value loss. Plan a longer hold.
- Sangamon County population projected to shrink 9% by 2050 — rents likely to lag national; underwrite the cash flow, not the appreciation.
Negotiation context
- It's been on market 15 days — a 2% lower offer ($217k) is reasonable based on typical stale-listing flexibility.
- Current owner paid $132k; list at $220k implies a 67% gain — meaningful room to come down on a strong offer.
Questions for the listing agent
- Built in 1961 — when were the roof, HVAC, electrical panel, plumbing, and water heater last replaced?
- Is there a deadline driving the sale (1031 exchange, divorce, estate, relocation)? That informs how much negotiation room exists.
- Schools are D-rated, which usually means shorter tenancies and higher turnover. Who's the typical renter profile here, and what's been the actual vacancy rate?
- Crime grade is F in this area — have there been break-ins, vandalism, or insurance claims at this property in the last 3 years? What carrier currently insures it and at what premium?
- The area grade is low — what's the realistic commute time and amenity access for the typical tenant pool here? Any planned neighborhood developments (good or bad) we should know about?
- What's the average days-on-market for RENTAL listings here right now (not sales)? A rising rental-DOM trend means longer vacancies and softer asking-rent achievability than the comps imply.
- What's the recent tenant-quality profile in this submarket — average credit score on applications, eviction rate, late-payment / NSF rate, and stable-employment percentage? A property-management company in the area should have these aggregated.
- How much new for-sale + rental construction is in the pipeline within 1–3 miles? Heavy new supply typically softens prices + rents 12–24 months out; constrained supply supports both.
Investment metrics
- 1% rule
- 0.86% ✗
- Cap rate
- 6.31%
- Cash-on-cash
- 0.05%
- DSCR
- 1.00
- GRM
- 9.7
CMA / ARV
- ARV (on-the-fly)
- $207,480
- Comps found
- 12
Show comp detail 12 sales within ~0.75 mi
| Address | Dist | Beds/Ba | Sqft | Sold | Price | $/sf | Match |
|---|---|---|---|---|---|---|---|
| 53 Friars Ln | 0.22mi | 3/2.0 | 1,866 (+2%) | 2mo | $212,000 | $114 | 84 |
| 56 Archer Ave | 0.20mi | 3/1.0 | 1,760 (-3%) | 6mo | $200,000 | $114 | 76 |
| 44 Locksley Ln | 0.31mi | 2/2.0 (-1) | 1,800 (-1%) | 4mo | $195,000 | $108 | 75 |
| 1705 Reed Ave | 0.45mi | 2/2.0 (-1) | 1,800 (-1%) | 2mo | $177,000 | $98 | 71 |
| 2317 Grinnell Dr | 0.41mi | 3/2.0 | 1,922 (+6%) | 1mo | $222,000 | $116 | 70 |
| 40 Foresters Ln | 0.26mi | 3/2.0 | 2,034 (+12%) | 0mo | $232,500 | $114 | 68 |
| 2337 Grinnell Dr | 0.43mi | 3/1.5 | 1,691 (-7%) | 3mo | $190,000 | $112 | 63 |
| 233 Deer Head Ln | 0.58mi | 3/3.0 | 1,855 (+2%) | 5mo | $256,000 | $138 | 62 |
| 2732 S Welch Ave | 0.45mi | 3/1.0 | 1,677 (-8%) | 2mo | $165,000 | $98 | 60 |
| 2357 Grinnell Dr | 0.46mi | 3/2.0 | 2,012 (+10%) | 4mo | $245,000 | $122 | 58 |
| 2054 Brentwood Dr | 0.58mi | 3/2.0 | 1,996 (+10%) | 5mo | $200,000 | $100 | 52 |
| 3132 Elmhurst Dr | 0.64mi | 3/2.5 | 2,048 (+12%) | 3mo | $235,000 | $115 | 45 |
Match score weights: distance 35% · size 25% · config 20% · recency 20%. Top-matched comps best support the ARV.
Projected returns pro-forma
-3.0% appreciation · 6.32% rent growth · sell at horizon
- IRR
- -12.6%
- Equity multiple
- 0.53×
- Total profit
- $-28,918
- Equity at exit
- $32,788
- IRR
- 0.8%
- Equity multiple
- 1.06×
- Total profit
- $3,843
- Equity at exit
- $19,013
Cash invested: $61,572 (down + closing). Projections, not guarantees.
Landlord ↔ Tenant lean methodology
- Overall (STATE)
- 43 Moderately Tenant-Leaning
- State Illinois
- 43 Moderately Tenant-Leaning · D+7
- County
- — inherits STATE
- City
- — inherits STATE
ZIP-level market 62704
- Home prices YoY
- -31.1%
- Rents YoY
- 6.3%
- Active inventory
- 183
- Price-to-rent
- 9.7×
Monthly cashflow live
- Estimated rent
- $1,897 medium interval (Pro) →
- Mortgage (P&I)
- −$1,153
- Tax from tax record
- −$252 /mo · $3,020/yr
- Insurance
- −$92
- HOA
- −$0
- Vacancy / Maint / Mgmt
- −$398
- Net cashflow
- $2
Break-even live
Sensitivity live
| Price | -10% $127 | -5% $65 | +0% $2 | +5% $-60 | +10% $-122 |
|---|---|---|---|---|---|
| Rent | -10% $-147 | -5% $-73 | +0% $2 | +5% $77 | +10% $152 |
| Rate | -1.0pp $113 | -0.5pp $58 | base $2 | +0.5pp $-55 | +1.0pp $-113 |
UW: 25.0% down · 7.5% · 30yr · 1.5% tax · 5.0% vac · 8.0% maint · 8.0% mgmt
Financing live
Cash to close
- Down payment
- $54,975
- Closing costs
- $6,597
- Reserves months
- —
- Total cash needed
- —
Loan-product check · same deal, 3 products live
Conventional
25% down · 7.5% · 30yr
- Down + closing
- —
- Monthly P&I
- —
- Monthly cashflow
- —
- DSCR
- —
- Eligible?
- —
Personal DTI + credit; lowest rate.
DSCR
20% down · 8.5% · 30yr
- Down + closing
- —
- Monthly P&I
- —
- Monthly cashflow
- —
- DSCR
- —
- Eligible?
- —
No personal income docs; deal must DSCR.
Hard money
10% down · 12.0% · 12mo
- Down + closing
- —
- Monthly P&I
- —
- Monthly cashflow
- —
- DSCR
- —
- Eligible?
- —
Short-term bridge; refi at stabilization.
Rent comps 2 comps
| Address | Beds | Baths | Sqft | Rent | $/sqft | DOM | Units | Dist |
|---|---|---|---|---|---|---|---|---|
| 2 Robinhood Ln Springfield, IL | 3.0 | 2.5 | 2400 | $2,495 | $1.04 | 22d | 1 | 0.07mi |
| 1666 Seven Pines Rd Springfield, IL | 1.0–4.0 | 1.0–1.5 | 1025 | $1,383 | $1.35 | 22d | 1 | 0.51mi |
Listing history 22 events
-
2026-06-22days on market $219,900 Active 15 DOM
-
2026-06-19days on market $219,900 Active 13 DOM
-
2026-06-18days on market $219,900 Active 12 DOM
-
2026-06-17days on market $219,900 Active 11 DOM
-
2026-06-16days on market $219,900 Active 10 DOM
-
2026-06-15days on market $219,900 Active 9 DOM
-
2026-06-14days on market $219,900 Active 7 DOM
-
2026-06-13days on market $219,900 Active 6 DOM
-
2026-06-10days on market $219,900 Active 4 DOM
-
2026-06-09days on market $219,900 Active 3 DOM
-
2026-06-08days on market $219,900 Active 2 DOM
-
2026-06-07statusdays on market $219,900 Active 1 DOM
-
2026-06-05days on market $219,900 Coming Soon 8 DOM
-
2026-06-03days on market $219,900 Coming Soon 7 DOM
-
2026-06-02days on market $219,900 Coming Soon 6 DOM
-
2026-06-01days on market $219,900 Coming Soon 5 DOM
-
2026-05-31days on market $219,900 Coming Soon 4 DOM
-
2026-05-30days on market $219,900 Coming Soon 3 DOM
-
2026-05-28historical $219,900
-
2018-10-15soldstatus $131,500
-
2018-10-12soldstatus $131,500 315-char remark
Show marketing remark (315 chars)
Super cute, remodeled home in popular Sherwood subdivision. Freshly painted, new fixtures, flooring, windows(2 yrs.), updated electrical, new kitchen sink, trim and backsplash, new bath, plumbing, tub, vanity and flooring. Nicely landscaped large fenced in backyard with patio. Move-in ready and pre-inspected too!!
-
2018-08-15$129,500 315-char remark
Show marketing remark (315 chars)
Super cute, remodeled home in popular Sherwood subdivision. Freshly painted, new fixtures, flooring, windows(2 yrs.), updated electrical, new kitchen sink, trim and backsplash, new bath, plumbing, tub, vanity and flooring. Nicely landscaped large fenced in backyard with patio. Move-in ready and pre-inspected too!!
ⓘ Source: listings_history table (triggers on properties + properties_extension) + one-shot
backfill from property_details.listing_events for pre-trigger history.
Tax reassessment forecast IL · Partial reset (capped growth)
- Current annual tax
- $3,020 · $252/mo
- Projected year-2 tax
- $4,006 · $334/mo
- Expected delta
- +$986/yr (+$82/mo · 32.7%)
ⓘ Screening estimate from a state-policy table — verify with the county assessor before closing.
Climate risk First Street
- Flood 1/10 Low FEMA zone X (unshaded) · 0% chance over 30 yrs
- Wildfire 1/10 Low
- Heat 4/10 Moderate 7 d/yr ≥105°F today · 20 d/yr by 30 yrs out
- Wind 2/10 Low 100% chance of damaging wind over 30 yrs
- Air quality 2/10 Low 1 unhealthy d/yr today · 2 by 30 yrs out
Nearby sold comps map
Loading sold comps map…
Walkable amenities ~0.75 mi
Loading nearby amenities…
Taxation est. · year 1
- Rental income
- $22,767
- − Mortgage interest
- −$12,318
- − Property taxes
- −$3,020
- − Insurance
- −$1,100
- − Repairs & maintenance
- −$1,821
- − Management
- −$1,821
- − Depreciation
- −$6,397
- Taxable loss
- −$3,710
- Est. tax savings @ 24.0%
- +$890
- After-tax cash flow
- $919/yr
For passive investors: Depreciation is non-cash, so a rental often shows a tax loss while cash-flowing — sheltering income. Rental losses are passive: they offset passive income freely, and up to $25,000/yr can offset ordinary (W-2) income if you actively participate and your MAGI is under $100k (phasing out to $0 by $150k); unused losses carry forward. On sale, claimed depreciation is recaptured at up to 25%, and gains may owe capital-gains tax (a 1031 exchange can defer both). Figures are a year-1 estimate at your 24.0% rate — not tax advice; consult a CPA.
Schools (NCES district)
- District
- Springfield SD 186
- NCES district ID
- 1737080
- Math proficiency
- 17% ▼ -7.00%
- Reading proficiency
- 22% ▼ -5.00%
- Median HH income
- $43,744
- Composite
- 16.89/100
- National rank
- #9142
- State rank
- #438 of 620 in IL
Livability — Springfield
- Score
- 79/100
- State rank
- #122
- US rank
- #2138
Category grades
Schools grade is shown separately in the Schools card above.
Census & demographics
- Census place
- Springfield, IL
- County
- Sangamon County · 115,414 people
- City population
- 59,955
- Metro
- Springfield, IL
- Population (ZIP)
- 40,046
- Household income
- $69,976
- Rent vs Own
- Severe rent burden
- 1529.0
Population outlook (Sangamon County) Hauer SSP2
- Today (2025)
- 198,317 people
- By 2030
- 196,127 · -1.1%
- By 2040
- 188,664 · -4.9%
- By 2050
- 179,624 · -9.4%
- By 2075
- 155,027 · -21.8%
- By 2100
- 122,588 · -38.2%
Race, ethnicity, and origin ACS 2023
- Neighborhood character
- Predominantly White (74%)
- Race & ethnicity
- White 74% Black 15% Two or more races 5% Hispanic / Latino 4% Asian 4%
- Common ancestry
- Lithuanian 2% Romanian 2% Slovak 2%
- Foreign-born
- 6% · Canada, China, Vietnam
- Languages at home
- 92% English-only · Spanish 2% Other Indo-European 1% Tagalog/Filipino 1%
Political lean MEDSL · Sangamon
- 2024 margin
- Toss-up / Even · D 46.6% · R 51.6% · Other 1.8%
- 2008→2024 swing
- -9.3pp toward R · 2008: 4.4pp · 2024: -5.0pp
- All cycles
- 2024: R+5.0 2020: R+4.4 2016: R+9.4 2012: R+8.7 2008: D+4.4
Not yet ingested
- Civics
- —
Market trends
- HPI YoY
- ▼ -70.79%
- Current HPI
- 156.7086
- Rent YoY
- ▲ 6.32%
- Metro
- Springfield, IL
- State GDP YoY
- ▲ 1.59%
- F500 in state
- 60
Industry mix (Fortune 500 HQ in IL)
| Industry | F500 HQs | Revenue |
|---|---|---|
| Insurance | 4 | $201B |
|
||
| Consumer Goods | 4 | $87B |
|
||
| Industrial Machinery | 3 | $64B |
|
||
| Healthcare | 2 | $55B |
|
||
| Retail / Pharmacy | 1 | $148B |
|
||
| Agriculture / Food | 1 | $86B |
|
||
Price history
+69.8% since first listed4 events — show timeline
- 2026-05-28 Coming Soon $219,900 RMLSA as Distributed by MLS Grid
- 2018-10-15 Sold (Public Records) $131,500 Public Records
- 2018-10-12 Sold (MLS) $131,500 RMLSA as Distributed by MLS Grid
- 2018-08-15 Listed $129,500 RMLSA as Distributed by MLS Grid
Property tax history
+2.3%/yrLatest (2018): $3,020 · +2.5% YoY. Source: county tax records.
Cash-flow waterfall
monthlySold comps — $/sqft
last 12 mo · ≤1 miLoading sold comps…