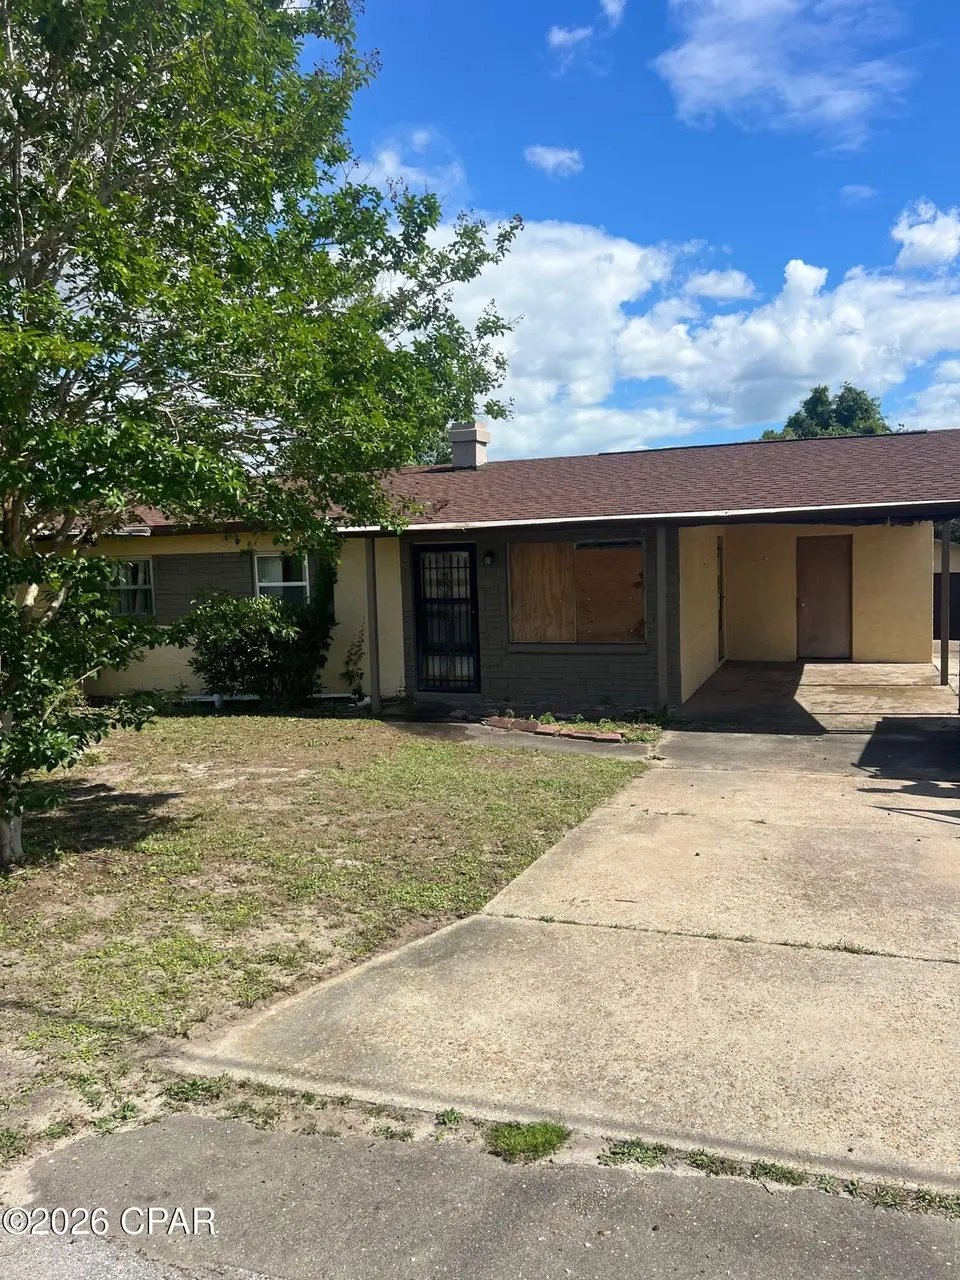
1404 E 9th St · Panama City, FL
Flood risk 6/10 · Moderate
- FEMA flood zone
- X (unshaded)
- Chance of flooding over 30 yrs
- 0.7%
- Est. flood insurance / yr
- $507 – $1,088
Fire risk 2/10 · Minimal
- Est. fire insurance / yr
- $947 – $1,759
Heat risk 10/10 · Severe
- Hot days now (above 105°F)
- 7 days/yr
- Hot days in 30 yrs
- 22 days/yr
Wind risk 9/10 · Severe
- Chance of severe wind over 30 yrs
- 99.0%
Air-quality risk 1/10 · Minimal
- Unhealthy air days now
- 0 days/yr
- Unhealthy air days in 30 yrs
- 0 days/yr
Risk factors via First Street. Map © Google.
Why this score? — see what drove the B+ grade
The composite is a weighted blend of 9 inputs, each scored 0–100. Each bar is that input's sub-score; the figure is the points it added to the 100-point composite (weight × sub-score).
- Cash flow +30.0/30.0
- ARV discount +15.0/15.0
- DSCR +10.0/10.0
- 1% rule +8.3/10.0
- Schools +4.3/10.0
- Livability +3.6/5.0
- Rent growth +2.6/5.0
- Condition / age +2.5/5.0
- Appreciation +0.0/10.0
$149,900
🖨 Deal sheet (PDF) 📄 Offer letter ✓ Due diligence
Listing remarks
Opportunity awaits with this spacious 4 bedroom, 2 bathroom situated on an oversized lot near Panama City. Offering 1,504 square feet of living space, this home features tile flooring, a bright living and dining room combination, and a large family room with a cozy fireplace. The open kitchen includes a breakfast bar and overlooks the main living areas, creating a functional layout with plenty of potential. The primary suite features a private bath, while the additional bedrooms are spacious and filled with natural light. Outside, the detached garage provides added storage, workspace, or parking options, and the oversized yard offers room to expand or create your ideal outdoor space. Conven
Key facts
- Large family room
- Oversized yard
- Private bath
Tags
Property features AI
Finance
- HOA & community: Short-term rentals allowed
Exterior
- Parking: Attached 2-car garage; 2 covered parking spaces
- Utilities: Electricity available
- Home design: Single-story residence; Residential single-family zoning
- Construction: Concrete and stucco exterior; Composition/shingle roof
- Exterior features: Open porch/patio; Chain link fencing; Paved lot
Interior
- Kitchen: Kitchen on first floor
- Bedrooms: Primary bedroom (first floor)
- Bathrooms: 2 full bathrooms
- Heating & cooling: Central heating (electric); Central air conditioning
- Interior features: Open porch
Neighborhood map
What this means for you Summary
Snapshot
- This is a 4-bed/2.0-bath single-family listed at $150k.
Deal economics
- At list price, monthly cash flow is $571 ($7k/yr) — positive.
- The deal already cash-flows at list — no discount required.
- Meets the 1% rule at list price ($2k rent vs $150k).
- Recommended offer: $145k (3.0% below list) — sets the bar for market timing.
- Cap rate 10.9% vs local median 4.7% in Panama City — top-decile yield for the area; either an underpriced asset or a hidden risk that comps aren't pricing in. Stress-test before assuming the spread holds.
Location & tenants
- Location reads 72/100 on livability (#350 in FL) — a middle-class / working-renter tenant base. Strengths: cost of living A+, housing A+, health & safety A+; Watch: crime F, amenities F, commute F.
- Bay (suburban): math 51% / reading 51% proficiency, ranked #29 of 73 in FL (top 40%) — acceptable for families but not a draw, mixed tenant base, ~2y average lease.
- Market conditions: Rents flat; 261 active listings in the ZIP; 4 comparable units currently listed for rent nearby; rentals at typical pace (median 22d on market — plan ~3-4 weeks tenant-placement turnaround); 2,473 units permitted in Bay County in 2024 (559 in 5+ unit buildings).
- At $2,000/mo this rent would consume 46% of the median local household income ($53k/yr) (locally 935% of renters already pay >50% of income on rent) — very limited rent-growth headroom before tenants either downsize or default.
Forward outlook
- Local home prices are declining (-3.0%/yr); year-one equity from $1k of loan paydown is wiped out by about $4k of value loss. Plan a longer hold.
- Bay County population projected at +24% by 2050 — long-run rental-demand tailwind backs the buy-and-hold thesis.
- At projected returns (-3.0% appreciation + 0.5% rent growth), your $42k cash investment doubles in ~10 years — after that, you're playing with house money.
Negotiation context
- It's been on market 37 days — a 3% lower offer ($145k) is reasonable based on typical stale-listing flexibility.
- 2 sale attempts since 2y ago; this cycle's ask has dropped $10k (6%) from the opening price — seller is motivated, your offer sets the floor, not the list.
Risks & watch-outs
- Climate carrying-cost: major flood risk; severe wind risk, 99% chance of damaging wind over 30y; extreme-heat days projected 7→22/yr by 2055 (HVAC capex compounding) — expect insurance premiums to compound above CPI over the hold.
Questions for the listing agent
- It's been on market 37 days. Have you received any prior offers? Is the seller open to a 3% concession, seller financing, or rate buy-down credit?
- Built in 1962 — when were the roof, HVAC, electrical panel, plumbing, and water heater last replaced?
- Is there a deadline driving the sale (1031 exchange, divorce, estate, relocation)? That informs how much negotiation room exists.
- Schools are B-rated — typically a magnet for longer-tenancy family renters. What's the average tenant stay here, and is there a school-zone premium baked into asking?
- Crime grade is F in this area — have there been break-ins, vandalism, or insurance claims at this property in the last 3 years? What carrier currently insures it and at what premium?
- What's the average days-on-market for RENTAL listings here right now (not sales)? A rising rental-DOM trend means longer vacancies and softer asking-rent achievability than the comps imply.
- What's the recent tenant-quality profile in this submarket — average credit score on applications, eviction rate, late-payment / NSF rate, and stable-employment percentage? A property-management company in the area should have these aggregated.
- How much new for-sale + rental construction is in the pipeline within 1–3 miles? Heavy new supply typically softens prices + rents 12–24 months out; constrained supply supports both.
Investment metrics
- 1% rule
- 1.33% ✓
- Cap rate
- 10.86%
- Cash-on-cash
- 16.33%
- DSCR
- 1.73
- GRM
- 6.2
CMA / ARV
- ARV (median comp)
- $231,503
- List price
- $149,900
- Delta
- -35.25%
- Verdict
- UNDERPRICED
- Comps
- 20 within 1.0 mi
Show comp detail 12 sales within ~0.75 mi
| Address | Dist | Beds/Ba | Sqft | Sold | Price | $/sf | Match |
|---|---|---|---|---|---|---|---|
| 729 Kirklin Ave | 0.24mi | 3/2.0 (-1) | 1,402 (-7%) | 1mo | $245,900 | $175 | 72 |
| 601 Cypress Ave | 0.40mi | 3/2.0 (-1) | 1,500 (-0%) | 7mo | $385,000 | $257 | 70 |
| 1807 E 9th St | 0.28mi | 3/2.0 (-1) | 1,375 (-9%) | 2mo | $320,000 | $233 | 66 |
| 810 Maple Ave | 0.33mi | 3/2.0 (-1) | 1,552 (+3%) | 10mo | $200,000 | $129 | 66 |
| 706 Kirklin Ave | 0.33mi | 3/2.0 (-1) | 1,380 (-8%) | 1mo | $265,000 | $192 | 65 |
| 804 Kirklin Ave | 0.26mi | 3/2.0 (-1) | 1,375 (-9%) | 7mo | $313,000 | $228 | 63 |
| 605 Maple Ave | 0.45mi | 3/2.0 (-1) | 1,405 (-7%) | 2mo | $268,000 | $191 | 62 |
| 918 N Center Ave | 0.70mi | 4/2.0 | 1,542 (+2%) | 2mo | $246,620 | $160 | 61 |
| 1409 E 6th Ct | 0.30mi | 3/2.0 (-1) | 1,320 (-12%) | 3mo | $249,000 | $189 | 58 |
| 722 Kirklin Ave | 0.28mi | 3/2.0 (-1) | 1,292 (-14%) | 14mo | $250,000 | $193 | 47 |
| 809 E 10th Ct | 0.52mi | 4/2.0 | 1,300 (-14%) | 8mo | $262,950 | $202 | 46 |
| 2125 E 7th St | 0.56mi | 3/2.0 (-1) | 1,316 (-12%) | 14mo | $229,000 | $174 | 36 |
Match score weights: distance 35% · size 25% · config 20% · recency 20%. Top-matched comps best support the ARV.
Projected returns pro-forma
-3.0% appreciation · 0.45% rent growth · sell at horizon
- IRR
- 4.5%
- Equity multiple
- 1.17×
- Total profit
- $7,091
- Equity at exit
- $22,351
- IRR
- 11.5%
- Equity multiple
- 1.80×
- Total profit
- $33,552
- Equity at exit
- $12,961
Cash invested: $41,972 (down + closing). Projections, not guarantees.
Landlord ↔ Tenant lean methodology
- Overall (STATE)
- 87 Strongly Landlord-Friendly
- State Florida
- 87 Strongly Landlord-Friendly · R+3
- County
- — inherits STATE
- City
- — inherits STATE
ZIP-level market 32401
- Home prices YoY
- -32.9%
- Rents YoY
- 0.5%
- Active inventory
- 261
- Price-to-rent
- 6.2×
Monthly cashflow live
- Estimated rent
- $2,000 medium interval (Pro) →
- Mortgage (P&I)
- −$786
- Tax from tax record
- −$161 /mo · $1,926/yr
- Insurance
- −$62
- HOA
- −$0
- Vacancy / Maint / Mgmt
- −$420
- Net cashflow
- $571
Break-even live
Sensitivity live
| Price | -10% $656 | -5% $614 | +0% $571 | +5% $529 | +10% $486 |
|---|---|---|---|---|---|
| Rent | -10% $413 | -5% $492 | +0% $571 | +5% $650 | +10% $729 |
| Rate | -1.0pp $647 | -0.5pp $609 | base $571 | +0.5pp $532 | +1.0pp $493 |
UW: 25.0% down · 7.5% · 30yr · 1.5% tax · 5.0% vac · 8.0% maint · 8.0% mgmt
Financing live
Cash to close
- Down payment
- $37,475
- Closing costs
- $4,497
- Reserves months
- —
- Total cash needed
- —
Loan-product check · same deal, 3 products live
Conventional
25% down · 7.5% · 30yr
- Down + closing
- —
- Monthly P&I
- —
- Monthly cashflow
- —
- DSCR
- —
- Eligible?
- —
Personal DTI + credit; lowest rate.
DSCR
20% down · 8.5% · 30yr
- Down + closing
- —
- Monthly P&I
- —
- Monthly cashflow
- —
- DSCR
- —
- Eligible?
- —
No personal income docs; deal must DSCR.
Hard money
10% down · 12.0% · 12mo
- Down + closing
- —
- Monthly P&I
- —
- Monthly cashflow
- —
- DSCR
- —
- Eligible?
- —
Short-term bridge; refi at stabilization.
Rent comps 4 comps
| Address | Beds | Baths | Sqft | Rent | $/sqft | DOM | Units | Dist |
|---|---|---|---|---|---|---|---|---|
| 329 N Palo Alto Ave Panama City, FL | 3.0 | 2.0 | 1300 | $1,950 | $1.50 | 14d | 1 | 0.87mi |
| 300 Mercedes Ave Unit 1523335P Panama City, FL | 3.0 | 2.0 | 1194 | $3,807 | $3.19 | 22d | 1 | 0.92mi |
| 2623 E 16th St Unit A Panama City, FL | 3.0 | 2.0 | 1250 | $1,625 | $1.30 | 22d | 1 | 1.26mi |
| 222 N Gray Ave Panama City, FL | 3.0 | 2.0 | 1953 | $1,650 | $0.84 | 22d | 1 | 1.27mi |
Listing history 23 events
-
2026-06-21days on market $149,900 Active 37 DOM
-
2026-06-19days on market $149,900 Active 35 DOM
-
2026-06-18days on market $149,900 Active 34 DOM
-
2026-06-17days on market $149,900 Active 33 DOM
-
2026-06-16days on market $149,900 Active 32 DOM
-
2026-06-15days on market $149,900 Active 31 DOM
-
2026-06-14days on market $149,900 Active 29 DOM
-
2026-06-13days on market $149,900 Active 28 DOM
-
2026-06-10days on market $149,900 Active 26 DOM
-
2026-06-09days on market $149,900 Active 25 DOM
-
2026-06-08days on market $149,900 Active 24 DOM
-
2026-06-07days on market $149,900 Active 23 DOM
-
2026-06-05days on market $149,900 Active 20 DOM
-
2026-06-03days on market $149,900 Active 19 DOM
-
2026-06-03price $149,900 Active 18 DOM
-
2026-06-02days on market $159,900 Active 18 DOM
-
2026-06-01days on market $159,900 Active 17 DOM
-
2026-05-31days on market $159,900 Active 16 DOM
-
2026-05-30days on market $159,900 Active 15 DOM
-
2026-05-15$159,900 Active 1056-char remark
-
2024-07-26price $190,000
-
2024-03-29price $195,000
-
2024-02-03$200,000 Active
ⓘ Source: listings_history table (triggers on properties + properties_extension) + one-shot
backfill from property_details.listing_events for pre-trigger history.
Tax reassessment forecast FL · Resets to sale price
- Current annual tax
- $1,926 · $161/mo
- Projected year-2 tax
- $1,926 · $161/mo
- Expected delta
- $0/yr ($0/mo · 0.0%)
ⓘ Screening estimate from a state-policy table — verify with the county assessor before closing.
Climate risk First Street
- Flood 6/10 Major FEMA zone X (unshaded) · 70% chance over 30 yrs
- Wildfire 2/10 Low
- Heat 10/10 Extreme 7 d/yr ≥105°F today · 22 d/yr by 30 yrs out
- Wind 9/10 Extreme 99% chance of damaging wind over 30 yrs
- Air quality 1/10 Low 0 unhealthy d/yr today · 0 by 30 yrs out
Nearby sold comps map
Loading sold comps map…
Walkable amenities ~0.75 mi
Loading nearby amenities…
Taxation est. · year 1
- Rental income
- $24,002
- − Mortgage interest
- −$8,397
- − Property taxes
- −$1,926
- − Insurance
- −$750
- − Repairs & maintenance
- −$1,920
- − Management
- −$1,920
- − Depreciation
- −$4,361
- Taxable income
- $4,729
- Est. tax owed @ 24.0%
- −$1,135
- After-tax cash flow
- $5,718/yr
For passive investors: Depreciation is non-cash, so a rental often shows a tax loss while cash-flowing — sheltering income. Rental losses are passive: they offset passive income freely, and up to $25,000/yr can offset ordinary (W-2) income if you actively participate and your MAGI is under $100k (phasing out to $0 by $150k); unused losses carry forward. On sale, claimed depreciation is recaptured at up to 25%, and gains may owe capital-gains tax (a 1031 exchange can defer both). Figures are a year-1 estimate at your 24.0% rate — not tax advice; consult a CPA.
Schools (NCES district)
- District
- Bay
- NCES district ID
- 1200090
- Math proficiency
- 51% ▼ -8.00%
- Reading proficiency
- 51% ▼ -7.00%
- Median HH income
- $47,740
- Composite
- 43.41/100
- National rank
- #3014
- State rank
- #29 of 73 in FL
Livability — Panama City
- Score
- 72/100
- State rank
- #350
- US rank
- #5823
Category grades
Schools grade is shown separately in the Schools card above.
Census & demographics
- Census place
- Panama City, FL
- County
- Bay County · 163,593 people
- City population
- 91,445
- Metro
- Panama City, FL
- Population (ZIP)
- 18,947
- Household income
- $52,523
- Rent vs Own
- Severe rent burden
- 935.0
Population outlook (Bay County) Hauer SSP2
- Today (2025)
- 206,264 people
- By 2030
- 217,740 · +5.6%
- By 2040
- 238,738 · +15.7%
- By 2050
- 255,545 · +23.9%
- By 2075
- 288,295 · +39.8%
- By 2100
- 288,638 · +39.9%
Race, ethnicity, and origin ACS 2023
- Neighborhood character
- Diverse neighborhood (Simpson 0.57)
- Race & ethnicity
- White 60% Black 23% Hispanic / Latino 11% Two or more races 8% Asian 2%
- Hispanic origin (detail)
- Mexican 5% Puerto Rican 2%
- Common ancestry
- Italian 2% Lithuanian 2% Slovak 2%
- Foreign-born
- 9% · Canada, Vietnam
- Languages at home
- 89% English-only · Spanish 8% Other Indo-European 1% German/W. Germanic 1%
Political lean MEDSL · Bay
- 2024 margin
- Solid R (+47.4) · D 25.8% · R 73.1% · Other 1.1%
- 2008→2024 swing
- -6.6pp toward R · 2008: -40.7pp · 2024: -47.4pp
- All cycles
- 2024: R+47.4 2020: R+43.5 2016: R+46.3 2012: R+43.6 2008: R+40.7
Not yet ingested
- Civics
- —
Market trends
- HPI YoY
- ▼ -142.12%
- Current HPI
- 290.3312
- Rent YoY
- ▲ 0.45%
- Metro
- Panama City, FL
- State GDP YoY
- ▲ 3.28%
- F500 in state
- 36
Industry mix (Fortune 500 HQ in FL)
| Industry | F500 HQs | Revenue |
|---|---|---|
| Industrial Technology | 2 | $29B |
|
||
| Insurance | 2 | $17B |
|
||
| Retail | 1 | $60B |
|
||
| Technology Distribution | 1 | $58B |
|
||
| Homebuilding | 1 | $35B |
|
||
| Technology Manufacturing | 1 | $35B |
|
||
Price history
-25.1% since first listed5 events — show timeline
- 2026-06-02 Price Changed $149,900 CPARMLS
- 2026-05-15 Listed $159,900 CPARMLS
- 2024-07-26 Price Changed $190,000 CPARMLS
- 2024-03-29 Price Changed $195,000 CPARMLS
- 2024-02-03 Listed $200,000 CPARMLS
Property tax history
+15.3%/yrLatest (2025): $1,926 · +218.0% YoY. Source: county tax records.
Cash-flow waterfall
monthlySold comps — $/sqft
last 12 mo · ≤1 miLoading sold comps…