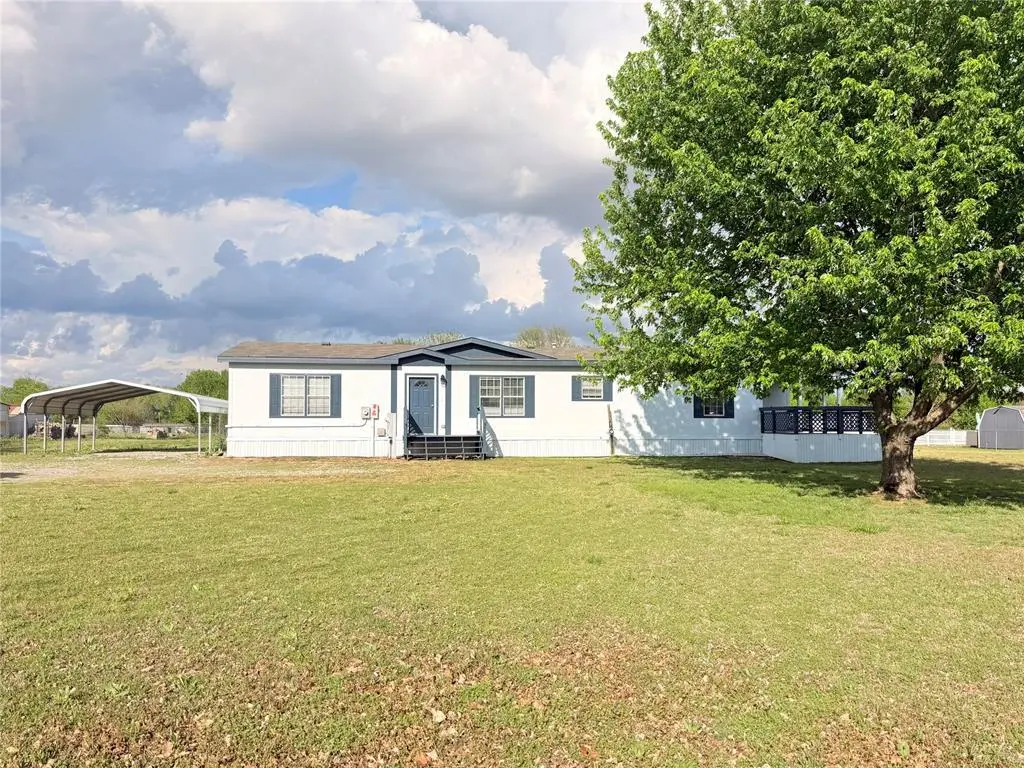
2508 Spring Valley Ln · Oklahoma City, OK
Flood risk 1/10 · Minimal
- FEMA flood zone
- X (unshaded)
- Chance of flooding over 30 yrs
- 0.0%
- Est. flood insurance / yr
- $507 – $1,088
Fire risk 4/10 · Minor
- Est. fire insurance / yr
- $2,463 – $4,575
Heat risk 5/10 · Moderate
- Hot days now (above 106°F)
- 7 days/yr
- Hot days in 30 yrs
- 18 days/yr
Wind risk 3/10 · Minor
- Chance of severe wind over 30 yrs
- 4.0%
Air-quality risk 1/10 · Minimal
- Unhealthy air days now
- 0 days/yr
- Unhealthy air days in 30 yrs
- 0 days/yr
Risk factors via First Street. Map © Google.
Why this score? — see what drove the D grade
The composite is a weighted blend of 9 inputs, each scored 0–100. Each bar is that input's sub-score; the figure is the points it added to the 100-point composite (weight × sub-score).
- Cash flow +14.4/30.0
- ARV discount +7.5/15.0
- DSCR +4.4/10.0
- Livability +4.0/5.0
- Schools +3.1/10.0
- Rent growth +2.8/5.0
- 1% rule +2.7/10.0
- Condition / age +2.5/5.0
- Appreciation +0.0/10.0
$224,900
🖨 Deal sheet (PDF) 📄 Offer letter ✓ Due diligence
Listing remarks
Welcome Home to This Stunning Remodeled Gem in the Heart of Yukon, OK! Nestled on over an acre of land in one of Yukon's most sought-after locations, this beautifully remodeled 3-bedroom plus office, 2-bathroom home offers the perfect blend of modern upgrades, functional space, and unbeatable value — all with NO HOA restrictions to limit your lifestyle! From the moment you step inside, you'll notice the attention to detail throughout. The home has been thoughtfully updated with brand-new paint, flooring, and modern light fixtures featuring a convenient night light mode. The heart of the home — the kitchen — is sure to impress, boasting gorgeous 3cm quartz countertops, sl
Key facts
- Modern upgrades
- New flooring
- No hoa restrictions
Tags
Property features AI
Finance
- Other: Lot size approximately 1.1253 acres
- Financial info: Loan qualification available; Assumable loan: No
- HOA & community: No mandatory association dues
Exterior
- Parking: 1-car garage
- Utilities: Manual geocode source
- Home design: Single family residence; One-level property; Residential property
- Construction: Brick and frame construction; Shingle roof; Combination foundation; Existing property
- Exterior features: Covered deck; Covered porch; Storage; Workshop; Below-ground storm shelter; Section line lot
Interior
- Bedrooms: 3 bedrooms
- Bathrooms: 2 full bathrooms
- Heating & cooling: Central gas cooling/heating
- Interior features: Living area with 1 living area; Dining area; Study/office; Gas log fireplace
Neighborhood map
What this means for you Summary
Snapshot
- This is a 3-bed/2.0-bath manufactured listed at $225k.
Deal economics
- At list price, monthly cash flow is $44 ($529/yr) — positive.
- The deal already cash-flows at list — no discount required.
- To meet the 1% rule (rent ≥ 1% of price), the offer needs to be $174k (22.7% below list).
- Recommended offer: $174k (22.7% below list) — sets the bar for 1% rule.
- Cap rate 6.5% vs local median 3.7% in Oklahoma City — top-decile yield for the area; either an underpriced asset or a hidden risk that comps aren't pricing in. Stress-test before assuming the spread holds.
Location & tenants
- Location reads 80/100 on livability (#3 in OK, #1,635 nationally) — a professional / high-income tenant draw. Strengths: amenities A+, commute A+, cost of living A+; Watch: crime F.
- Mustang (suburban): math 35% / reading 33% proficiency, ranked #28 of 270 in OK (top 10%) — families likely to look elsewhere, expect single-tenant / working-renter base with shorter leases.
- Zoned schools: Mustang Trails Es (math 34% / reading 26%, grade F, #251 of 845 statewide, top 30%, 678 students, 0% FRL); Canyon Ridge Ies (math 43% / reading 36%, grade F, #8 of 345 statewide, top 2%, 749 students, 0% FRL); Mustang Hs (math 28% / reading 39%, grade F, #65 of 447 statewide, top 14%, 3,756 students, 0% FRL) — zoned schools average 0% FRL vs 28% district-wide (28 pts lower); this property's tenant base skews higher-income than the district average.
- Market conditions: Rents rising (+1.2%/yr); 1574 active listings in the ZIP; 38 comparable units currently listed for rent nearby; rentals at typical pace (median 19d on market — plan ~3-4 weeks tenant-placement turnaround); solid renter incomes; 260 units permitted in Canadian County in 2024 (0 in 5+ unit buildings).
Forward outlook
- Local home prices are declining (-3.0%/yr); year-one equity from $2k of loan paydown is wiped out by about $7k of value loss. Plan a longer hold.
- Canadian County population projected at +64% by 2050 — long-run rental-demand tailwind backs the buy-and-hold thesis.
Negotiation context
- Only 9 days on market — expect competitive offers; lowballing is unlikely to land.
- Current owner paid $92k; list at $225k implies a 146% gain — meaningful room to come down on a strong offer.
Risks & watch-outs
- Climate carrying-cost: extreme-heat days projected 7→18/yr by 2055 (HVAC capex compounding) — expect insurance premiums to compound above CPI over the hold.
Questions for the listing agent
- Is there a deadline driving the sale (1031 exchange, divorce, estate, relocation)? That informs how much negotiation room exists.
- Schools are F-rated, which usually means shorter tenancies and higher turnover. Who's the typical renter profile here, and what's been the actual vacancy rate?
- Crime grade is F in this area — have there been break-ins, vandalism, or insurance claims at this property in the last 3 years? What carrier currently insures it and at what premium?
- The area grade is low — what's the realistic commute time and amenity access for the typical tenant pool here? Any planned neighborhood developments (good or bad) we should know about?
- What's the average days-on-market for RENTAL listings here right now (not sales)? A rising rental-DOM trend means longer vacancies and softer asking-rent achievability than the comps imply.
- What's the recent tenant-quality profile in this submarket — average credit score on applications, eviction rate, late-payment / NSF rate, and stable-employment percentage? A property-management company in the area should have these aggregated.
- How much new for-sale + rental construction is in the pipeline within 1–3 miles? Heavy new supply typically softens prices + rents 12–24 months out; constrained supply supports both.
Investment metrics
- 1% rule
- 0.77% ✗
- Cap rate
- 6.53%
- Cash-on-cash
- 0.84%
- DSCR
- 1.04
- GRM
- 10.8
CMA / ARV
No comps found within radius.
Projected returns pro-forma
-3.0% appreciation · 1.19% rent growth · sell at horizon
- IRR
- -16.8%
- Equity multiple
- 0.41×
- Total profit
- $-36,856
- Equity at exit
- $33,533
- IRR
- -11.8%
- Equity multiple
- 0.35×
- Total profit
- $-41,235
- Equity at exit
- $19,445
Cash invested: $62,972 (down + closing). Projections, not guarantees.
Landlord ↔ Tenant lean methodology
- Overall (STATE)
- 83 Strongly Landlord-Friendly
- State Oklahoma
- 83 Strongly Landlord-Friendly · R+20
- County
- — inherits STATE
- City
- — inherits STATE
ZIP-level market 73099
- Rents YoY
- 1.2%
- Active inventory
- 1574
- Price-to-rent
- 10.8×
Monthly cashflow live
- Estimated rent
- $1,738 high interval (Pro) →
- Mortgage (P&I)
- −$1,179
- Tax from tax record
- −$56 /mo · $669/yr
- Insurance
- −$94
- HOA
- −$0
- Vacancy / Maint / Mgmt
- −$365
- Net cashflow
- $44
Break-even live
Sensitivity live
| Price | -10% $171 | -5% $108 | +0% $44 | +5% $-20 | +10% $-83 |
|---|---|---|---|---|---|
| Rent | -10% $-93 | -5% $-25 | +0% $44 | +5% $113 | +10% $181 |
| Rate | -1.0pp $157 | -0.5pp $101 | base $44 | +0.5pp $-14 | +1.0pp $-73 |
UW: 25.0% down · 7.5% · 30yr · 1.5% tax · 5.0% vac · 8.0% maint · 8.0% mgmt
Financing live
Cash to close
- Down payment
- $56,225
- Closing costs
- $6,747
- Reserves months
- —
- Total cash needed
- —
Loan-product check · same deal, 3 products live
Conventional
25% down · 7.5% · 30yr
- Down + closing
- —
- Monthly P&I
- —
- Monthly cashflow
- —
- DSCR
- —
- Eligible?
- —
Personal DTI + credit; lowest rate.
DSCR
20% down · 8.5% · 30yr
- Down + closing
- —
- Monthly P&I
- —
- Monthly cashflow
- —
- DSCR
- —
- Eligible?
- —
No personal income docs; deal must DSCR.
Hard money
10% down · 12.0% · 12mo
- Down + closing
- —
- Monthly P&I
- —
- Monthly cashflow
- —
- DSCR
- —
- Eligible?
- —
Short-term bridge; refi at stabilization.
Rent comps 38 comps
| Address | Beds | Baths | Sqft | Rent | $/sqft | DOM | Units | Dist |
|---|---|---|---|---|---|---|---|---|
| 12501 SW 15th Ter Yukon, OK | 3.0 | 2.0 | 1238 | $1,495 | $1.21 | 6d | 1 | 0.54mi |
| 12036 SW 17th St Yukon, OK | 3.0 | 2.0 | 1659 | $2,095 | $1.26 | 25d | 1 | 0.61mi |
| 12504 SW 12th St Yukon, OK | 3.0 | 2.0 | 1327 | $1,850 | $1.39 | 25d | 1 | 0.66mi |
| 1328 Garden Gate Dr Unit A Yukon, OK | 3.0 | 2.0 | 1250 | $1,395 | $1.12 | 18d | 1 | 0.71mi |
| 12224 SW 14th St Yukon, OK | 3.0 | 2.0 | 1383 | $1,500 | $1.08 | 18d | 1 | 0.72mi |
| 1328a Garden Gate Dr Yukon, OK | 3.0 | 2.0 | 1250 | $1,395 | $1.12 | 17d | 1 | 0.72mi |
| 11823 SW 14th St Yukon, OK | 3.0 | 2.0 | 1272 | $1,250 | $0.98 | 17d | 1 | 0.92mi |
| 11823 SW 14th St Yukon, OK | 3.0 | 2.0 | 2544 | $1,250 | $0.49 | 16d | 1 | 0.92mi |
| 11748 SW 25th Ter Yukon, OK | 3.0 | 2.0 | 2543 | $2,295 | $0.90 | 6d | 1 | 0.92mi |
| 12308 SW 9th Ter Yukon, OK | 3.0 | 2.0 | 1282 | $1,395 | $1.09 | 25d | 1 | 0.97mi |
| 3605 Maggie Rd Mustang, OK | 4.0 | 2.0 | 1459 | $1,595 | $1.09 | 16d | 1 | 1.05mi |
| 3617 Maggie Rd Mustang, OK | 4.0 | 2.0 | 1459 | $1,595 | $1.09 | 16d | 1 | 1.07mi |
| 3617 Maggie Rd Mustang, OK | 4.0 | 2.0 | 1459 | $1,595 | $1.09 | 25d | 1 | 1.07mi |
| 12109 SW 8th St Yukon, OK | 3.0 | 2.0 | 1250 | $1,590 | $1.27 | 6d | 1 | 1.08mi |
| 12109 SW 8th St Yukon, OK | 3.0 | 2.0 | 1250 | $1,590 | $1.27 | 16d | 1 | 1.08mi |
| 1017 Redwood Creek Dr Yukon, OK | 3.0 | 2.0 | 1629 | $2,095 | $1.29 | 25d | 1 | 1.09mi |
| 3629 Maggie Rd Mustang, OK | 4.0 | 2.0 | 1459 | $1,595 | $1.09 | 22d | 1 | 1.09mi |
| 3629 Maggie Rd Mustang, OK | 4.0 | 2.0 | 1459 | $1,595 | $1.09 | 25d | 1 | 1.09mi |
| 12044 SW 36th St Mustang, OK | 4.0 | 2.0 | 1524 | $1,595 | $1.05 | 4d | 1 | 1.11mi |
| 12044 SW 36th St Mustang, OK | 4.0 | 2.0 | 1459 | $1,595 | $1.09 | 17d | 1 | 1.11mi |
| 1109 Hickory Creek Dr Yukon, OK | 3.0 | 2.0 | 1303 | $1,595 | $1.22 | 25d | 1 | 1.13mi |
| 2924 Firefly Dr Yukon, OK | 3.0 | 2.0 | 1607 | $1,850 | $1.15 | 25d | 1 | 1.15mi |
| 11521 SW 24th St Yukon, OK | 3.0 | 2.0 | 1398 | $1,595 | $1.14 | 6d | 1 | 1.17mi |
| 2933 Ember Dr Yukon, OK | 4.0 | 2.0 | 1796 | $1,895 | $1.06 | 25d | 1 | 1.18mi |
| 2933 Ember Dr Yukon, OK | 4.0 | 2.0 | 1796 | $1,895 | $1.06 | 16d | 1 | 1.18mi |
| 713 Sage Brush Rd Yukon, OK | 3.0 | 2.0 | 1630 | $1,800 | $1.10 | 6d | 1 | 1.22mi |
| 11652 SW 12th St Yukon, OK | 3.0 | 2.0 | 1538 | $1,700 | $1.11 | 25d | 1 | 1.25mi |
| 12328 SW 5th St Yukon, OK | 3.0 | 2.0 | 1361 | $1,449 | $1.06 | 25d | 1 | 1.27mi |
| 11424 SW 25th St Yukon, OK | 4.0 | 2.0 | 1721 | $1,833 | $1.07 | 25d | 1 | 1.30mi |
| 512 Choctaw Gate Dr Yukon, OK | 3.0 | 2.0 | 1396 | $1,600 | $1.15 | 25d | 1 | 1.32mi |
| 1009 Harvest Dr Yukon, OK | 3.0 | 2.0 | 1698 | $1,595 | $0.94 | 25d | 1 | 1.32mi |
| 416 Cherokee Gate Dr Yukon, OK | 3.0 | 2.0 | 1295 | $1,395 | $1.08 | 18d | 1 | 1.35mi |
| 416 Cherokee Gate Dr Yukon, OK | 3.0 | 2.0 | 1295 | $1,395 | $1.08 | 12d | 1 | 1.35mi |
| 527 Hutton Rd Yukon, OK | 3.0 | 2.0 | 1601 | $1,500 | $0.94 | 25d | 1 | 1.35mi |
| 516 Conestoga Dr Yukon, OK | 3.0 | 2.0 | 1748 | $1,675 | $0.96 | 6d | 1 | 1.36mi |
| 11600 SW 9th St Yukon, OK | 3.0 | 2.0 | 1456 | $1,495 | $1.03 | 16d | 1 | 1.44mi |
| 1104 Westridge Dr Yukon, OK | 3.0 | 2.0 | 1486 | $1,595 | $1.07 | 16d | 1 | 1.48mi |
| 3805 Palmetto Bluff Dr Mustang, OK | 4.0 | 2.0 | 1720 | $1,895 | $1.10 | 25d | 1 | 1.49mi |
Listing history 5 events
-
2026-05-02status Pending
-
2026-04-20$224,900 Active
-
2025-12-16soldstatus $91,500
-
2003-08-20soldstatus $20,000
-
1999-06-25soldstatus $16,000
ⓘ Source: listings_history table (triggers on properties + properties_extension) + one-shot
backfill from property_details.listing_events for pre-trigger history.
Tax reassessment forecast OK · Resets to sale price
- Current annual tax
- $669 · $56/mo
- Projected year-2 tax
- $2,024 · $169/mo
- Expected delta
- +$1,355/yr (+$113/mo · 202.6%)
ⓘ Screening estimate from a state-policy table — verify with the county assessor before closing.
Climate risk First Street
- Flood 1/10 Low FEMA zone X (unshaded) · 0% chance over 30 yrs
- Wildfire 4/10 Moderate
- Heat 5/10 Major 7 d/yr ≥106°F today · 18 d/yr by 30 yrs out
- Wind 3/10 Moderate 4% chance of damaging wind over 30 yrs
- Air quality 1/10 Low 0 unhealthy d/yr today · 0 by 30 yrs out
Nearby sold comps map
Loading sold comps map…
Walkable amenities ~0.75 mi
Loading nearby amenities…
Taxation est. · year 1
- Rental income
- $20,855
- − Mortgage interest
- −$12,598
- − Property taxes
- −$669
- − Insurance
- −$1,124
- − Repairs & maintenance
- −$1,668
- − Management
- −$1,668
- − Depreciation
- −$6,543
- Taxable loss
- −$3,416
- Est. tax savings @ 24.0%
- +$820
- After-tax cash flow
- $1,349/yr
For passive investors: Depreciation is non-cash, so a rental often shows a tax loss while cash-flowing — sheltering income. Rental losses are passive: they offset passive income freely, and up to $25,000/yr can offset ordinary (W-2) income if you actively participate and your MAGI is under $100k (phasing out to $0 by $150k); unused losses carry forward. On sale, claimed depreciation is recaptured at up to 25%, and gains may owe capital-gains tax (a 1031 exchange can defer both). Figures are a year-1 estimate at your 24.0% rate — not tax advice; consult a CPA.
Schools (NCES district)
- District
- Mustang
- NCES district ID
- 4021000
- Math proficiency
- 35% ▼ -10.00%
- Reading proficiency
- 33% ▼ -7.00%
- Median HH income
- $67,559
- Composite
- 31.21/100
- National rank
- #6038
- State rank
- #28 of 270 in OK
Livability — Oklahoma City
- Score
- 80/100
- State rank
- #3
- US rank
- #1635
Category grades
Schools grade is shown separately in the Schools card above.
Census & demographics
- Census place
- Oklahoma City, OK
- County
- Canadian County · 154,341 people
- City population
- 498,656
- Metro
- Oklahoma City, OK
- Population (ZIP)
- 91,014
- Household income
- $88,030
- Rent vs Own
- Severe rent burden
- 1838.0
Population outlook (Canadian County) Hauer SSP2
- Today (2025)
- 174,062 people
- By 2030
- 195,170 · +12.1%
- By 2040
- 239,293 · +37.5%
- By 2050
- 285,457 · +64.0%
- By 2075
- 403,766 · +132.0%
- By 2100
- 498,766 · +186.5%
Race, ethnicity, and origin ACS 2023
- Neighborhood character
- Predominantly White (73%)
- Race & ethnicity
- White 73% Two or more races 11% Hispanic / Latino 10% Black 3% Asian 3% Native American 3%
- Hispanic origin (detail)
- Mexican 7%
- Common ancestry
- Italian 2% Slovak 1% Portuguese 1%
- Foreign-born
- 5% · Canada, Vietnam
- Languages at home
- 91% English-only · Spanish 5% Vietnamese 2% Other Asian/Pacific 1%
Political lean MEDSL · Canadian
- 2024 margin
- Solid R (+40.4) · D 28.8% · R 69.2% · Other 2.0%
- 2008→2024 swing
- +11.9pp toward D · 2008: -52.2pp · 2024: -40.4pp
- All cycles
- 2024: R+40.4 2020: R+43.3 2016: R+51.2 2012: R+54.4 2008: R+52.2
Not yet ingested
- Civics
- —
Market trends
- HPI YoY
- ▼ -206.04%
- Current HPI
- 244.6836
- Rent YoY
- ▲ 1.19%
- Metro
- Oklahoma City, OK
- State GDP YoY
- ▲ 1.55%
- F500 in state
- 6
Industry mix (Fortune 500 HQ in OK)
| Industry | F500 HQs | Revenue |
|---|---|---|
| Energy | 3 | $48B |
|
||
Price history
+1305.6% since first listed5 events — show timeline
- 2026-05-02 Pending — MLSOK
- 2026-04-20 Listed $224,900 MLSOK
- 2025-12-16 Sold (Public Records) $91,500 Public Records
- 2003-08-20 Sold (Public Records) $20,000 Public Records
- 1999-06-25 Sold (Public Records) $16,000 Public Records
Property tax history
-3.9%/yrLatest (2025): $669 · +1.2% YoY. Source: county tax records.
Cash-flow waterfall
monthlySold comps — $/sqft
last 12 mo · ≤1 miLoading sold comps…