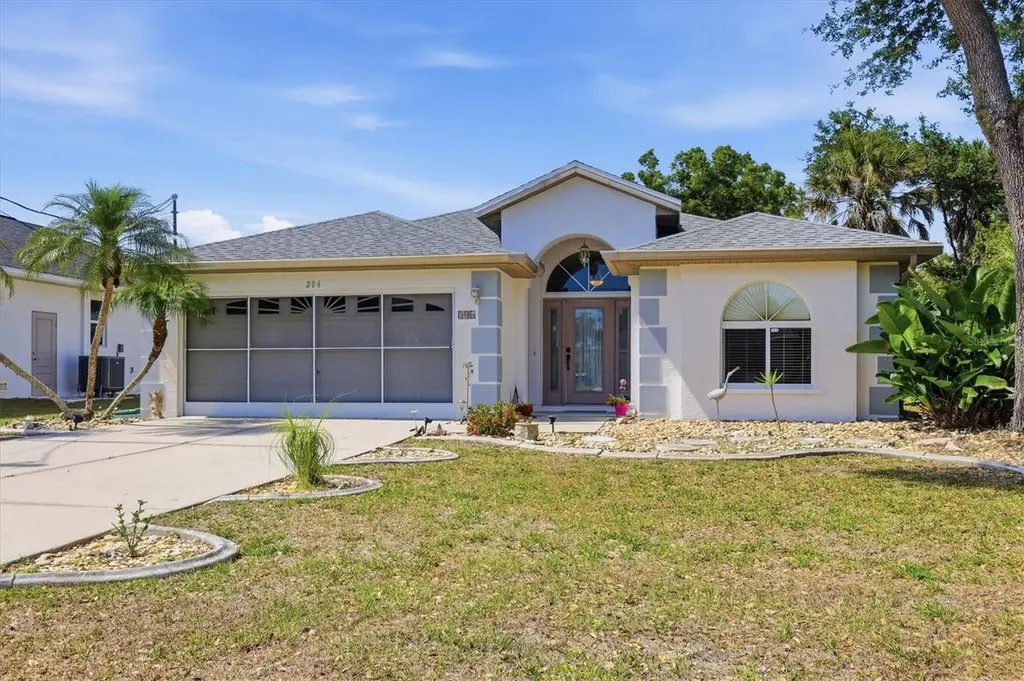
206 Cougar Way · Rotonda, FL
Flood risk 7/10 · Major
- FEMA flood zone
- X (shaded)
- Chance of flooding over 30 yrs
- 0.9%
- Est. flood insurance / yr
- $507 – $1,088
Fire risk 2/10 · Minimal
- Est. fire insurance / yr
- $947 – $1,759
Heat risk 10/10 · Severe
- Hot days now (above 107°F)
- 7 days/yr
- Hot days in 30 yrs
- 29 days/yr
Wind risk 10/10 · Severe
- Chance of severe wind over 30 yrs
- 99.0%
Air-quality risk 2/10 · Minimal
- Unhealthy air days now
- 1 days/yr
- Unhealthy air days in 30 yrs
- 1 days/yr
Risk factors via First Street. Map © Google.
Why this score? — see what drove the D grade
The composite is a weighted blend of 9 inputs, each scored 0–100. Each bar is that input's sub-score; the figure is the points it added to the 100-point composite (weight × sub-score).
- Cash flow +10.8/30.0
- ARV discount +9.3/15.0
- Appreciation +5.6/10.0
- Schools +4.6/10.0
- Livability +3.4/5.0
- DSCR +3.1/10.0
- Condition / age +2.5/5.0
- Rent growth +2.4/5.0
- 1% rule +2.3/10.0
$359,000
🖨 Deal sheet (PDF) 📄 Offer letter ✓ Due diligence
Listing remarks
Under contract-accepting backup offers. Incredible value for a three bedroom, two bathroom, two car garage pool home in the heart of lovely Southwest Florida; we call it PARADISE! Offering 1,648 square feet under air, this 2002 build sits proudly in the X flood zone—no flood insurance required! Bright, open, and welcoming, the home features an open floor plan with vaulted ceilings, tile flooring throughout, and multiple sliding glass doors that bring in beautiful natural light. Step outside to a spacious covered lanai and a screen enclosed pool with a water feature, resurfaced just four years ago—perfect for year round Florida living. The fenced backyard adds privacy, and the in
Key facts
- Covered lanai
- Fenced backyard
- Screen enclosed pool
Tags
Property features AI
Finance
- Other: Unfurnished; Living area about 1,648 sq ft (public records); Building area total about 2,356 sq ft
- HOA & community: Has HOA (Legacy Property Management) with required annual fee of $95 (about $7.92/month); Deed restrictions; Pets allowed
Exterior
- Parking: Driveway; Attached 2-car garage with garage door opener
- Security: Smoke detectors
- Utilities: Public water; Public sewer; Electricity connected; Water connected; Sewer connected; Broadband/high-speed internet available
- Home design: Single family residence; One story; South-facing; Residential zoning (RSF5); Homestead exempt
- Construction: Block, concrete and stucco construction; Shingle roof; Slab foundation; Built with gunite in-ground private pool with screen enclosure
- Exterior features: Covered front and rear porches; Screened porch; Sliding doors; Rain gutters; Chain link fence; Mature landscaping; Level lot; Asphalt public road access; Lot dimensions approximately 60 x 125
Interior
- Kitchen: Dishwasher; Disposal; Microwave; Refrigerator; Electric water heater
- Bedrooms: 3 bedrooms
- Flooring: Tile
- Bathrooms: 2 full bathrooms
- Heating & cooling: Central heating (electric); Central air conditioning
- Interior features: High ceilings; Open floor plan; Thermostat; Vaulted ceilings; Walk-in closets; Window treatments; Inside utility
- Laundry & utility: Inside laundry in a laundry closet; Washer; Dryer
Neighborhood map
What this means for you Summary
Snapshot
- This is a 3-bed/2.0-bath single-family listed at $359k.
Deal economics
- At list price, monthly cash flow is $-231 ($-3k/yr) — negative.
- To cash-flow at today's rent, offer at most $318k (11.4% below list).
- To meet the 1% rule (rent ≥ 1% of price), the offer needs to be $261k (27.2% below list).
- Recommended offer: $261k (27.2% below list) — sets the bar for 1% rule.
- Cap rate 5.7% vs local median 3.1% in Rotonda — top-decile yield for the area; either an underpriced asset or a hidden risk that comps aren't pricing in. Stress-test before assuming the spread holds.
Location & tenants
- Location reads 67/100 on livability (#548 in FL) — a middle-class / working-renter tenant base. Strengths: crime A+, housing A-, cost of living B+; Watch: amenities F, commute F, health & safety D-.
- Charlotte (suburban): math 54% / reading 54% proficiency, ranked #22 of 73 in FL (top 30%) — acceptable for families but not a draw, mixed tenant base, ~2y average lease.
- Zoned schools: Vineland Elementary School (math 74% / reading 67%, grade A-, #333 of 2,144 statewide, top 16%, 579 students, 45% FRL); L. A. Ainger Middle School (math 65% / reading 53%, grade B, #144 of 571 statewide, top 26%, 720 students, 40% FRL); Lemon Bay High School (math 50% / reading 56%, grade C-, #148 of 667 statewide, top 23%, 1,360 students, 28% FRL) — zoned schools average 38% FRL vs 54% district-wide (16 pts lower); this property's tenant base skews higher-income than the district average.
- Market conditions: Rents soft (-0.2%/yr); 869 active listings in the ZIP; 28 comparable units currently listed for rent nearby; rentals at typical pace (median 23d on market — plan ~3-4 weeks tenant-placement turnaround); solid renter incomes; 4,585 units permitted in Charlotte County in 2024 (703 in 5+ unit buildings).
- This rent runs 39% of the median local income ($80k/yr) — at the standard rent-burdened threshold; future hikes will face affordability resistance.
Forward outlook
- In year one you build about $7k of equity ($2k loan paydown + $4k appreciation (1.2% local appreciation)).
- Charlotte County population projected at +24% by 2050 — long-run rental-demand tailwind backs the buy-and-hold thesis.
- By year 5, paydown + projected appreciation supports a ~$32k cash-out refi (75% LTV) — recoverable capital for the next deal without selling this one.
Negotiation context
- Only 8 days on market — expect competitive offers; lowballing is unlikely to land.
- Current owner paid $190k; list at $359k implies a 89% gain — meaningful room to come down on a strong offer.
Risks & watch-outs
- Watch-outs: flood insurance adds $66/mo.
- Climate carrying-cost: major flood risk; severe wind risk, 99% chance of damaging wind over 30y; extreme-heat days projected 7→29/yr by 2055 (HVAC capex compounding) — expect insurance premiums to compound above CPI over the hold.
Questions for the listing agent
- What do current leases actually rent for vs. the listed asking? Can we see a recent rent roll and the last 12 months of T-12 income?
- What's the actual annual flood-insurance premium (NFIP or private), and is the property in a SFHA with mandatory coverage?
- What does the HOA fee cover, when was the last increase, and are there any pending special assessments or reserve-fund shortfalls?
- Is there a deadline driving the sale (1031 exchange, divorce, estate, relocation)? That informs how much negotiation room exists.
- Schools are D-rated, which usually means shorter tenancies and higher turnover. Who's the typical renter profile here, and what's been the actual vacancy rate?
- The area grade is low — what's the realistic commute time and amenity access for the typical tenant pool here? Any planned neighborhood developments (good or bad) we should know about?
- What's the average days-on-market for RENTAL listings here right now (not sales)? A rising rental-DOM trend means longer vacancies and softer asking-rent achievability than the comps imply.
- What's the recent tenant-quality profile in this submarket — average credit score on applications, eviction rate, late-payment / NSF rate, and stable-employment percentage? A property-management company in the area should have these aggregated.
- How much new for-sale + rental construction is in the pipeline within 1–3 miles? Heavy new supply typically softens prices + rents 12–24 months out; constrained supply supports both.
Investment metrics
- 1% rule
- 0.73% ✗
- Cap rate
- 5.74%
- Cash-on-cash
- -1.97%
- DSCR
- 0.91
- GRM
- 11.4
CMA / ARV
- ARV (on-the-fly)
- $374,096
- Comps found
- 12
Show comp detail 12 sales within ~0.75 mi
| Address | Dist | Beds/Ba | Sqft | Sold | Price | $/sf | Match |
|---|---|---|---|---|---|---|---|
| 126 Spur Dr | 0.07mi | 3/2.0 | 1,659 (+1%) | 9mo | $430,000 | $259 | 88 |
| 105 Spur Dr | 0.18mi | 3/2.0 | 1,637 (-1%) | 8mo | $425,000 | $260 | 84 |
| 27 Mariner Ln | 0.55mi | 3/2.5 | 1,652 (+0%) | 1mo | $420,000 | $254 | 71 |
| 10157 Seabrook Ave | 0.62mi | 3/2.0 | 1,690 (+2%) | 5mo | $395,000 | $234 | 63 |
| 257 Indian Creek Dr | 0.72mi | 3/2.0 | 1,607 (-2%) | 1mo | $335,000 | $208 | 62 |
| 15 Mariner Ln | 0.47mi | 3/2.0 | 1,480 (-10%) | 1mo | $370,000 | $250 | 61 |
| 13 Bunker Ln | 0.62mi | 3/2.0 | 1,597 (-3%) | 7mo | $340,000 | $213 | 60 |
| 25 Mariner Ln | 0.54mi | 3/2.0 | 1,592 (-3%) | 11mo | $330,000 | $207 | 60 |
| 36 Pinehurst Ct | 0.66mi | 3/2.0 | 1,720 (+4%) | 2mo | $390,000 | $227 | 60 |
| 7346 Bargello St | 0.61mi | 3/2.0 | 1,530 (-7%) | 4mo | $275,000 | $180 | 57 |
| 254 Mark Twain Ln | 0.67mi | 4/2.0 (+1) | 1,874 (+14%) | 2mo | $399,900 | $213 | 39 |
| 7305 Innsbrook St | 0.75mi | 3/2.0 | 1,462 (-11%) | 14mo | $250,000 | $171 | 35 |
Match score weights: distance 35% · size 25% · config 20% · recency 20%. Top-matched comps best support the ARV.
Projected returns pro-forma
1.25% appreciation · 0.0% rent growth · sell at horizon
- IRR
- -2.2%
- Equity multiple
- 0.89×
- Total profit
- $-11,332
- Equity at exit
- $127,250
- IRR
- 1.2%
- Equity multiple
- 1.14×
- Total profit
- $14,167
- Equity at exit
- $172,794
Cash invested: $100,520 (down + closing). Projections, not guarantees.
Landlord ↔ Tenant lean methodology
- Overall (STATE)
- 87 Strongly Landlord-Friendly
- State Florida
- 87 Strongly Landlord-Friendly · R+3
- County
- — inherits STATE
- City
- — inherits STATE
ZIP-level market 33947
- Home prices YoY
- 0.4%
- Rents YoY
- -0.2%
- Active inventory
- 869
- Price-to-rent
- 11.4×
Monthly cashflow live
- Estimated rent
- $2,615 high interval (Pro) →
- Mortgage (P&I)
- −$1,883
- Tax from tax record
- −$191 /mo · $2,295/yr
- Insurance
- −$150
- Flood insurance flood zone
- −$66 /mo · $798/yr
- HOA
- −$7
- Vacancy / Maint / Mgmt
- −$549
- Net cashflow
- $-231
Break-even live
Sensitivity live
| Price | -10% $-28 | -5% $-130 | +0% $-231 | +5% $-333 | +10% $-434 |
|---|---|---|---|---|---|
| Rent | -10% $-438 | -5% $-334 | +0% $-231 | +5% $-128 | +10% $-25 |
| Rate | -1.0pp $-50 | -0.5pp $-140 | base $-231 | +0.5pp $-324 | +1.0pp $-419 |
UW: 25.0% down · 7.5% · 30yr · 1.5% tax · 5.0% vac · 8.0% maint · 8.0% mgmt
Financing live
Cash to close
- Down payment
- $89,750
- Closing costs
- $10,770
- Reserves months
- —
- Total cash needed
- —
Loan-product check · same deal, 3 products live
Conventional
25% down · 7.5% · 30yr
- Down + closing
- —
- Monthly P&I
- —
- Monthly cashflow
- —
- DSCR
- —
- Eligible?
- —
Personal DTI + credit; lowest rate.
DSCR
20% down · 8.5% · 30yr
- Down + closing
- —
- Monthly P&I
- —
- Monthly cashflow
- —
- DSCR
- —
- Eligible?
- —
No personal income docs; deal must DSCR.
Hard money
10% down · 12.0% · 12mo
- Down + closing
- —
- Monthly P&I
- —
- Monthly cashflow
- —
- DSCR
- —
- Eligible?
- —
Short-term bridge; refi at stabilization.
Rent comps 28 comps
| Address | Beds | Baths | Sqft | Rent | $/sqft | DOM | Units | Dist |
|---|---|---|---|---|---|---|---|---|
| 511 Sweetwater Dr Rotonda West, FL | 4.0 | 2.5 | 2160 | $2,200 | $1.02 | 23d | 1 | 0.21mi |
| 502 Sunset Rd N Rotonda West, FL | 3.0 | 2.0 | 1636 | $2,100 | $1.28 | 23d | 1 | 0.29mi |
| 285 Mark Twain Ln Rotonda West, FL | 3.0 | 2.0 | 1759 | $1,750 | $0.99 | 23d | 1 | 0.41mi |
| 22 Mariner Ln Rotonda West, FL | 3.0 | 2.0 | 2015 | $4,200 | $2.08 | 23d | 1 | 0.48mi |
| 25 Fairway Rd Rotonda West, FL | 3.0 | 2.0 | 2068 | $2,375 | $1.15 | 23d | 1 | 0.51mi |
| 289 Boundary Blvd Unit 202 Rotonda West, FL | 3.0 | 2.0 | 1168 | $1,645 | $1.41 | 23d | 1 | 0.72mi |
| 278 Boundary Blvd Unit B Rotonda West, FL | 2.0 | 2.0 | 1138 | $1,625 | $1.43 | 23d | 1 | 0.78mi |
| 65 Fairway Rd Rotonda West, FL | 3.0 | 2.0 | 1865 | $2,700 | $1.45 | 23d | 1 | 0.81mi |
| 36 Bunker Cir Rotonda West, FL | 2.0 | 2.0 | 1533 | $3,999 | $2.61 | 23d | 1 | 0.88mi |
| 7344 Brookhaven Ter Englewood, FL | 3.0 | 2.0 | 1594 | $2,095 | $1.31 | 23d | 1 | 0.91mi |
| 80 Mariner Ln Rotonda West, FL | 3.0 | 2.0 | 2052 | $4,800 | $2.34 | 23d | 1 | 0.92mi |
| 8256 Shore Lake Dr Englewood, FL | 3.0 | 3.0 | 2201 | $2,500 | $1.14 | 23d | 1 | 0.96mi |
| 181 Bunker Rd Rotonda West, FL | 2.0 | 2.0 | 1355 | $4,600 | $3.39 | 23d | 1 | 1.01mi |
| 10123 Bay Ave Englewood, FL | 3.0 | 2.0 | 2010 | $2,150 | $1.07 | 23d | 1 | 1.03mi |
| 7160 Carlsbad Ter Englewood, FL | 3.0 | 2.0 | 2061 | $4,500 | $2.18 | 23d | 1 | 1.07mi |
| 9400 New Martinsville Ave Englewood, FL | 3.0 | 2.0 | 1879 | $3,300 | $1.76 | 23d | 1 | 1.08mi |
| 527 Rotonda Cir Rotonda West, FL | 3.0 | 2.0 | 1586 | $2,375 | $1.50 | 23d | 1 | 1.14mi |
| 226 Boundary Blvd Rotonda West, FL | 2.0 | 2.0 | 1200 | $1,495 | $1.25 | 15d | 1 | 1.17mi |
| 42 Mark Twain Ln Rotonda West, FL | 3.0 | 2.5 | 1677 | $2,800 | $1.67 | 23d | 1 | 1.23mi |
| 8363 Sago Ct Englewood, FL | 2.0 | 2.0 | 1360 | $1,950 | $1.43 | 23d | 1 | 1.25mi |
| 87 Mark Twain Ln Rotonda West, FL | 3.0 | 2.0 | 1235 | $2,500 | $2.02 | 23d | 1 | 1.31mi |
| 239 Annapolis Ln Rotonda West, FL | 3.0 | 2.0 | 1747 | $2,000 | $1.14 | 23d | 1 | 1.40mi |
| 195 Rotonda Blvd W Unit A Rotonda West, FL | 3.0 | 2.0 | 1162 | $1,850 | $1.59 | 23d | 1 | 1.44mi |
| 230 Annapolis Ln Rotonda West, FL | 3.0 | 2.0 | 1768 | $1,800 | $1.02 | 23d | 1 | 1.44mi |
| 188 Boundary Blvd Unit B Rotonda West, FL | 2.0 | 2.0 | 2086 | $2,000 | $0.96 | 23d | 1 | 1.48mi |
| 114 Albatross Rd Rotonda West, FL | 3.0 | 2.0 | 1648 | $5,300 | $3.22 | 23d | 1 | 1.49mi |
| 9416 Anita Ave Englewood, FL | 3.0 | 2.0 | 1162 | $1,750 | $1.51 | 15d | 1 | 1.49mi |
| 589 Rotonda Cir Rotonda West, FL | 3.0 | 2.5 | 2190 | $4,200 | $1.92 | 23d | 1 | 1.49mi |
HOA detail
- Monthly dues
- $7 · $84/yr
- Likely covers
- waterpool
Listing history 8 events
-
2026-06-03statusdays on market $359,000 Pending 8 DOM
-
2026-06-02days on market $359,000 Active 7 DOM
-
2026-06-01days on market $359,000 Active 6 DOM
-
2026-05-31days on market $359,000 Active 5 DOM
-
2026-05-30days on market $359,000 Active 4 DOM
-
2026-05-26$359,000 Active
-
2004-04-21soldstatus $190,000
-
2002-04-17soldstatus $114,900
ⓘ Source: listings_history table (triggers on properties + properties_extension) + one-shot
backfill from property_details.listing_events for pre-trigger history.
Tax reassessment forecast FL · Resets to sale price
- Current annual tax
- $2,295 · $191/mo
- Projected year-2 tax
- $2,980 · $248/mo
- Expected delta
- +$685/yr (+$57/mo · 29.8%)
ⓘ Screening estimate from a state-policy table — verify with the county assessor before closing.
Climate risk First Street
- Flood 7/10 Severe FEMA zone X (shaded) · 90% chance over 30 yrs
- Wildfire 2/10 Low
- Heat 10/10 Extreme 7 d/yr ≥107°F today · 29 d/yr by 30 yrs out
- Wind 10/10 Extreme 99% chance of damaging wind over 30 yrs
- Air quality 2/10 Low 1 unhealthy d/yr today · 1 by 30 yrs out
Nearby sold comps map
Loading sold comps map…
Walkable amenities ~0.75 mi
Loading nearby amenities…
Taxation est. · year 1
- Rental income
- $31,379
- − Mortgage interest
- −$20,110
- − Property taxes
- −$2,295
- − Insurance
- −$2,592
- − Repairs & maintenance
- −$2,510
- − Management
- −$2,510
- − HOA
- −$84
- − Depreciation
- −$10,444
- Taxable loss
- −$9,166
- Est. tax savings @ 24.0%
- +$2,200
- After-tax cash flow
- $-574/yr
For passive investors: Depreciation is non-cash, so a rental often shows a tax loss while cash-flowing — sheltering income. Rental losses are passive: they offset passive income freely, and up to $25,000/yr can offset ordinary (W-2) income if you actively participate and your MAGI is under $100k (phasing out to $0 by $150k); unused losses carry forward. On sale, claimed depreciation is recaptured at up to 25%, and gains may owe capital-gains tax (a 1031 exchange can defer both). Figures are a year-1 estimate at your 24.0% rate — not tax advice; consult a CPA.
Schools (NCES district)
- District
- Charlotte
- NCES district ID
- 1200240
- Math proficiency
- 54% ▼ -6.00%
- Reading proficiency
- 54% ▼ -1.00%
- Median HH income
- $44,864
- Composite
- 45.62/100
- National rank
- #2586
- State rank
- #22 of 73 in FL
Livability — Rotonda
- Score
- 67/100
- State rank
- #548
- US rank
- #10359
Category grades
Schools grade is shown separately in the Schools card above.
Census & demographics
- County
- Charlotte County · 196,994 people
- City population
- 10,490
- Metro
- Punta Gorda, FL
- Population (ZIP)
- 10,447
- Household income
- $80,091
- Rent vs Own
- Severe rent burden
- 91.0
Population outlook (Charlotte County) Hauer SSP2
- Today (2025)
- 198,646 people
- By 2030
- 210,507 · +6.0%
- By 2040
- 230,857 · +16.2%
- By 2050
- 247,148 · +24.4%
- By 2075
- 281,777 · +41.8%
- By 2100
- 293,609 · +47.8%
Race, ethnicity, and origin ACS 2023
- Neighborhood character
- Predominantly White (96%)
- Race & ethnicity
- White 96% Hispanic / Latino 2% Two or more races 2%
- Common ancestry
- Romanian 5% Lithuanian 4% Slovak 4%
- Foreign-born
- 8% · Canada, Vietnam
- Languages at home
- 93% English-only · Russian/Polish/Slavic 3% Spanish 2% German/W. Germanic 1%
Political lean MEDSL · Charlotte
- 2024 margin
- Solid R (+34.0) · D 32.7% · R 66.7%
- 2008→2024 swing
- -26.7pp toward R · 2008: -7.2pp · 2024: -34.0pp
- All cycles
- 2024: R+34.0 2020: R+26.6 2016: R+27.8 2012: R+14.3 2008: R+7.2
Not yet ingested
- Civics
- —
Market trends
- HPI YoY
- ▲ 1.25%
- Current HPI
- 311.3231
- Rent YoY
- ▼ -0.22%
- Metro
- Punta Gorda, FL
- State GDP YoY
- ▲ 3.28%
- F500 in state
- 36
Industry mix (Fortune 500 HQ in FL)
| Industry | F500 HQs | Revenue |
|---|---|---|
| Industrial Technology | 2 | $29B |
|
||
| Insurance | 2 | $17B |
|
||
| Retail | 1 | $60B |
|
||
| Technology Distribution | 1 | $58B |
|
||
| Homebuilding | 1 | $35B |
|
||
| Technology Manufacturing | 1 | $35B |
|
||
Price history
+212.4% since first listed3 events — show timeline
- 2026-05-26 Listed $359,000 Stellar MLS as Distributed by MLS Grid
- 2004-04-21 Sold (Public Records) $190,000 Public Records
- 2002-04-17 Sold (Public Records) $114,900 Public Records
Property tax history
+2.9%/yrLatest (2025): $2,295 · +3.4% YoY. Source: county tax records.
Cash-flow waterfall
monthlySold comps — $/sqft
last 12 mo · ≤1 miLoading sold comps…