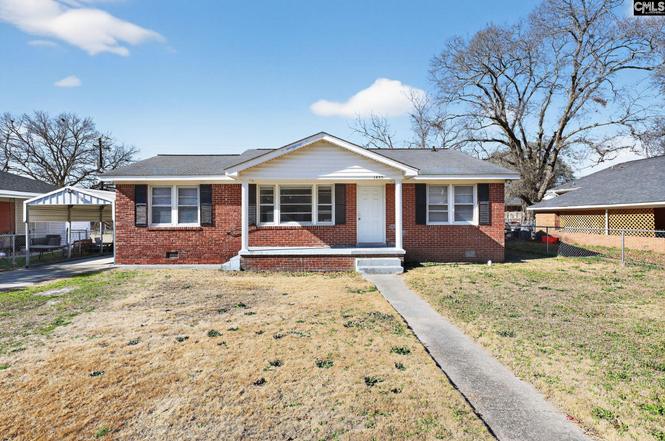
1455 Aralia Dr · Columbia, SC
Flood risk 1/10 · Minimal
- FEMA flood zone
- X (unshaded)
- Chance of flooding over 30 yrs
- 0.0%
- Est. flood insurance / yr
- $507 – $1,088
Fire risk 3/10 · Minor
- Est. fire insurance / yr
- $783 – $1,453
Heat risk 7/10 · Major
- Hot days now (above 109°F)
- 7 days/yr
- Hot days in 30 yrs
- 16 days/yr
Wind risk 6/10 · Moderate
- Chance of severe wind over 30 yrs
- 72.0%
Air-quality risk 3/10 · Minor
- Unhealthy air days now
- 2 days/yr
- Unhealthy air days in 30 yrs
- 2 days/yr
Risk factors via First Street. Map © Google.
Why this score? — see what drove the C- grade
The composite is a weighted blend of 9 inputs, each scored 0–100. Each bar is that input's sub-score; the figure is the points it added to the 100-point composite (weight × sub-score).
- ARV discount +15.0/15.0
- Cash flow +13.7/30.0
- 1% rule +4.2/10.0
- Rent growth +4.2/5.0
- DSCR +4.1/10.0
- Livability +3.9/5.0
- Schools +2.6/10.0
- Condition / age +2.5/5.0
- Appreciation +0.0/10.0
$194,900
🖨 Deal sheet (PDF) 📄 Offer letter ✓ Due diligence
Listing remarks
Move-in ready and full of charm, this 3-bedroom, 1.5-bath brick home at 1455 Aralia Drive offers comfortable one-level living in Columbia, SC. All rooms are conveniently located on the main level and feature neutral colors, abundant natural light, ceiling fans, and window coverings throughout. The inviting living room showcases a classic brick fireplace, built-in bookshelves, and plush carpeting that continues into the bedrooms. The upgraded kitchen is well-appointed with plenty of cabinets, a breakfast bar, stylish pendant lighting, and includes a refrigerator, range, and dishwasher. Step outside to enjoy the fenced yard—perfect for pets or entertaining—along with a detached on
Key facts
- Fenced yard
- One-level living
- Brick home
Tags
Property features AI
Exterior
- Parking: Detached 1-car garage
- Utilities: Public sewer; Public water
- Home design: Single-story home; Entry level: main
- Construction: Slab foundation
- Exterior features: Brick exterior above the foundation; Paved road access; Public water
Interior
- Bedrooms: Master bedroom on the main level; Second bedroom on the main level; Third bedroom on the main level
- Bathrooms: One full bathroom; One half bathroom
- Heating & cooling: Central heating; Central cooling
- Interior features: One fireplace
- Laundry & utility: Washer and dryer located on the main level
Neighborhood map
What this means for you Summary
Snapshot
- This is a 3-bed/2.0-bath single-family listed at $195k.
Deal economics
- At list price, monthly cash flow is $14 ($166/yr) — positive.
- The deal already cash-flows at list — no discount required.
- To meet the 1% rule (rent ≥ 1% of price), the offer needs to be $179k (8.4% below list).
- Recommended offer: $172k (12.0% below list) — sets the bar for market timing.
- Cap rate 6.4% vs local median 5.1% in Columbia — meaningfully above typical; check what's discounted (condition, days-on-market, listing class) to confirm the premium yield is real.
Location & tenants
- Location reads 78/100 on livability (#18 in SC, #2,436 nationally) — a middle-class / working-renter tenant base. Strengths: amenities A+, commute A+, cost of living A+; Watch: employment D, crime F.
- Richland 01 (urban): math 26% / reading 36% proficiency, ranked #54 of 80 in SC (top 68%) — families likely to look elsewhere, expect single-tenant / working-renter base with shorter leases; 64% free/reduced lunch — lower-income household profile, screen leases tightly.
- Zoned schools: South Kilbourne Elementary (math 12% / reading 17%, grade F, #553 of 597 statewide, top 95%, 296 students, 100% FRL); Hand Middle (math 29% / reading 37%, grade F, #116 of 229 statewide, top 51%, 652 students, 100% FRL); Dreher High (math 47% / reading 92%, grade B, #60 of 196 statewide, top 32%, 1,150 students, 100% FRL) — zoned schools average 100% FRL vs 64% district-wide (36 pts higher); higher-poverty schools than district average — tighter screening recommended.
- Market conditions: Rents rising fast (+7.0%/yr); 150 active listings in the ZIP; 27 comparable units currently listed for rent nearby; rentals at typical pace (median 25d on market — plan ~3-4 weeks tenant-placement turnaround); 3,472 units permitted in Richland County in 2024 (1,096 in 5+ unit buildings).
- This rent runs 33% of the median local income ($64k/yr) — at the standard rent-burdened threshold; future hikes will face affordability resistance.
Forward outlook
- Local home prices are declining (-3.0%/yr); year-one equity from $1k of loan paydown is wiped out by about $6k of value loss. Plan a longer hold.
- Richland County population projected at +30% by 2050 — long-run rental-demand tailwind backs the buy-and-hold thesis.
Negotiation context
- It's been on market 151 days — a 12% lower offer ($172k) is reasonable based on typical stale-listing flexibility.
Risks & watch-outs
- Climate carrying-cost: major wind risk, 72% chance of damaging wind over 30y; extreme-heat days projected 7→16/yr by 2055 (HVAC capex compounding) — expect insurance premiums to compound above CPI over the hold.
Questions for the listing agent
- It's been on market 151 days. Have you received any prior offers? Is the seller open to a 12% concession, seller financing, or rate buy-down credit?
- Built in 1966 — when were the roof, HVAC, electrical panel, plumbing, and water heater last replaced?
- Why hasn't it sold? Are there any deal-killer items the seller is aware of (foundation, flood, title, zoning, code violations)?
- Is there a deadline driving the sale (1031 exchange, divorce, estate, relocation)? That informs how much negotiation room exists.
- Schools are D-rated, which usually means shorter tenancies and higher turnover. Who's the typical renter profile here, and what's been the actual vacancy rate?
- Crime grade is F in this area — have there been break-ins, vandalism, or insurance claims at this property in the last 3 years? What carrier currently insures it and at what premium?
- What's the average days-on-market for RENTAL listings here right now (not sales)? A rising rental-DOM trend means longer vacancies and softer asking-rent achievability than the comps imply.
- What's the recent tenant-quality profile in this submarket — average credit score on applications, eviction rate, late-payment / NSF rate, and stable-employment percentage? A property-management company in the area should have these aggregated.
- How much new for-sale + rental construction is in the pipeline within 1–3 miles? Heavy new supply typically softens prices + rents 12–24 months out; constrained supply supports both.
Investment metrics
- 1% rule
- 0.92% ✗
- Cap rate
- 6.38%
- Cash-on-cash
- 0.30%
- DSCR
- 1.01
- GRM
- 9.1
CMA / ARV
- ARV (on-the-fly)
- $259,072
- Comps found
- 1
Show comp detail 1 sale within ~0.75 mi
| Address | Dist | Beds/Ba | Sqft | Sold | Price | $/sf | Match |
|---|---|---|---|---|---|---|---|
| 1012 Suber St | 0.46mi | 3/2.0 | 1,389 (-1%) | 18mo | $255,000 | $184 | 62 |
Match score weights: distance 35% · size 25% · config 20% · recency 20%. Top-matched comps best support the ARV.
Projected returns pro-forma
-3.0% appreciation · 6.95% rent growth · sell at horizon
- IRR
- -11.3%
- Equity multiple
- 0.57×
- Total profit
- $-23,264
- Equity at exit
- $29,060
- IRR
- 3.0%
- Equity multiple
- 1.26×
- Total profit
- $13,959
- Equity at exit
- $16,851
Cash invested: $54,572 (down + closing). Projections, not guarantees.
Landlord ↔ Tenant lean methodology
- Overall (STATE)
- 90 Strongly Landlord-Friendly
- State South Carolina
- 90 Strongly Landlord-Friendly · R+6
- County
- — inherits STATE
- City
- — inherits STATE
ZIP-level market 29205
- Rents YoY
- 7.0%
- Active inventory
- 150
- Price-to-rent
- 9.1×
Monthly cashflow live
- Estimated rent
- $1,786 high interval (Pro) →
- Mortgage (P&I)
- −$1,022
- Tax from tax record
- −$293 /mo · $3,521/yr
- Insurance
- −$81
- HOA
- −$0
- Vacancy / Maint / Mgmt
- −$375
- Net cashflow
- $14
Break-even live
Sensitivity live
| Price | -10% $124 | -5% $69 | +0% $14 | +5% $-41 | +10% $-96 |
|---|---|---|---|---|---|
| Rent | -10% $-127 | -5% $-57 | +0% $14 | +5% $84 | +10% $155 |
| Rate | -1.0pp $112 | -0.5pp $63 | base $14 | +0.5pp $-37 | +1.0pp $-88 |
UW: 25.0% down · 7.5% · 30yr · 1.5% tax · 5.0% vac · 8.0% maint · 8.0% mgmt
Financing live
Cash to close
- Down payment
- $48,725
- Closing costs
- $5,847
- Reserves months
- —
- Total cash needed
- —
Loan-product check · same deal, 3 products live
Conventional
25% down · 7.5% · 30yr
- Down + closing
- —
- Monthly P&I
- —
- Monthly cashflow
- —
- DSCR
- —
- Eligible?
- —
Personal DTI + credit; lowest rate.
DSCR
20% down · 8.5% · 30yr
- Down + closing
- —
- Monthly P&I
- —
- Monthly cashflow
- —
- DSCR
- —
- Eligible?
- —
No personal income docs; deal must DSCR.
Hard money
10% down · 12.0% · 12mo
- Down + closing
- —
- Monthly P&I
- —
- Monthly cashflow
- —
- DSCR
- —
- Eligible?
- —
Short-term bridge; refi at stabilization.
Rent comps 27 comps
| Address | Beds | Baths | Sqft | Rent | $/sqft | DOM | Units | Dist |
|---|---|---|---|---|---|---|---|---|
| 1324 Deerwood St Unit 1 Columbia, SC | 2.0 | 2.0 | 1030 | $1,350 | $1.31 | 25d | 1 | 0.23mi |
| 1649 S Beltline Blvd Columbia, SC | 2.0 | 1.0 | 900 | $1,250 | $1.39 | 25d | 1 | 0.36mi |
| 1840 Tall Pines Cir Columbia, SC | 3.0 | 1.5 | 1021 | $1,350 | $1.32 | 16d | 1 | 0.53mi |
| 914 Chevis St Columbia, SC | 3.0 | 2.0 | 1280 | $2,100 | $1.64 | 25d | 1 | 0.55mi |
| 1 Tempo Ct Columbia, SC | 3.0 | 1.5 | 1032 | $1,745 | $1.69 | 25d | 1 | 0.57mi |
| 21 Tempo Ct Columbia, SC | 3.0 | 1.5 | 1032 | $1,498 | $1.45 | 13d | 1 | 0.60mi |
| 828 Suber St Unit E Columbia, SC | 2.0 | 1.0 | 1100 | $995 | $0.90 | 13d | 1 | 0.63mi |
| 3901 Bright Ave Columbia, SC | 3.0 | 1.0 | 1047 | $1,380 | $1.32 | 16d | 1 | 0.65mi |
| 721 Deerwood St Columbia, SC | 2.0 | 1.0 | 1000 | $1,150 | $1.15 | 16d | 1 | 0.73mi |
| 13 Acme St Columbia, SC | 3.0 | 1.0 | 900 | $1,300 | $1.44 | 25d | 1 | 0.77mi |
| 102 Burdock Cir Columbia, SC | 4.0 | 2.0 | 1451 | $1,550 | $1.07 | 23d | 1 | 0.78mi |
| 3425 Manor Ave Columbia, SC | 3.0 | 2.0 | 1200 | $2,100 | $1.75 | 13d | 1 | 0.81mi |
| 3800 Overbrook Dr Columbia, SC | 4.0 | 2.0 | 1800 | $2,400 | $1.33 | 25d | 1 | 0.84mi |
| 3840 Overbrook Dr Columbia, SC | 2.0 | 2.0 | 900 | $1,595 | $1.77 | 25d | 1 | 0.86mi |
| 524 S Beltline Blvd Columbia, SC | 2.0 | 1.0 | 1050 | $1,300 | $1.24 | 25d | 1 | 0.93mi |
| 501 Pelham Dr Columbia, SC | 1.0–2.0 | 1.0–2.0 | 805 | $1,625 | $2.02 | 4d | 24 | 1.05mi |
| 500 Gills Creek Pkwy Columbia, SC | 1.0–2.0 | 1.0–2.0 | 807 | $1,375 | $1.70 | 13d | 27 | 1.12mi |
| 2725 Kingswood Dr Columbia, SC | 3.0 | 1.0 | 940 | $1,500 | $1.60 | 25d | 1 | 1.13mi |
| 3925 Rosewood Dr Columbia, SC | 4.0 | 2.0 | 1683 | $4,800 | $2.85 | 25d | 1 | 1.18mi |
| 19 Graymont Cir Unit NA Columbia, SC | 3.0 | 2.0 | 1250 | $2,400 | $1.92 | 25d | 1 | 1.25mi |
| 1 Graymont Cir Columbia, SC | 3.0 | 2.5 | 1400 | $2,175 | $1.55 | 25d | 1 | 1.26mi |
| 114 Easy St Columbia, SC | 2.0 | 2.0 | 1100 | $1,500 | $1.36 | 13d | 1 | 1.27mi |
| 317 Beltline Blvd Unit 1 Columbia, SC | 3.0 | 1.0 | 1150 | $1,200 | $1.04 | 25d | 1 | 1.30mi |
| 2218 Holt Dr Columbia, SC | 4.0 | 3.5 | 1400 | $2,400 | $1.71 | 25d | 1 | 1.32mi |
| 4319 Wilmot Ave Columbia, SC | 3.0 | 1.0 | 1000 | $1,650 | $1.65 | 25d | 1 | 1.38mi |
| 3125 Heyward St Unit B Columbia, SC | 2.0 | 1.0 | 1100 | $1,600 | $1.45 | 25d | 1 | 1.45mi |
| 3125 Heyward St Unit A Columbia, SC | 3.0 | 1.0 | 1200 | $2,400 | $2.00 | 25d | 1 | 1.45mi |
Listing history 26 events
-
2026-06-21days on market $194,900 Active 151 DOM
-
2026-06-18days on market $194,900 Active 148 DOM
-
2026-06-17days on market $194,900 Active 147 DOM
-
2026-06-16days on market $194,900 Active 146 DOM
-
2026-06-15pricedays on market $194,900 Active 145 DOM
-
2026-06-14days on market $204,900 Active 143 DOM
-
2026-06-10days on market $204,900 Active 140 DOM
-
2026-06-09days on market $204,900 Active 139 DOM
-
2026-06-08days on market $204,900 Active 138 DOM
-
2026-06-07days on market $204,900 Active 137 DOM
-
2026-06-03days on market $204,900 Active 133 DOM
-
2026-06-03days on market $204,900 Active 132 DOM
-
2026-06-01days on market $204,900 Active 131 DOM
-
2026-05-31days on market $204,900 Active 130 DOM
-
2026-05-13price $204,900
-
2026-04-19price $209,900
-
2026-03-26price $219,900
-
2026-03-06price $224,900
-
2026-02-25price $229,900
-
2026-01-21$234,900 Active
-
2017-08-02soldstatus $554,200
-
2017-04-12soldstatus $64,000
-
2016-04-26price $99,000
-
2016-01-30price $112,500
-
2015-10-08price $121,900
-
2015-08-26price $125,000
ⓘ Source: listings_history table (triggers on properties + properties_extension) + one-shot
backfill from property_details.listing_events for pre-trigger history.
Tax reassessment forecast SC · Resets to sale price
- Current annual tax
- $3,521 · $293/mo
- Projected year-2 tax
- $3,521 · $293/mo
- Expected delta
- $0/yr ($0/mo · 0.0%)
ⓘ Screening estimate from a state-policy table — verify with the county assessor before closing.
Climate risk First Street
- Flood 1/10 Low FEMA zone X (unshaded) · 0% chance over 30 yrs
- Wildfire 3/10 Moderate
- Heat 7/10 Severe 7 d/yr ≥109°F today · 16 d/yr by 30 yrs out
- Wind 6/10 Major 72% chance of damaging wind over 30 yrs
- Air quality 3/10 Moderate 2 unhealthy d/yr today · 2 by 30 yrs out
Nearby sold comps map
Loading sold comps map…
Walkable amenities ~0.75 mi
Loading nearby amenities…
Taxation est. · year 1
- Rental income
- $21,426
- − Mortgage interest
- −$10,917
- − Property taxes
- −$3,521
- − Insurance
- −$974
- − Repairs & maintenance
- −$1,714
- − Management
- −$1,714
- − Depreciation
- −$5,670
- Taxable loss
- −$3,085
- Est. tax savings @ 24.0%
- +$740
- After-tax cash flow
- $907/yr
For passive investors: Depreciation is non-cash, so a rental often shows a tax loss while cash-flowing — sheltering income. Rental losses are passive: they offset passive income freely, and up to $25,000/yr can offset ordinary (W-2) income if you actively participate and your MAGI is under $100k (phasing out to $0 by $150k); unused losses carry forward. On sale, claimed depreciation is recaptured at up to 25%, and gains may owe capital-gains tax (a 1031 exchange can defer both). Figures are a year-1 estimate at your 24.0% rate — not tax advice; consult a CPA.
Schools (NCES district)
- District
- Richland 01
- NCES district ID
- 4503360
- Math proficiency
- 26% ▼ -7.00%
- Reading proficiency
- 36% ▼ -5.00%
- Median HH income
- $38,931
- Composite
- 25.94/100
- National rank
- #7335
- State rank
- #54 of 80 in SC
Livability — Columbia
- Score
- 78/100
- State rank
- #18
- US rank
- #2436
Category grades
Schools grade is shown separately in the Schools card above.
Census & demographics
- County
- Richland County · 389,530 people
- City population
- 335,994
- Metro
- Columbia, SC
- Population (ZIP)
- 22,223
- Household income
- $64,231
- Rent vs Own
- Severe rent burden
- 1372.0
Population outlook (Richland County) Hauer SSP2
- Today (2025)
- 459,667 people
- By 2030
- 487,524 · +6.1%
- By 2040
- 542,035 · +17.9%
- By 2050
- 595,371 · +29.5%
- By 2075
- 732,998 · +59.5%
- By 2100
- 820,415 · +78.5%
Race, ethnicity, and origin ACS 2023
- Neighborhood character
- Predominantly White (73%)
- Race & ethnicity
- White 73% Black 16% Two or more races 6% Hispanic / Latino 5% Asian 3%
- Common ancestry
- Serbian 6% Slovak 4% Lithuanian 3%
- Foreign-born
- 4% · Canada, China
- Languages at home
- 93% English-only · Spanish 3% German/W. Germanic 1% Chinese 1%
Political lean MEDSL · Richland
- 2024 margin
- Solid D (+34.6) · D 66.4% · R 31.8% · Other 1.8%
- 2008→2024 swing
- +5.7pp toward D · 2008: 28.9pp · 2024: 34.6pp
- All cycles
- 2024: D+34.6 2020: D+38.3 2016: D+32.9 2012: D+33.3 2008: D+28.9
Not yet ingested
- Civics
- —
Market trends
- HPI YoY
- ▼ -457.47%
- Current HPI
- 230.5538
- Rent YoY
- ▲ 6.95%
- Metro
- Columbia, SC
- State GDP YoY
- ▲ 4.51%
- F500 in state
- 2
Industry mix (Fortune 500 HQ in SC)
| Industry | F500 HQs | Revenue |
|---|---|---|
| Packaging | 1 | $7B |
|
||
Price history
+63.9% since first listed12 events — show timeline
- 2026-05-13 Price Changed $204,900 Consolidated MLS
- 2026-04-19 Price Changed $209,900 Consolidated MLS
- 2026-03-26 Price Changed $219,900 Consolidated MLS
- 2026-03-06 Price Changed $224,900 Consolidated MLS
- 2026-02-25 Price Changed $229,900 Consolidated MLS
- 2026-01-21 Listed $234,900 Consolidated MLS
- 2017-08-02 Sold (Public Records) $554,200 Public Records
- 2017-04-12 Sold (Public Records) $64,000 Public Records
- 2016-04-26 Price Changed $99,000 Consolidated MLS
- 2016-01-30 Price Changed $112,500 Consolidated MLS
- 2015-10-08 Price Changed $121,900 Consolidated MLS
- 2015-08-26 Price Changed $125,000 Consolidated MLS
Property tax history
+14.8%/yrLatest (2025): $3,521 · +2.5% YoY. Source: county tax records.
Cash-flow waterfall
monthlySold comps — $/sqft
last 12 mo · ≤1 miLoading sold comps…