 Duplex
7508 / 7510 Hanover Ln · North Richland Hills, TX
Flood risk 1/10 · Minimal
- FEMA flood zone
- X (unshaded)
- Chance of flooding over 30 yrs
- 0.0%
- Est. flood insurance / yr
- $507 – $1,088
Fire risk 1/10 · Minimal
- Est. fire insurance / yr
- $1,222 – $2,270
Heat risk 7/10 · Major
- Hot days now (above 109°F)
- 7 days/yr
- Hot days in 30 yrs
- 23 days/yr
Wind risk 6/10 · Moderate
- Chance of severe wind over 30 yrs
- 27.0%
Air-quality risk 3/10 · Minor
- Unhealthy air days now
- 3 days/yr
- Unhealthy air days in 30 yrs
- 4 days/yr
Risk factors via First Street. Map © Google.
Why this score? — see what drove the C+ grade
The composite is a weighted blend of 9 inputs, each scored 0–100. Each bar is that input's sub-score; the figure is the points it added to the 100-point composite (weight × sub-score).
- Cash flow +22.7/30.0
- ARV discount +15.0/15.0
- DSCR +7.3/10.0
- 1% rule +6.7/10.0
- Schools +3.7/10.0
- Livability +3.6/5.0
- Condition / age +2.5/5.0
- Rent growth +2.1/5.0
- Appreciation +0.0/10.0
$295,000
🖨 Deal sheet 📄 Offer letter ✓ Due diligence
Multi-family units
County records classify this as Multi-Family (2-4 Unit). Listing-text estimate: 2 units. confirmed
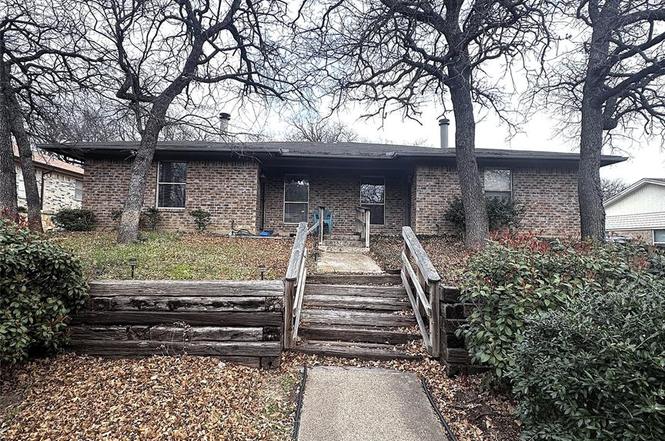
Listing remarks
Income-producing duplex in sought-after North Richland Hills. Each unit offers 2 bedrooms, 2 bathrooms, and rear carport parking, providing comfortable living for tenants and low-maintenance ownership for investors. Both sides are currently occupied by long-term tenants who would love to stay, creating immediate rental income potential. Ideal opportunity to add a stable asset to your portfolio or live in one unit while the other helps offset your mortgage. Strong rental demand and an excellent location make this a smart investment.
Key facts
- 9,583 sq ft lot
- 2 parking spots
- Built 1984
Neighborhood map
What this means for you Summary
Snapshot
- This is a 2 × 2-bed/2.0-bath units multifamily listed at $295k.
Deal economics
- At list price, monthly cash flow is $506 ($6k/yr) — positive. Per door: $253/mo.
- The deal already cash-flows at list — no discount required.
- Meets the 1% rule at list price ($3k rent vs $295k).
- Cap rate 8.4% vs local median 3.6% in North Richland Hills — top-decile yield for the area; either an underpriced asset or a hidden risk that comps aren't pricing in. Stress-test before assuming the spread holds.
Location & tenants
- Location reads 71/100 on livability (#286 in TX) — a middle-class / working-renter tenant base. Strengths: housing A+, cost of living A, employment A-; Watch: amenities F, commute F, health & safety D-.
- Birdville ISD (suburban): math 42% / reading 43% proficiency, ranked #299 of 826 in TX (top 36%) — families likely to look elsewhere, expect single-tenant / working-renter base with shorter leases.
- Zoned schools: Birdville El (math 22% / reading 32%, grade F, #2,791 of 4,322 statewide, top 68%, 489 students, 85% FRL) — zoned schools average 85% FRL vs 48% district-wide (37 pts higher); higher-poverty schools than district average — tighter screening recommended.
- Zoned-school proficiency averages 27% at this address vs 42% district-wide (-16 pts) — the specific schools serving this property underperform the Birdville ISD average; the district grade overstates school quality for this exact location.
- Market conditions: Rents soft (-1.6%/yr); 152 active listings in the ZIP; 34 comparable units currently listed for rent nearby; rentals lingering (median 44d on market — plan ~5-8 weeks vacancy on turnover, expect pricing pressure); 56% of comp listings sitting > 30 days — soft ceiling on asking rent; solid renter incomes; 18,938 units permitted in Tarrant County in 2024 (8,336 in 5+ unit buildings).
- At $3,444/mo this rent would consume 51% of the median local household income ($82k/yr) (locally 1551% of renters already pay >50% of income on rent) — very limited rent-growth headroom before tenants either downsize or default.
Forward outlook
- Local home prices are declining (-3.0%/yr); year-one equity from $2k of loan paydown is wiped out by about $9k of value loss. Plan a longer hold.
- Tarrant County population projected at +41% by 2050 — long-run rental-demand tailwind backs the buy-and-hold thesis.
Negotiation context
- Only 8 days on market — expect competitive offers; lowballing is unlikely to land.
Risks & watch-outs
- Climate carrying-cost: major wind risk, 27% chance of damaging wind over 30y; extreme-heat days projected 7→23/yr by 2055 (HVAC capex compounding) — expect insurance premiums to compound above CPI over the hold.
Questions for the listing agent
- Can we see the unit-by-unit rent roll, current vacancy, and any below-market leases? What's the average tenancy length?
- What capital expenditures (roof, boiler, parking lot, exteriors) have been made in the last 5 years, and what's planned in the next 2?
- Is there a deadline driving the sale (1031 exchange, divorce, estate, relocation)? That informs how much negotiation room exists.
- Schools are B-rated — typically a magnet for longer-tenancy family renters. What's the average tenant stay here, and is there a school-zone premium baked into asking?
- What's the average days-on-market for RENTAL listings here right now (not sales)? A rising rental-DOM trend means longer vacancies and softer asking-rent achievability than the comps imply.
- What's the recent tenant-quality profile in this submarket — average credit score on applications, eviction rate, late-payment / NSF rate, and stable-employment percentage? A property-management company in the area should have these aggregated.
- How much new apartment / multifamily construction is in the pipeline within 1–3 miles? Heavy new supply (>2% of stock underway) typically softens rents 12–24 months out; light construction supports rent growth.
Investment metrics
- 1% rule
- 1.17% ✓
- Cap rate
- 8.35%
- Cash-on-cash
- 7.36%
- DSCR
- 1.33
- GRM
- 7.1
CMA / ARV
- ARV (on-the-fly)
- $398,490
- Comps found
- 1
Show comp detail 1 sale within ~0.75 mi
| Address | Dist | Beds/Ba | Sqft | Sold | Price | $/sf | Match |
|---|---|---|---|---|---|---|---|
| 7022 Lincoln Dr | 0.07mi | 4/4.0 | 2,154 (0%) | 24mo | $399,000 | $185 | 69 |
Match score weights: distance 35% · size 25% · config 20% · recency 20%. Top-matched comps best support the ARV.
Projected returns pro-forma
-3.0% appreciation · 0.0% rent growth · sell at horizon
- IRR
- -8.7%
- Equity multiple
- 0.69×
- Total profit
- $-25,477
- Equity at exit
- $43,985
- IRR
- -4.1%
- Equity multiple
- 0.77×
- Total profit
- $-19,003
- Equity at exit
- $25,506
Cash invested: $82,600 (down + closing). Projections, not guarantees.
Landlord ↔ Tenant lean methodology
- Overall (STATE)
- 87 Strongly Landlord-Friendly
- State Texas
- 87 Strongly Landlord-Friendly · R+5
- County
- — inherits STATE
- City
- — inherits STATE
ZIP-level market 76180
- Rents YoY
- -1.6%
- Active inventory
- 152
- Price-to-rent
- 14.3×
Monthly cashflow live
- Estimated rent
- $3,444 high interval (Pro) →
- Mortgage (P&I)
- −$1,547
- Tax from tax record
- −$544 /mo · $6,532/yr
- Insurance
- −$123
- HOA
- −$0
- Vacancy / Maint / Mgmt
- −$723
- Net cashflow
- $506
Break-even live
2-unit breakdown (identical units grouped — click to expand)
| Units | Beds | Baths | Est. rent |
|---|---|---|---|
| 2× units | 2 | 2 | $3,444 |
| #1 | 2 | 2 | $1,722 |
| #2 | 2 | 2 | $1,722 |
| Total (2 units) | $3,444 | ||
UW: 25.0% down · 7.5% · 30yr · 1.5% tax · 5.0% vac · 8.0% maint · 8.0% mgmt
Financing live
Cash to close
- Down payment
- $73,750
- Closing costs
- $8,850
- Reserves months
- —
- Total cash needed
- —
Loan-product check · same deal, 3 products live
Conventional
25% down · 7.5% · 30yr
- Down + closing
- —
- Monthly P&I
- —
- Monthly cashflow
- —
- DSCR
- —
- Eligible?
- —
Personal DTI + credit; lowest rate.
DSCR
20% down · 8.5% · 30yr
- Down + closing
- —
- Monthly P&I
- —
- Monthly cashflow
- —
- DSCR
- —
- Eligible?
- —
No personal income docs; deal must DSCR.
Hard money
10% down · 12.0% · 12mo
- Down + closing
- —
- Monthly P&I
- —
- Monthly cashflow
- —
- DSCR
- —
- Eligible?
- —
Short-term bridge; refi at stabilization.
Rent comps 34 comps
| Address | Beds | Baths | Sqft | Rent | $/sqft | DOM | Units | Dist |
|---|---|---|---|---|---|---|---|---|
| 6872 Greenleaf Dr North Richland Hills, TX | 5.0 | 3.0 | 2390 | $9,750 | $4.08 | 43d | 1 | 0.09mi |
| 6872 Greenleaf Dr Unit 1319943P North Richland Hills, TX | 5.0 | 3.0 | 2389 | $17,285 | $7.24 | 21d | 1 | 0.09mi |
| 6840 N Park Dr North Richland Hills, TX | 3.0 | 2.5 | 2367 | $2,675 | $1.13 | 43d | 1 | 0.17mi |
| 6869 Dogwood Ct North Richland Hills, TX | 3.0 | 2.5 | 1887 | $2,545 | $1.35 | 43d | 1 | 0.19mi |
| 6736 Starnes Rd North Richland Hills, TX | 5.0 | 2.5 | 2515 | $3,375 | $1.34 | 43d | 1 | 0.45mi |
| 7008 Hanging Cliff Pl North Richland Hills, TX | 3.0 | 2.0 | 1441 | $2,095 | $1.45 | 43d | 1 | 0.47mi |
| 6620 Moss Ln Watauga, TX | 3.0 | 2.0 | 1659 | $2,250 | $1.36 | 3d | 1 | 0.62mi |
| 6621 North Park Dr Watauga, TX | 3.0 | 2.0 | 1401 | $2,085 | $1.49 | 24d | 1 | 0.63mi |
| 6629 High Lawn Ter Watauga, TX | 3.0 | 2.0 | 1497 | $2,150 | $1.44 | 17d | 1 | 0.65mi |
| 8041 Miles Dr Unit LO Watauga, TX | 3.0 | 2.0 | 1568 | $2,095 | $1.34 | 16d | 1 | 0.70mi |
| 6569 Westridge Dr Watauga, TX | 3.0 | 2.5 | 1487 | $2,050 | $1.38 | 43d | 1 | 0.73mi |
| 6548 Fairview Dr Watauga, TX | 3.0 | 2.0 | 1733 | $2,950 | $1.70 | 43d | 1 | 0.80mi |
| 7512 Brentwood Ct North Richland Hills, TX | 5.0 | 2.0 | 2093 | $9,750 | $4.66 | 43d | 1 | 0.82mi |
| 7512 Brentwood Ct Unit 1019529P North Richland Hills, TX | 5.0 | 2.0 | 2088 | $19,067 | $9.13 | 24d | 1 | 0.82mi |
| 7313 Century Dr North Richland Hills, TX | 3.0 | 2.0 | 1910 | $2,375 | $1.24 | 43d | 1 | 0.82mi |
| 6444 Whitehurst Dr Watauga, TX | 3.0 | 3.0 | 1610 | $2,450 | $1.52 | 43d | 1 | 1.03mi |
| 2136 Stoneridge Dr Keller, TX | 3.0 | 2.0 | 1765 | $1,995 | $1.13 | 21d | 1 | 1.03mi |
| 6421 Alta Vista Dr Watauga, TX | 4.0 | 2.0 | 1596 | $2,165 | $1.36 | 43d | 1 | 1.07mi |
| 8221 Mark Ln Watauga, TX | 3.0 | 2.0 | 1411 | $2,900 | $2.06 | 24d | 1 | 1.10mi |
| 2114 Rustic Ridge Dr Keller, TX | 5.0 | 2.5 | 2390 | $3,650 | $1.53 | 4d | 1 | 1.16mi |
| 6400 High Lawn Ter Watauga, TX | 3.0 | 2.0 | 1430 | $2,155 | $1.51 | 43d | 1 | 1.17mi |
| 6355 Starnes Rd Watauga, TX | 3.0 | 2.5 | 1956 | $2,600 | $1.33 | 21d | 1 | 1.18mi |
| 7033 Payte Ln North Richland Hills, TX | 3.0 | 1.5 | 1476 | $1,995 | $1.35 | 43d | 1 | 1.21mi |
| 8113 Starnes Rd North Richland Hills, TX | 3.0 | 2.0 | 1638 | $2,125 | $1.30 | 17d | 1 | 1.24mi |
| 7013 Lincolnshire Ln North Richland Hills, TX | 3.0 | 2.0 | 1419 | $2,200 | $1.55 | 24d | 1 | 1.26mi |
| 7013 Lincolnshire Ln North Richland Hills, TX | 3.0 | 2.0 | 1419 | $2,000 | $1.41 | 2d | 1 | 1.26mi |
| 6132 Bursey Rd Watauga, TX | 3.0 | 2.5 | 1609 | $2,650 | $1.65 | 18d | 1 | 1.27mi |
| 6329 North Park Dr Watauga, TX | 3.0 | 2.0 | 1621 | $2,195 | $1.35 | 43d | 1 | 1.28mi |
| 6116 Bursey Rd Watauga, TX | 3.0 | 3.0 | 1613 | $2,750 | $1.70 | 43d | 1 | 1.29mi |
| 6541 Wakefield Rd Unit N North Richland Hills, TX | 3.0 | 2.0 | 1564 | $1,800 | $1.15 | 43d | 1 | 1.35mi |
| 7001 Newcastle Pl North Richland Hills, TX | 3.0 | 2.0 | 1455 | $2,400 | $1.65 | 43d | 1 | 1.38mi |
| 6705 Nola Ct Watauga, TX | 3.0 | 2.0 | 1792 | $2,500 | $1.40 | 43d | 1 | 1.41mi |
| 6000 Bursey Rd Unit 1521925P Watauga, TX | 3.0 | 2.0 | 1614 | $4,891 | $3.03 | 1d | 1 | 1.45mi |
| 5968 Bursey Rd Watauga, TX | 3.0 | 2.5 | 2261 | $2,950 | $1.30 | 43d | 1 | 1.49mi |
Listing history 4 events
-
2026-03-23status Pending
-
2026-03-15$295,000 Active
-
1993-11-10soldstatus
-
1986-10-16soldstatus
ⓘ Source: listings_history table (triggers on properties + properties_extension) + one-shot
backfill from property_details.listing_events for pre-trigger history.
Tax reassessment forecast TX · Resets to sale price
- Current annual tax
- $6,532 · $544/mo
- Projected year-2 tax
- $6,532 · $544/mo
- Expected delta
- $0/yr ($0/mo · 0.0%)
ⓘ Screening estimate from a state-policy table — verify with the county assessor before closing.
Climate risk First Street
- Flood 1/10 Low FEMA zone X (unshaded) · 0% chance over 30 yrs
- Wildfire 1/10 Low
- Heat 7/10 Severe 7 d/yr ≥109°F today · 23 d/yr by 30 yrs out
- Wind 6/10 Major 27% chance of damaging wind over 30 yrs
- Air quality 3/10 Moderate 3 unhealthy d/yr today · 4 by 30 yrs out
Nearby sold comps map
Loading sold comps map…
Walkable amenities ~0.75 mi
Loading nearby amenities…
Taxation est. · year 1
- Rental income
- $41,328
- − Mortgage interest
- −$16,525
- − Property taxes
- −$6,532
- − Insurance
- −$1,475
- − Repairs & maintenance
- −$3,306
- − Management
- −$3,306
- − Depreciation
- −$8,582
- Taxable income
- $1,602
- Est. tax owed @ 24.0%
- −$384
- After-tax cash flow
- $5,693/yr
For passive investors: Depreciation is non-cash, so a rental often shows a tax loss while cash-flowing — sheltering income. Rental losses are passive: they offset passive income freely, and up to $25,000/yr can offset ordinary (W-2) income if you actively participate and your MAGI is under $100k (phasing out to $0 by $150k); unused losses carry forward. On sale, claimed depreciation is recaptured at up to 25%, and gains may owe capital-gains tax (a 1031 exchange can defer both). Figures are a year-1 estimate at your 24.0% rate — not tax advice; consult a CPA.
Schools (NCES district)
- District
- Birdville ISD
- NCES district ID
- 4810230
- Math proficiency
- 42% ▼ -12.00%
- Reading proficiency
- 43% ▼ -6.00%
- Median HH income
- $55,930
- Composite
- 37.13/100
- National rank
- #4491
- State rank
- #299 of 826 in TX
Livability — North Richland Hills
- Score
- 71/100
- State rank
- #286
- US rank
- #6602
Category grades
Schools grade is shown separately in the Schools card above.
Census & demographics
- Census place
- North Richland Hills, TX
- County
- Tarrant County · 2,033,669 people
- City population
- 68,613
- Metro
- Dallas-Fort Worth-Arlington, TX
- Population (ZIP)
- 38,371
- Household income
- $81,503
- Rent vs Own
- Severe rent burden
- 1551.0
Population outlook (Tarrant County) Hauer SSP2
- Today (2025)
- 2,380,417 people
- By 2030
- 2,578,900 · +8.3%
- By 2040
- 2,974,995 · +25.0%
- By 2050
- 3,350,489 · +40.8%
- By 2075
- 4,216,909 · +77.2%
- By 2100
- 4,741,527 · +99.2%
Race, ethnicity, and origin ACS 2023
- Neighborhood character
- Diverse neighborhood (Simpson 0.55)
- Race & ethnicity
- White 62% Hispanic / Latino 22% Two or more races 10% Black 9% Asian 2% Native American 1%
- Hispanic origin (detail)
- Mexican 17% Puerto Rican 2%
- Common ancestry
- Slovak 3% Serbian 2% Lithuanian 2%
- Foreign-born
- 12% · Canada, Vietnam, South Korea
- Languages at home
- 78% English-only · Spanish 14% Other Indo-European 3% French/Haitian/Cajun 2%
Political lean MEDSL · Tarrant
- 2024 margin
- Lean R (+5.1) · D 46.7% · R 51.9% · Other 1.4%
- 2008→2024 swing
- +6.6pp toward D · 2008: -11.7pp · 2024: -5.1pp
- All cycles
- 2024: R+5.1 2020: D+0.2 2016: R+8.7 2012: R+15.7 2008: R+11.7
Not yet ingested
- Civics
- —
Market trends
- HPI YoY
- ▼ -223.22%
- Current HPI
- 279.046
- Rent YoY
- ▼ -1.60%
- Metro
- Dallas-Fort Worth-Arlington, TX
- State GDP YoY
- ▲ 3.95%
- F500 in state
- 110
Industry mix (Fortune 500 HQ in TX)
| Industry | F500 HQs | Revenue |
|---|---|---|
| Energy | 16 | $1,198B |
|
||
| Technology | 5 | $198B |
|
||
| Engineering / Construction | 4 | $72B |
|
||
| Energy Services | 3 | $60B |
|
||
| Utilities | 3 | $41B |
|
||
| Healthcare | 2 | $330B |
|
||
Price history
4 events — show timeline
- 2026-03-23 Pending — NTREIS
- 2026-03-15 Listed $295,000 NTREIS
- 1993-11-10 Sold (Public Records) — Public Records
- 1986-10-16 Sold (Public Records) — Public Records
Property tax history
+4.1%/yrLatest (2025): $6,532 · -1.0% YoY. Source: county tax records.
Cash-flow waterfall
monthlySold comps — $/sqft
last 12 mo · ≤1 miLoading sold comps…