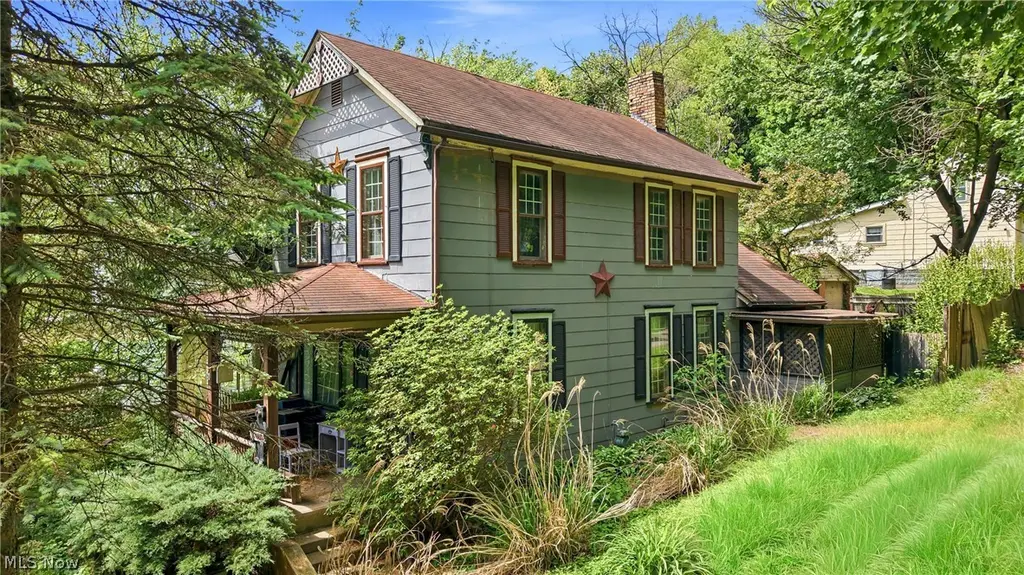
341 Canton St · East Liverpool, OH
Flood risk 1/10 · Minimal
- FEMA flood zone
- X (unshaded)
- Chance of flooding over 30 yrs
- 0.0%
- Est. flood insurance / yr
- $473 – $860
Fire risk 1/10 · Minimal
- Est. fire insurance / yr
- $713 – $1,323
Heat risk 3/10 · Minor
- Hot days now (above 97°F)
- 7 days/yr
- Hot days in 30 yrs
- 16 days/yr
Wind risk 1/10 · Minimal
- Chance of severe wind over 30 yrs
- —
Air-quality risk 2/10 · Minimal
- Unhealthy air days now
- 1 days/yr
- Unhealthy air days in 30 yrs
- 2 days/yr
Risk factors via First Street. Map © Google.
Why this score? — see what drove the B- grade
The composite is a weighted blend of 9 inputs, each scored 0–100. Each bar is that input's sub-score; the figure is the points it added to the 100-point composite (weight × sub-score).
- Cash flow +30.0/30.0
- 1% rule +10.0/10.0
- DSCR +10.0/10.0
- ARV discount +7.5/15.0
- Livability +3.4/5.0
- Schools +2.7/10.0
- Rent growth +2.5/5.0
- Condition / age +2.5/5.0
- Appreciation +0.0/10.0
$34,900
🖨 Deal sheet (PDF) 📄 Offer letter ✓ Due diligence
Listing remarks
Investor Special! Opportunity to renovate this home and make it your own! Awesome potential with great upside. This is a 2 bed, 1.5 bath, 1,386 sq ft home. Being sold as is.
Key facts
- 6,642 sq ft lot
- 2 garage spots
- Built 1930
Property features AI
Exterior
- Parking: Detached garage; 2 garage spaces
- Utilities: Public water; Public sewer
- Home design: Wood-sided exterior; Composition roof; Above-grade finished living area approximately 1,386
- Construction: Wood siding construction; Composition roof
- Exterior features: Lot about 0.1525 acres; Property listed as fixer condition
Interior
- Kitchen: Kitchen on the first floor (14 x 15)
- Bedrooms: Bedroom on the first floor (10 x 10)
- Bathrooms: 2 full bathrooms
- Heating & cooling: Heating via fireplace(s); Window cooling units
- Interior features: Full basement; Wood-burning fireplace (1)
Neighborhood map
What this means for you Summary
Snapshot
- This is a 2-bed/2.0-bath single-family listed at $35k.
Deal economics
- At list price, monthly cash flow is $261 ($3k/yr) — positive.
- The deal already cash-flows at list — no discount required.
- Meets the 1% rule at list price ($712 rent vs $35k).
- Recommended offer: $34k (1.5% below list) — sets the bar for market timing.
- Cap rate 15.3% vs local median 9.4% in East Liverpool — top-decile yield for the area; either an underpriced asset or a hidden risk that comps aren't pricing in. Stress-test before assuming the spread holds.
Location & tenants
- Location reads 67/100 on livability (#613 in OH) — a middle-class / working-renter tenant base. Strengths: cost of living A+, housing A+, health & safety A+; Watch: amenities F, commute F, employment F.
- East Liverpool City (town): math 28% / reading 37% proficiency, ranked #571 of 656 in OH (top 87%) — families likely to look elsewhere, expect single-tenant / working-renter base with shorter leases; 78% free/reduced lunch — lower-income household profile, screen leases tightly.
- Market conditions: 115 active listings in the ZIP; 2 comparable units currently listed for rent nearby; 49 units permitted in Columbiana County in 2024 (0 in 5+ unit buildings).
- This rent is only 17% of the median local income ($51k/yr) — well below the 30% rent-burden line; pricing power to push rent on renewal without tenant pushback.
Forward outlook
- Local home prices are declining (-3.0%/yr); year-one equity from $241 of loan paydown is wiped out by about $1k of value loss. Plan a longer hold.
- Columbiana County population projected at -23% by 2050 — secular population decline; favor cash flow + early exit over multi-decade hold.
- At projected returns (-3.0% appreciation + 3.0% rent growth), your $10k cash investment doubles in ~4 years — after that, you're playing with house money.
Negotiation context
- It's been on market 18 days — a 2% lower offer ($34k) is reasonable based on typical stale-listing flexibility.
Risks & watch-outs
- Watch-outs: property tax is 3.6% of price; built in 1930 — expect roof / HVAC / electrical / plumbing capex.
Questions for the listing agent
- Built in 1930 — when were the roof, HVAC, electrical panel, plumbing, and water heater last replaced?
- Property tax is high relative to price — has the assessment been appealed recently, and will the sale trigger a re-assessment?
- Is there a deadline driving the sale (1031 exchange, divorce, estate, relocation)? That informs how much negotiation room exists.
- What's the average days-on-market for RENTAL listings here right now (not sales)? A rising rental-DOM trend means longer vacancies and softer asking-rent achievability than the comps imply.
- What's the recent tenant-quality profile in this submarket — average credit score on applications, eviction rate, late-payment / NSF rate, and stable-employment percentage? A property-management company in the area should have these aggregated.
- How much new for-sale + rental construction is in the pipeline within 1–3 miles? Heavy new supply typically softens prices + rents 12–24 months out; constrained supply supports both.
Investment metrics
- 1% rule
- 2.04% ✓
- Cap rate
- 15.27%
- Cash-on-cash
- 32.07%
- DSCR
- 2.43
- GRM
- 4.1
CMA / ARV
- ARV (on-the-fly)
- $91,476
- Comps found
- 12
Show comp detail 12 sales within ~0.75 mi
| Address | Dist | Beds/Ba | Sqft | Sold | Price | $/sf | Match |
|---|---|---|---|---|---|---|---|
| 1714 Allison St | 0.22mi | 3/1.0 (+1) | 1,328 (-4%) | 4mo | $118,500 | $89 | 70 |
| 920 Mckinnon Ave | 0.56mi | 2/1.5 | 1,400 (+1%) | 4mo | $55,000 | $39 | 67 |
| 622 Blackmore St | 0.27mi | 3/1.5 (+1) | 1,344 (-3%) | 13mo | $110,000 | $82 | 65 |
| 1955 St Clair Ave | 0.23mi | 3/3.0 (+1) | 1,496 (+8%) | 8mo | $170,000 | $114 | 60 |
| 628 Fisher Ave | 0.23mi | 3/1.0 (+1) | 1,546 (+12%) | 5mo | $170,000 | $110 | 57 |
| 626 Garner Ave | 0.38mi | 3/1.0 (+1) | 1,448 (+4%) | 12mo | $90,000 | $62 | 56 |
| 1507 Saint Clair Ave | 0.39mi | 3/1.0 (+1) | 1,232 (-11%) | 2mo | $28,000 | $23 | 53 |
| 600 Marcus St | 0.31mi | 3/1.5 (+1) | 1,232 (-11%) | 8mo | $137,500 | $112 | 53 |
| 153 Beechwood St | 0.60mi | 3/1.5 (+1) | 1,272 (-8%) | 2mo | $25,000 | $20 | 50 |
| 1520 Smithfield St | 0.35mi | 3/2.0 (+1) | 1,190 (-14%) | 7mo | $21,000 | $18 | 49 |
| 921 Orchard Grove Ave | 0.51mi | 3/1.0 (+1) | 1,588 (+15%) | 2mo | $72,000 | $45 | 42 |
| 401 Ray St | 0.64mi | 2/1.0 | 1,188 (-14%) | 12mo | $78,000 | $66 | 33 |
Match score weights: distance 35% · size 25% · config 20% · recency 20%. Top-matched comps best support the ARV.
Projected returns pro-forma
-3.0% appreciation · 3.0% rent growth · sell at horizon
- IRR
- 27.1%
- Equity multiple
- 2.13×
- Total profit
- $11,027
- Equity at exit
- $5,204
- IRR
- 34.7%
- Equity multiple
- 4.19×
- Total profit
- $31,216
- Equity at exit
- $3,018
Cash invested: $9,772 (down + closing). Projections, not guarantees.
Landlord ↔ Tenant lean methodology
- Overall (STATE)
- 73 Landlord-Friendly
- State Ohio
- 73 Landlord-Friendly · R+6
- County
- — inherits STATE
- City
- — inherits STATE
ZIP-level market 43920
- Home prices YoY
- -29.3%
- Active inventory
- 115
- Price-to-rent
- 4.1×
Monthly cashflow live
- Estimated rent
- $712 medium interval (Pro) →
- Mortgage (P&I)
- −$183
- Tax from tax record
- −$104 /mo · $1,250/yr
- Insurance
- −$15
- HOA
- −$0
- Vacancy / Maint / Mgmt
- −$150
- Net cashflow
- $261
Break-even live
Sensitivity live
| Price | -10% $281 | -5% $271 | +0% $261 | +5% $251 | +10% $241 |
|---|---|---|---|---|---|
| Rent | -10% $205 | -5% $233 | +0% $261 | +5% $289 | +10% $317 |
| Rate | -1.0pp $279 | -0.5pp $270 | base $261 | +0.5pp $252 | +1.0pp $243 |
UW: 25.0% down · 7.5% · 30yr · 1.5% tax · 5.0% vac · 8.0% maint · 8.0% mgmt
Financing live
Cash to close
- Down payment
- $8,725
- Closing costs
- $1,047
- Reserves months
- —
- Total cash needed
- —
Loan-product check · same deal, 3 products live
Conventional
25% down · 7.5% · 30yr
- Down + closing
- —
- Monthly P&I
- —
- Monthly cashflow
- —
- DSCR
- —
- Eligible?
- —
Personal DTI + credit; lowest rate.
DSCR
20% down · 8.5% · 30yr
- Down + closing
- —
- Monthly P&I
- —
- Monthly cashflow
- —
- DSCR
- —
- Eligible?
- —
No personal income docs; deal must DSCR.
Hard money
10% down · 12.0% · 12mo
- Down + closing
- —
- Monthly P&I
- —
- Monthly cashflow
- —
- DSCR
- —
- Eligible?
- —
Short-term bridge; refi at stabilization.
Rent comps 2 comps
| Address | Beds | Baths | Sqft | Rent | $/sqft | DOM | Units | Dist |
|---|---|---|---|---|---|---|---|---|
| 707 Saint Clair Ave Unit 06 East Liverpool, OH | 2.0 | 1.0 | 900 | $725 | $0.81 | 44d | 1 | 0.92mi |
| 707 Saint Clair Ave Unit 03 East Liverpool, OH | 2.0 | 1.0 | 900 | $700 | $0.78 | 44d | 1 | 0.92mi |
Listing history 9 events
-
2026-06-09status $34,900 Pending 18 DOM
-
2026-06-08days on market $34,900 Active 18 DOM
-
2026-06-07days on market $34,900 Active 17 DOM
-
2026-06-03days on market $34,900 Active 13 DOM
-
2026-06-02days on market $34,900 Active 12 DOM
-
2026-06-01days on market $34,900 Active 11 DOM
-
2026-05-31days on market $34,900 Active 10 DOM
-
2026-05-21$34,900 Active
-
1997-12-11soldstatus $48,900
ⓘ Source: listings_history table (triggers on properties + properties_extension) + one-shot
backfill from property_details.listing_events for pre-trigger history.
Tax reassessment forecast OH · Partial reset (capped growth)
- Current annual tax
- $1,250 · $104/mo
- Projected year-2 tax
- $1,250 · $104/mo
- Expected delta
- $0/yr ($0/mo · 0.0%)
ⓘ Screening estimate from a state-policy table — verify with the county assessor before closing.
Climate risk First Street
- Flood 1/10 Low FEMA zone X (unshaded) · 0% chance over 30 yrs
- Wildfire 1/10 Low
- Heat 3/10 Moderate 7 d/yr ≥97°F today · 16 d/yr by 30 yrs out
- Wind 1/10 Low
- Air quality 2/10 Low 1 unhealthy d/yr today · 2 by 30 yrs out
Nearby sold comps map
Loading sold comps map…
Walkable amenities ~0.75 mi
Loading nearby amenities…
Taxation est. · year 1
- Rental income
- $8,550
- − Mortgage interest
- −$1,955
- − Property taxes
- −$1,250
- − Insurance
- −$174
- − Repairs & maintenance
- −$684
- − Management
- −$684
- − Depreciation
- −$1,015
- Taxable income
- $2,788
- Est. tax owed @ 24.0%
- −$669
- After-tax cash flow
- $2,465/yr
For passive investors: Depreciation is non-cash, so a rental often shows a tax loss while cash-flowing — sheltering income. Rental losses are passive: they offset passive income freely, and up to $25,000/yr can offset ordinary (W-2) income if you actively participate and your MAGI is under $100k (phasing out to $0 by $150k); unused losses carry forward. On sale, claimed depreciation is recaptured at up to 25%, and gains may owe capital-gains tax (a 1031 exchange can defer both). Figures are a year-1 estimate at your 24.0% rate — not tax advice; consult a CPA.
Schools (NCES district)
- District
- East Liverpool City
- NCES district ID
- 3904391
- Math proficiency
- 28% ▼ -16.00%
- Reading proficiency
- 37% ▼ -10.00%
- Median HH income
- $34,021
- Composite
- 26.72/100
- National rank
- #7148
- State rank
- #571 of 656 in OH
Livability — East Liverpool
- Score
- 67/100
- State rank
- #613
- US rank
- #10580
Category grades
Schools grade is shown separately in the Schools card above.
Census & demographics
- Census place
- East Liverpool, OH
- County
- Columbiana · 99,532 people
- Population (ZIP)
- 21,124
- Household income
- $50,820
- Rent vs Own
- Severe rent burden
- 12.6
Population outlook (Columbiana County) Hauer SSP2
- Today (2025)
- 98,353 people
- By 2030
- 94,225 · -4.2%
- By 2040
- 85,169 · -13.4%
- By 2050
- 76,157 · -22.6%
- By 2075
- 58,451 · -40.6%
- By 2100
- 42,805 · -56.5%
Race, ethnicity, and origin ACS 2023
- Neighborhood character
- Predominantly White (90%)
- Race & ethnicity
- White 90% Two or more races 6% Black 3% Hispanic / Latino 1%
- Common ancestry
- Romanian 2% Slovak 2% Serbian 2%
- Foreign-born
- 0%
Political lean MEDSL · Columbiana
- 2024 margin
- Solid R (+49.0) · D 25.1% · R 74.1%
- 2008→2024 swing
- -41.4pp toward R · 2008: -7.6pp · 2024: -49.0pp
- All cycles
- 2024: R+49.0 2020: R+44.9 2016: R+41.6 2012: R+12.0 2008: R+7.6
Not yet ingested
- Civics
- —
Market trends
- HPI YoY
- ▼ -81.53%
- Current HPI
- 196.3908
- Rent YoY
- —
- Metro
- —
- State GDP YoY
- ▲ 1.98%
- F500 in state
- 48
Industry mix (Fortune 500 HQ in OH)
| Industry | F500 HQs | Revenue |
|---|---|---|
| Insurance | 3 | $145B |
|
||
| Industrial Machinery | 3 | $49B |
|
||
| Financial Services | 3 | $24B |
|
||
| Consumer Goods | 2 | $93B |
|
||
| Aerospace / Defense | 2 | $47B |
|
||
| Utilities | 2 | $33B |
|
||
Price history
-28.6% since first listed2 events — show timeline
- 2026-05-21 Listed $34,900 MLSNOW
- 1997-12-11 Sold (Public Records) $48,900 Public Records
Property tax history
+9.0%/yrLatest (2025): $1,250 · -9.1% YoY. Source: county tax records.
Cash-flow waterfall
monthlySold comps — $/sqft
last 12 mo · ≤1 miLoading sold comps…