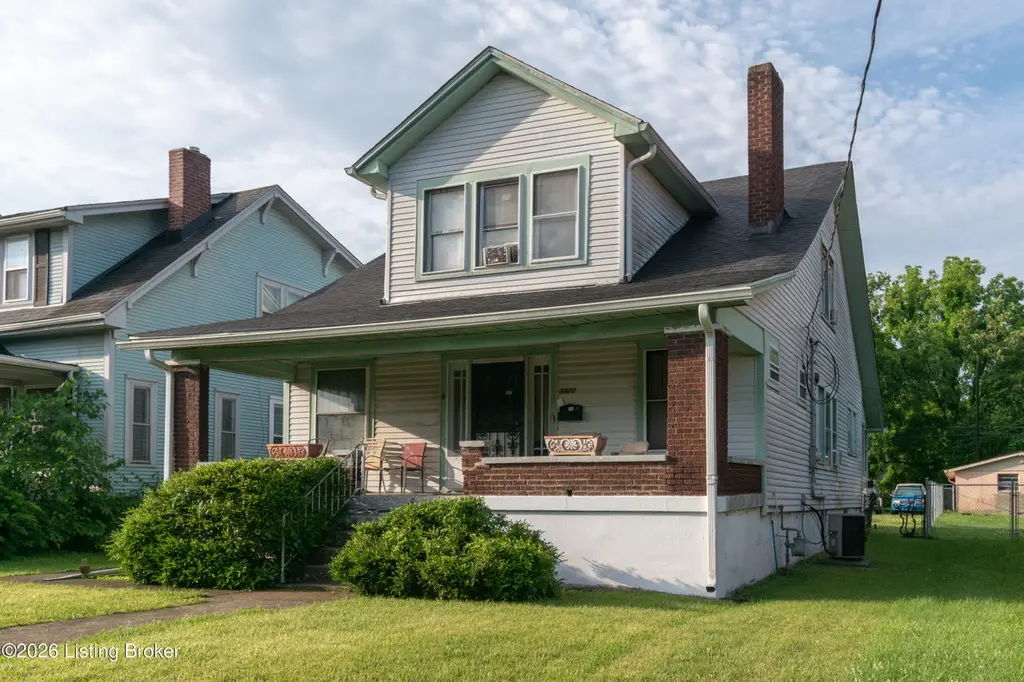
3422 River Park Dr · Louisville, KY
Flood risk 1/10 · Minimal
- FEMA flood zone
- X (shaded)
- Chance of flooding over 30 yrs
- 0.0%
- Est. flood insurance / yr
- $473 – $860
Fire risk 1/10 · Minimal
- Est. fire insurance / yr
- $839 – $1,559
Heat risk 5/10 · Moderate
- Hot days now (above 104°F)
- 7 days/yr
- Hot days in 30 yrs
- 20 days/yr
Wind risk 2/10 · Minimal
- Chance of severe wind over 30 yrs
- 1.0%
Air-quality risk 2/10 · Minimal
- Unhealthy air days now
- 1 days/yr
- Unhealthy air days in 30 yrs
- 2 days/yr
Risk factors via First Street. Map © Google.
Why this score? — see what drove the D grade
The composite is a weighted blend of 9 inputs, each scored 0–100. Each bar is that input's sub-score; the figure is the points it added to the 100-point composite (weight × sub-score).
- Cash flow +16.1/30.0
- DSCR +5.0/10.0
- ARV discount +4.8/15.0
- Rent growth +3.7/5.0
- 1% rule +3.5/10.0
- Livability +3.2/5.0
- Condition / age +2.5/5.0
- Schools +2.3/10.0
- Appreciation +0.0/10.0
$170,000
🖨 Deal sheet (PDF) 📄 Offer letter ✓ Due diligence
Listing remarks
48-hr notice to show required due to tenants. Excellent income-producing opportunity featuring a 4-bedroom, 2-bath home. The single-family property includes a newer 4-year old roof and a recently remodeled main-level full bathroom, while the second full bath is located upstairs. Situated in a growing area with strong upside potential for increased rents and long-term appreciation, this package offers investors the opportunity to expand their portfolio with multiple units in one purchase. Convenient access to everyday amenities adds to the appeal for current and future tenants.
Key facts
- Multiple units
- Newer roof
- 8,002 sq ft lot
Tags
Property features AI
Finance
- Other: Subdivision: PUSEY ADDN
- HOA & community: No association fee
Exterior
- Parking: Driveway
- Utilities: Electricity connected
- Home design: Single-family residence; Cape Cod style; 2 stories; Built in 1923; Facing direction not specified
- Construction: Wood frame construction; Shingle roof; Poured concrete foundation
- Exterior features: No notable exterior features listed; Sidewalk; Level lot
Interior
- Kitchen: Kitchen on the first floor
- Bedrooms: 4 bedrooms total; 2 bedrooms on the first floor; 2 bedrooms on the second floor
- Bathrooms: 2 full bathrooms
- Heating & cooling: Natural gas heating; Central air conditioning; 1 HVAC unit
- Interior features: 6 total rooms; 5 closets; Unfinished basement; Basement present
- Laundry & utility: No first-floor laundry
Neighborhood map
What this means for you Summary
Snapshot
- This is a 4-bed/2.0-bath single-family listed at $170k.
Deal economics
- At list price, monthly cash flow is $87 ($1k/yr) — positive.
- The deal already cash-flows at list — no discount required.
- To meet the 1% rule (rent ≥ 1% of price), the offer needs to be $145k (14.7% below list).
- Recommended offer: $145k (14.7% below list) — sets the bar for 1% rule.
- Cap rate 6.9% vs local median 5.0% in Louisville — top-decile yield for the area; either an underpriced asset or a hidden risk that comps aren't pricing in. Stress-test before assuming the spread holds.
Location & tenants
- Location reads 63/100 on livability (#333 in KY) — a middle-class / working-renter tenant base. Strengths: cost of living A+, housing A+; Watch: employment C-, health & safety D+, crime F.
- Jefferson County (urban): math 19% / reading 35% proficiency, ranked #121 of 165 in KY (top 73%) — low school quality limits family demand, transient renter base, plan for 1-2y turnover.
- Zoned schools: Foster Traditional Academy (math 2% / reading 12%, grade F, #662 of 676 statewide, top 99%, 578 students, 84% FRL); Robert Frost Sixth-Grade Academy (math 3% / reading 14%); Waggener High (math 8% / reading 27%, grade F, #221 of 254 statewide, top 87%, 863 students, 66% FRL) — zoned schools average 75% FRL vs 56% district-wide (19 pts higher); higher-poverty schools than district average — tighter screening recommended.
- Zoned-school proficiency averages 11% at this address vs 27% district-wide (-16 pts) — the specific schools serving this property underperform the Jefferson County average; the district grade overstates school quality for this exact location.
- Market conditions: Rents rising fast (+4.9%/yr); 144 active listings in the ZIP; 40 comparable units currently listed for rent nearby; rentals at typical pace (median 22d on market — plan ~3-4 weeks tenant-placement turnaround); lower-income renter base — watch delinquency; 2,836 units permitted in Jefferson County in 2024 (1,558 in 5+ unit buildings).
- At $1,450/mo this rent would consume 55% of the median local household income ($32k/yr) (locally 1483% of renters already pay >50% of income on rent) — very limited rent-growth headroom before tenants either downsize or default.
Forward outlook
- Local home prices are declining (-3.0%/yr); year-one equity from $1k of loan paydown is wiped out by about $5k of value loss. Plan a longer hold.
- Jefferson County population projected at +13% by 2050 — modest demand growth; plan on rents tracking national, not racing it.
Negotiation context
- It's been on market 29 days — a 2% lower offer ($167k) is reasonable based on typical stale-listing flexibility.
- 3 sale attempts since 19y ago with the ask held roughly flat each time — persistent listings suggest the price (not the market) is what's stuck; bring a comps-based counter.
Risks & watch-outs
- Watch-outs: built in 1923 — expect roof / HVAC / electrical / plumbing capex.
- Climate carrying-cost: extreme-heat days projected 7→20/yr by 2055 (HVAC capex compounding) — expect insurance premiums to compound above CPI over the hold.
Questions for the listing agent
- Built in 1923 — when were the roof, HVAC, electrical panel, plumbing, and water heater last replaced?
- Is there a deadline driving the sale (1031 exchange, divorce, estate, relocation)? That informs how much negotiation room exists.
- Schools are D-rated, which usually means shorter tenancies and higher turnover. Who's the typical renter profile here, and what's been the actual vacancy rate?
- Crime grade is F in this area — have there been break-ins, vandalism, or insurance claims at this property in the last 3 years? What carrier currently insures it and at what premium?
- The area grade is low — what's the realistic commute time and amenity access for the typical tenant pool here? Any planned neighborhood developments (good or bad) we should know about?
- What's the average days-on-market for RENTAL listings here right now (not sales)? A rising rental-DOM trend means longer vacancies and softer asking-rent achievability than the comps imply.
- What's the recent tenant-quality profile in this submarket — average credit score on applications, eviction rate, late-payment / NSF rate, and stable-employment percentage? A property-management company in the area should have these aggregated.
- How much new for-sale + rental construction is in the pipeline within 1–3 miles? Heavy new supply typically softens prices + rents 12–24 months out; constrained supply supports both.
Investment metrics
- 1% rule
- 0.85% ✗
- Cap rate
- 6.91%
- Cash-on-cash
- 2.19%
- DSCR
- 1.10
- GRM
- 9.8
CMA / ARV
- ARV (on-the-fly)
- $160,425
- Comps found
- 12
Show comp detail 12 sales within ~0.75 mi
| Address | Dist | Beds/Ba | Sqft | Sold | Price | $/sf | Match |
|---|---|---|---|---|---|---|---|
| 718 S 36th St | 0.39mi | 4/2.0 | 1,836 (+6%) | 7mo | $175,000 | $95 | 66 |
| 233 S 41st St | 0.65mi | 4/2.0 | 1,765 (+2%) | 2mo | $110,000 | $62 | 64 |
| 714 Dearborn Ave | 0.45mi | 3/2.0 (-1) | 1,631 (-5%) | 1mo | $110,000 | $67 | 64 |
| 624 S 39th St | 0.42mi | 4/2.5 | 1,596 (-8%) | 5mo | $180,000 | $113 | 62 |
| 633 S 36th St | 0.15mi | 4/1.5 | 1,478 (-14%) | 7mo | $150,000 | $101 | 61 |
| 309 S 41st St | 0.61mi | 3/2.0 (-1) | 1,675 (-3%) | 2mo | $102,000 | $61 | 60 |
| 636 S 40th St | 0.52mi | 3/1.0 (-1) | 1,735 (+1%) | 7mo | $140,000 | $81 | 59 |
| 634 S 38th St | 0.34mi | 4/2.0 | 1,500 (-13%) | 5mo | $165,000 | $110 | 58 |
| 816 Dearborn Ave | 0.58mi | 3/2.0 (-1) | 1,628 (-6%) | 2mo | $63,500 | $39 | 57 |
| 824 S 36th St | 0.52mi | 4/2.0 | 1,568 (-9%) | 5mo | $120,000 | $77 | 56 |
| 626 S 39th St | 0.42mi | 5/2.0 (+1) | 1,935 (+12%) | 7mo | $179,500 | $93 | 49 |
| 622 Cecil Ave | 0.66mi | 5/2.0 (+1) | 1,868 (+8%) | 8mo | $175,000 | $94 | 44 |
Match score weights: distance 35% · size 25% · config 20% · recency 20%. Top-matched comps best support the ARV.
Projected returns pro-forma
-3.0% appreciation · 4.87% rent growth · sell at horizon
- IRR
- -11.0%
- Equity multiple
- 0.59×
- Total profit
- $-19,287
- Equity at exit
- $25,348
- IRR
- 0.6%
- Equity multiple
- 1.04×
- Total profit
- $1,974
- Equity at exit
- $14,698
Cash invested: $47,600 (down + closing). Projections, not guarantees.
Landlord ↔ Tenant lean methodology
- Overall (STATE)
- 83 Strongly Landlord-Friendly
- State Kentucky
- 83 Strongly Landlord-Friendly · R+16
- County
- — inherits STATE
- City
- — inherits STATE
ZIP-level market 40211
- Home prices YoY
- -33.4%
- Rents YoY
- 4.9%
- Active inventory
- 144
- Price-to-rent
- 9.8×
Monthly cashflow live
- Estimated rent
- $1,450 high interval (Pro) →
- Mortgage (P&I)
- −$891
- Tax from tax record
- −$96 /mo · $1,155/yr
- Insurance
- −$71
- HOA
- −$0
- Vacancy / Maint / Mgmt
- −$304
- Net cashflow
- $87
Break-even live
Sensitivity live
| Price | -10% $183 | -5% $135 | +0% $87 | +5% $39 | +10% $-9 |
|---|---|---|---|---|---|
| Rent | -10% $-28 | -5% $30 | +0% $87 | +5% $144 | +10% $201 |
| Rate | -1.0pp $172 | -0.5pp $130 | base $87 | +0.5pp $43 | +1.0pp $-2 |
UW: 25.0% down · 7.5% · 30yr · 1.5% tax · 5.0% vac · 8.0% maint · 8.0% mgmt
Financing live
Cash to close
- Down payment
- $42,500
- Closing costs
- $5,100
- Reserves months
- —
- Total cash needed
- —
Loan-product check · same deal, 3 products live
Conventional
25% down · 7.5% · 30yr
- Down + closing
- —
- Monthly P&I
- —
- Monthly cashflow
- —
- DSCR
- —
- Eligible?
- —
Personal DTI + credit; lowest rate.
DSCR
20% down · 8.5% · 30yr
- Down + closing
- —
- Monthly P&I
- —
- Monthly cashflow
- —
- DSCR
- —
- Eligible?
- —
No personal income docs; deal must DSCR.
Hard money
10% down · 12.0% · 12mo
- Down + closing
- —
- Monthly P&I
- —
- Monthly cashflow
- —
- DSCR
- —
- Eligible?
- —
Short-term bridge; refi at stabilization.
Rent comps 40 comps
| Address | Beds | Baths | Sqft | Rent | $/sqft | DOM | Units | Dist |
|---|---|---|---|---|---|---|---|---|
| 652 S 37th St #9 Louisville, KY | 3.0 | 1.0 | 1070 | $1,095 | $1.02 | 25d | 1 | 0.29mi |
| 627 S 38th St Louisville, KY | 4.0 | 1.0 | 1300 | $1,349 | $1.04 | 18d | 1 | 0.30mi |
| 3819 River Park Dr Louisville, KY | 3.0 | 1.0 | 1108 | $1,090 | $0.98 | 22d | 1 | 0.35mi |
| 737 S 33rd St Louisville, KY | 4.0 | 1.0 | 1356 | $1,595 | $1.18 | 25d | 1 | 0.40mi |
| 628 S 39th St Louisville, KY | 3.0 | 1.0 | 1448 | $1,220 | $0.84 | 18d | 1 | 0.40mi |
| 803 S 35th St Louisville, KY | 3.0 | 1.0 | 1486 | $1,350 | $0.91 | 25d | 1 | 0.43mi |
| 814 S 33rd St Louisville, KY | 3.0 | 1.0 | 1104 | $1,350 | $1.22 | 5d | 1 | 0.47mi |
| 3909 W Broadway Louisville, KY | 5.0 | 2.0 | 2000 | $1,745 | $0.87 | 18d | 1 | 0.51mi |
| 820 Hazel St Louisville, KY | 4.0 | 2.0 | 1872 | $1,395 | $0.75 | 5d | 1 | 0.56mi |
| 823 S 38th St Louisville, KY | 3.0 | 1.0 | 1100 | $1,195 | $1.09 | 5d | 1 | 0.58mi |
| 722 S 40th St Unit NA Louisville, KY | 4.0 | 2.5 | 1556 | $1,700 | $1.09 | 5d | 1 | 0.60mi |
| 4129 W Muhammad Ali Blvd Louisville, KY | 4.0 | 2.0 | 1224 | $1,500 | $1.23 | 3d | 1 | 0.68mi |
| 247 Cecil Ave Louisville, KY | 3.0 | 2.0 | 1083 | $1,305 | $1.20 | 21d | 1 | 0.70mi |
| 803 Cecil Ave Louisville, KY | 4.0 | 1.0 | 1165 | $1,449 | $1.24 | 12d | 1 | 0.75mi |
| 836 S 41st St Louisville, KY | 3.0 | 1.0 | 1300 | $1,300 | $1.00 | 21d | 1 | 0.76mi |
| 714 S 42nd St Louisville, KY | 3.0 | 1.0 | 1078 | $1,150 | $1.07 | 18d | 1 | 0.79mi |
| 106 N 40th St Louisville, KY | 3.0 | 1.0 | 1325 | $1,220 | $0.92 | 5d | 1 | 0.80mi |
| 127 N 40th St Louisville, KY | 3.0 | 2.0 | 1500 | $1,570 | $1.05 | 5d | 1 | 0.83mi |
| 3514 Grand Ave Louisville, KY | 3.0 | 1.5 | 1450 | $1,295 | $0.89 | 23d | 1 | 0.87mi |
| 2912 Greenwood Ave Louisville, KY | 3.0 | 2.0 | 1362 | $1,150 | $0.84 | 18d | 1 | 0.90mi |
| 2825 Greenwood Ave #4 Louisville, KY | 3.0 | 1.0 | 1440 | $1,250 | $0.87 | 25d | 1 | 0.91mi |
| 2821 Greenwood Ave #1 Louisville, KY | 3.0 | 1.0 | 1113 | $1,300 | $1.17 | 25d | 1 | 0.91mi |
| 2634 Garland Ave Unit B Louisville, KY | 3.0 | 1.0 | 1152 | $895 | $0.78 | 22d | 1 | 0.92mi |
| 2634 Garland Ave Unit A Louisville, KY | 3.0 | 1.0 | 1152 | $940 | $0.82 | 25d | 1 | 0.92mi |
| 1115 S 32nd St Louisville, KY | 3.0 | 1.0 | 1393 | $1,275 | $0.92 | 23d | 1 | 0.93mi |
| 1115 S 32nd St Louisville, KY | 3.0 | 1.0 | 1393 | $1,275 | $0.92 | 25d | 1 | 0.93mi |
| 2711 W Kentucky St Louisville, KY | 3.0 | 1.0 | 1155 | $1,100 | $0.95 | 25d | 1 | 0.93mi |
| 430 S 24th St Louisville, KY | 3.0 | 1.5 | 1288 | $1,400 | $1.09 | 25d | 1 | 0.95mi |
| 3901 Jewell Ave Louisville, KY | 3.0 | 1.0 | 1069 | $1,140 | $1.07 | 22d | 1 | 0.98mi |
| 2529 W Main St #2 Louisville, KY | 3.0 | 1.0 | 1404 | $1,200 | $0.85 | 25d | 1 | 1.01mi |
| 2708 Greenwood Ave Apt 1 Louisville, KY | 3.0 | 1.0 | 1100 | $1,300 | $1.18 | 25d | 1 | 1.02mi |
| 2508 W Main St Louisville, KY | 3.0 | 1.0 | 1327 | $1,500 | $1.13 | 25d | 1 | 1.03mi |
| 205 N 26th St Louisville, KY | 5.0 | 2.0 | 1538 | $1,700 | $1.11 | 25d | 1 | 1.03mi |
| 2319 W Muhammad Ali Blvd Louisville, KY | 4.0 | 1.0 | 1644 | $1,300 | $0.79 | 18d | 1 | 1.03mi |
| 2416 Garland Ave Louisville, KY | 3.0 | 2.0 | 1172 | $1,600 | $1.37 | 25d | 1 | 1.08mi |
| 212 N 25th St Louisville, KY | 3.0 | 1.0 | 1104 | $895 | $0.81 | 25d | 1 | 1.13mi |
| 4221 Sunset Ave Louisville, KY | 3.0 | 1.0 | 1075 | $1,199 | $1.12 | 25d | 1 | 1.14mi |
| 4220 Sunset Ave Louisville, KY | 5.0 | 1.5 | 1464 | $1,950 | $1.33 | 3d | 1 | 1.15mi |
| 848 S 23rd St Louisville, KY | 3.0 | 1.5 | 1050 | $1,450 | $1.38 | 25d | 1 | 1.17mi |
| 858 S 23rd St Louisville, KY | 5.0 | 1.0 | 2228 | $2,100 | $0.94 | 19d | 1 | 1.18mi |
Listing history 20 events
-
2026-06-21days on market $170,000 Active 29 DOM
-
2026-06-18days on market $170,000 Active 26 DOM
-
2026-06-17days on market $170,000 Active 25 DOM
-
2026-06-16remarks 583-char remark
-
2026-06-16days on market $170,000 Active 24 DOM
-
2026-06-15days on market $170,000 Active 23 DOM
-
2026-06-13days on market $170,000 Active 21 DOM
-
2026-06-10days on market $170,000 Active 18 DOM
-
2026-06-09days on market $170,000 Active 17 DOM
-
2026-06-08days on market $170,000 Active 16 DOM
-
2026-06-07days on market $170,000 Active 15 DOM
-
2026-06-03days on market $170,000 Active 11 DOM
-
2026-06-02days on market $170,000 Active 10 DOM
-
2026-06-01days on market $170,000 Active 9 DOM
-
2026-05-31days on market $170,000 Active 8 DOM
-
2026-05-23$170,000 Active
-
2008-01-02historical
-
2007-12-02historical
-
2007-12-02$24,990
-
2007-02-09$27,600
ⓘ Source: listings_history table (triggers on properties + properties_extension) + one-shot
backfill from property_details.listing_events for pre-trigger history.
Tax reassessment forecast KY · Resets to sale price
- Current annual tax
- $1,155 · $96/mo
- Projected year-2 tax
- $1,462 · $122/mo
- Expected delta
- +$307/yr (+$26/mo · 26.6%)
ⓘ Screening estimate from a state-policy table — verify with the county assessor before closing.
Climate risk First Street
- Flood 1/10 Low FEMA zone X (shaded) · 0% chance over 30 yrs
- Wildfire 1/10 Low
- Heat 5/10 Major 7 d/yr ≥104°F today · 20 d/yr by 30 yrs out
- Wind 2/10 Low 100% chance of damaging wind over 30 yrs
- Air quality 2/10 Low 1 unhealthy d/yr today · 2 by 30 yrs out
Nearby sold comps map
Loading sold comps map…
Walkable amenities ~0.75 mi
Loading nearby amenities…
Taxation est. · year 1
- Rental income
- $17,399
- − Mortgage interest
- −$9,523
- − Property taxes
- −$1,155
- − Insurance
- −$850
- − Repairs & maintenance
- −$1,392
- − Management
- −$1,392
- − Depreciation
- −$4,945
- Taxable loss
- −$1,858
- Est. tax savings @ 24.0%
- +$446
- After-tax cash flow
- $1,488/yr
For passive investors: Depreciation is non-cash, so a rental often shows a tax loss while cash-flowing — sheltering income. Rental losses are passive: they offset passive income freely, and up to $25,000/yr can offset ordinary (W-2) income if you actively participate and your MAGI is under $100k (phasing out to $0 by $150k); unused losses carry forward. On sale, claimed depreciation is recaptured at up to 25%, and gains may owe capital-gains tax (a 1031 exchange can defer both). Figures are a year-1 estimate at your 24.0% rate — not tax advice; consult a CPA.
Schools (NCES district)
- District
- Jefferson County
- NCES district ID
- 2102990
- Math proficiency
- 19% ▼ -17.00%
- Reading proficiency
- 35% ▼ -11.00%
- Median HH income
- $47,885
- Composite
- 23.45/100
- National rank
- #7884
- State rank
- #121 of 165 in KY
Livability — Louisville
- Score
- 63/100
- State rank
- #333
- US rank
- #15887
Category grades
Schools grade is shown separately in the Schools card above.
Census & demographics
- Census place
- Louisville, KY
- County
- Jefferson County · 790,184 people
- City population
- 769,292
- Metro
- Louisville/Jefferson County, KY-IN
- Population (ZIP)
- 20,407
- Household income
- $31,749
- Rent vs Own
- Severe rent burden
- 1483.0
Population outlook (Jefferson County) Hauer SSP2
- Today (2025)
- 823,112 people
- By 2030
- 849,343 · +3.2%
- By 2040
- 895,696 · +8.8%
- By 2050
- 933,630 · +13.4%
- By 2075
- 1,028,262 · +24.9%
- By 2100
- 1,072,675 · +30.3%
Race, ethnicity, and origin ACS 2023
- Neighborhood character
- Predominantly Black (90%)
- Race & ethnicity
- Black 90% White 5% Two or more races 4% Hispanic / Latino 1%
- Common ancestry
- Italian 1%
- Foreign-born
- 1% · Canada
- Languages at home
- 98% English-only · Spanish 1%
Political lean MEDSL · Jefferson
- 2024 margin
- D (+16.6) · D 57.4% · R 40.9% · Other 1.7%
- 2008→2024 swing
- +4.5pp toward D · 2008: 12.0pp · 2024: 16.6pp
- All cycles
- 2024: D+16.6 2020: D+20.1 2016: D+13.3 2012: D+11.1 2008: D+12.0
Not yet ingested
- Civics
- —
Market trends
- HPI YoY
- ▼ -88.22%
- Current HPI
- 176.337
- Rent YoY
- ▲ 4.87%
- Metro
- Louisville/Jefferson County, KY-IN
- State GDP YoY
- ▲ 1.81%
- F500 in state
- 4
Industry mix (Fortune 500 HQ in KY)
| Industry | F500 HQs | Revenue |
|---|---|---|
| Healthcare | 1 | $118B |
|
||
| Food / Beverage | 1 | $7B |
|
||
Price history
+515.9% since first listed5 events — show timeline
- 2026-05-23 Listed $170,000 Metro Search MLS
- 2008-01-02 Listing Removed — Metro Search MLS
- 2007-12-02 Listed $24,990 Metro Search MLS
- 2007-12-02 Listing Removed — Metro Search MLS
- 2007-02-09 Listed $27,600 Metro Search MLS
Property tax history
+7.3%/yrLatest (2025): $1,155 · -1.9% YoY. Source: county tax records.
Cash-flow waterfall
monthlySold comps — $/sqft
last 12 mo · ≤1 miLoading sold comps…