919 E 9th St · Hopkinsville, KY
Flood risk 1/10 · Minimal
- FEMA flood zone
- X (unshaded)
- Chance of flooding over 30 yrs
- 0.0%
- Est. flood insurance / yr
- $507 – $1,088
Fire risk 1/10 · Minimal
- Est. fire insurance / yr
- $839 – $1,559
Heat risk 5/10 · Moderate
- Hot days now (above 108°F)
- 7 days/yr
- Hot days in 30 yrs
- 20 days/yr
Wind risk 3/10 · Minor
- Chance of severe wind over 30 yrs
- 8.0%
Air-quality risk 2/10 · Minimal
- Unhealthy air days now
- 0 days/yr
- Unhealthy air days in 30 yrs
- 1 days/yr
Risk factors via First Street. Map © Google.
Why this score? — see what drove the B grade
The composite is a weighted blend of 9 inputs, each scored 0–100. Each bar is that input's sub-score; the figure is the points it added to the 100-point composite (weight × sub-score).
- Cash flow +27.9/30.0
- ARV discount +15.0/15.0
- DSCR +9.9/10.0
- 1% rule +7.7/10.0
- Rent growth +4.2/5.0
- Livability +3.2/5.0
- Schools +2.7/10.0
- Condition / age +2.5/5.0
- Appreciation +0.0/10.0
$109,900
🖨 Deal sheet 📄 Offer letter ✓ Due diligence
Listing remarks MLS
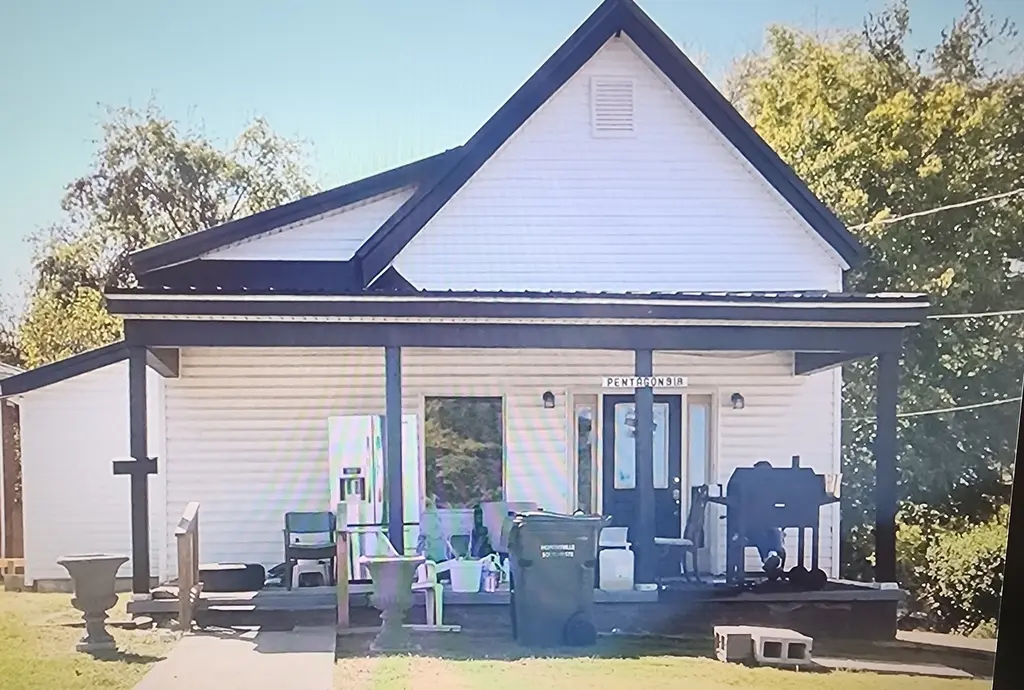
WELCOME TO 919 E NINTH ST! THIS HOME WAS NICKNAMED THE PENTAGON BY THE OWNER! THIS PROPERTY WAS REMODELED WITH NEW VINYL SIDING, WINDOWS, FLOORING, PAINT, HVAC, ELECTRICAL, LIGHT FIXTURES, ETC! TO TOP IT OFF, IT IS ZONED B-2 COMMERCIAL! IT WILL BE CLEANED OUT OF THE CONTENTS BEFORE CLOSING! CLOSE TO FT. CAMPBELL, NASHVILLE, SHOPPING ETC! YOU CAN'T BEAT THIS PRICE!
Key facts
- Close to nashville
- Zoned b-2 commercial
- New vinyl siding
Tags
Neighborhood map
What this means for you Summary
Snapshot
- This is a 3-bed/1.0-bath single-family listed at $110k.
Deal economics
- At list price, monthly cash flow is $339 ($4k/yr) — positive.
- The deal already cash-flows at list — no discount required.
- Meets the 1% rule at list price ($1k rent vs $110k).
- Recommended offer: $100k (9.0% below list) — sets the bar for market timing.
- Cap rate 10.0% vs local median 4.3% in Hopkinsville — top-decile yield for the area; either an underpriced asset or a hidden risk that comps aren't pricing in. Stress-test before assuming the spread holds.
Location & tenants
- Location reads 64/100 on livability (#305 in KY) — a middle-class / working-renter tenant base. Strengths: cost of living A+, housing A, health & safety B+; Watch: schools D+, crime F, amenities F.
- Christian County (town): math 30% / reading 34% proficiency, ranked #93 of 165 in KY (top 56%) — families likely to look elsewhere, expect single-tenant / working-renter base with shorter leases; 61% free/reduced lunch — lower-income household profile, screen leases tightly.
- Market conditions: Rents rising fast (+6.6%/yr); 252 active listings in the ZIP; 5 comparable units currently listed for rent nearby; rentals at typical pace (median 22d on market — plan ~3-4 weeks tenant-placement turnaround); 40% of comp listings sitting > 30 days — soft ceiling on asking rent; 193 units permitted in Christian County in 2024 (66 in 5+ unit buildings).
- This rent runs 32% of the median local income ($52k/yr) — at the standard rent-burdened threshold; future hikes will face affordability resistance.
Forward outlook
- Local home prices are declining (-3.0%/yr); year-one equity from $760 of loan paydown is wiped out by about $3k of value loss. Plan a longer hold.
- Christian County population projected at -20% by 2050 — secular population decline; favor cash flow + early exit over multi-decade hold.
- At projected returns (-3.0% appreciation + 6.6% rent growth), your $31k cash investment doubles in ~7 years — after that, you're playing with house money.
Negotiation context
- It's been on market 107 days — a 9% lower offer ($100k) is reasonable based on typical stale-listing flexibility.
- 5 sale attempts since 14y ago with the ask held roughly flat each time — persistent listings suggest the price (not the market) is what's stuck; bring a comps-based counter.
- Current owner paid $6k; list at $110k implies a 1732% gain — meaningful room to come down on a strong offer.
Risks & watch-outs
- Climate carrying-cost: extreme-heat days projected 7→20/yr by 2055 (HVAC capex compounding) — expect insurance premiums to compound above CPI over the hold.
Questions for the listing agent
- It's been on market 107 days. Have you received any prior offers? Is the seller open to a 9% concession, seller financing, or rate buy-down credit?
- Built in 1960 — when were the roof, HVAC, electrical panel, plumbing, and water heater last replaced?
- Why hasn't it sold? Are there any deal-killer items the seller is aware of (foundation, flood, title, zoning, code violations)?
- Is there a deadline driving the sale (1031 exchange, divorce, estate, relocation)? That informs how much negotiation room exists.
- Schools are D-rated, which usually means shorter tenancies and higher turnover. Who's the typical renter profile here, and what's been the actual vacancy rate?
- Crime grade is F in this area — have there been break-ins, vandalism, or insurance claims at this property in the last 3 years? What carrier currently insures it and at what premium?
- What's the average days-on-market for RENTAL listings here right now (not sales)? A rising rental-DOM trend means longer vacancies and softer asking-rent achievability than the comps imply.
- What's the recent tenant-quality profile in this submarket — average credit score on applications, eviction rate, late-payment / NSF rate, and stable-employment percentage? A property-management company in the area should have these aggregated.
- How much new for-sale + rental construction is in the pipeline within 1–3 miles? Heavy new supply typically softens prices + rents 12–24 months out; constrained supply supports both.
Investment metrics
- 1% rule
- 1.27% ✓
- Cap rate
- 9.99%
- Cash-on-cash
- 13.22%
- DSCR
- 1.59
- GRM
- 6.6
CMA / ARV
- ARV (median comp)
- $140,108
- List price
- $109,900
- Delta
- -21.56%
- Verdict
- UNDERPRICED
- Comps
- 20 within 1.0 mi
Show comp detail 6 sales within ~0.75 mi
| Address | Dist | Beds/Ba | Sqft | Sold | Price | $/sf | Match |
|---|---|---|---|---|---|---|---|
| 1304 E 7th St | 0.43mi | 2/1.0 (-1) | 1,538 (-13%) | 3mo | $109,900 | $71 | 51 |
| 1907 Oak St | 0.55mi | 3/2.0 | 1,650 (-6%) | 11mo | $220,000 | $133 | 51 |
| 836 21st St E | 0.74mi | 4/2.0 (+1) | 1,850 (+5%) | 11mo | $259,900 | $140 | 39 |
| 1823 South Vriginia St | 0.69mi | 3/1.0 | 1,552 (-12%) | 13mo | $130,000 | $84 | 37 |
| 116 Liberty St | 0.53mi | 3/2.0 | 1,540 (-12%) | 21mo | $185,000 | $120 | 33 |
| 1813 Walnut St | 0.49mi | 3/2.0 | 2,001 (+14%) | 22mo | $16,000 | $8 | 32 |
Match score weights: distance 35% · size 25% · config 20% · recency 20%. Top-matched comps best support the ARV.
Projected returns pro-forma
-3.0% appreciation · 6.61% rent growth · sell at horizon
- IRR
- 7.2%
- Equity multiple
- 1.29×
- Total profit
- $9,040
- Equity at exit
- $16,386
- IRR
- 19.5%
- Equity multiple
- 2.91×
- Total profit
- $58,897
- Equity at exit
- $9,502
Cash invested: $30,772 (down + closing). Projections, not guarantees.
Landlord ↔ Tenant lean methodology
- Overall (STATE)
- 83 Strongly Landlord-Friendly
- State Kentucky
- 83 Strongly Landlord-Friendly · R+16
- County
- — inherits STATE
- City
- — inherits STATE
ZIP-level market 42240
- Home prices YoY
- -17.5%
- Rents YoY
- 6.6%
- Active inventory
- 252
- Price-to-rent
- 6.6×
Monthly cashflow live
- Estimated rent
- $1,391 high interval (Pro) →
- Mortgage (P&I)
- −$576
- Tax est. 1.5%
- −$137 /mo · $1,648/yr
- Insurance
- −$46
- HOA
- −$0
- Vacancy / Maint / Mgmt
- −$292
- Net cashflow
- $339
Break-even live
UW: 25.0% down · 7.5% · 30yr · 1.5% tax · 5.0% vac · 8.0% maint · 8.0% mgmt
Financing live
Cash to close
- Down payment
- $27,475
- Closing costs
- $3,297
- Reserves months
- —
- Total cash needed
- —
Loan-product check · same deal, 3 products live
Conventional
25% down · 7.5% · 30yr
- Down + closing
- —
- Monthly P&I
- —
- Monthly cashflow
- —
- DSCR
- —
- Eligible?
- —
Personal DTI + credit; lowest rate.
DSCR
20% down · 8.5% · 30yr
- Down + closing
- —
- Monthly P&I
- —
- Monthly cashflow
- —
- DSCR
- —
- Eligible?
- —
No personal income docs; deal must DSCR.
Hard money
10% down · 12.0% · 12mo
- Down + closing
- —
- Monthly P&I
- —
- Monthly cashflow
- —
- DSCR
- —
- Eligible?
- —
Short-term bridge; refi at stabilization.
Rent comps 5 comps
| Address | Beds | Baths | Sqft | Rent | $/sqft | DOM | Units | Dist |
|---|---|---|---|---|---|---|---|---|
| 1604 A E 9th St Hopkinsville, KY | 3.0 | 1.0 | 1782 | $1,250 | $0.70 | 44d | 1 | 0.77mi |
| 1523 Canton St Hopkinsville, KY | 3.0 | 2.0 | 1700 | $1,550 | $0.91 | 44d | 1 | 0.79mi |
| 1704 E 7th St Unit Na Hopkinsville, KY | 3.0 | 2.0 | 1321 | $1,550 | $1.17 | 14d | 1 | 0.91mi |
| 601 Moores Dr Hopkinsville, KY | 3.0 | 2.0 | 1498 | $1,400 | $0.93 | 21d | 1 | 1.08mi |
| 1050 Denzil Dr Hopkinsville, KY | 2.0 | 1.0–2.0 | 1105 | $1,138 | $1.03 | 14d | 21 | 1.18mi |
Listing history 21 events
-
2026-06-18days on market $109,900 Active 107 DOM
-
2026-06-17days on market $109,900 Active 106 DOM
-
2026-06-16days on market $109,900 Active 105 DOM
-
2026-06-15days on market $109,900 Active 104 DOM
-
2026-06-14days on market $109,900 Active 102 DOM
-
2026-06-13days on market $109,900 Active 101 DOM
-
2026-06-10days on market $109,900 Active 99 DOM
-
2026-06-09days on market $109,900 Active 98 DOM
-
2026-06-08days on market $109,900 Active 97 DOM
-
2026-06-07days on market $109,900 Active 96 DOM
-
2026-06-02days on market $109,900 Active 91 DOM
-
2026-06-01days on market $109,900 Active 90 DOM
-
2026-05-31days on market $109,900 Active 89 DOM
-
2026-05-30days on market $109,900 Active 88 DOM
-
2026-03-03$109,900 Active 366-char remark
Show marketing remark (366 chars)
WELCOME TO 919 E NINTH ST! THIS HOME WAS NICKNAMED THE PENTAGON BY THE OWNER! THIS PROPERTY WAS REMODELED WITH NEW VINYL SIDING, WINDOWS, FLOORING, PAINT, HVAC, ELECTRICAL, LIGHT FIXTURES, ETC! TO TOP IT OFF, IT IS ZONED B-2 COMMERCIAL! IT WILL BE CLEANED OUT OF THE CONTENTS BEFORE CLOSING! CLOSE TO FT. CAMPBELL, NASHVILLE, SHOPPING ETC! YOU CAN'T BEAT THIS PRICE!
-
2024-07-19historical
-
2024-04-11$174,900 Active
-
2024-04-11$174,900 Active
-
2012-09-17$15,000
-
2012-08-31soldstatus $6,000
ⓘ Source: listings_history table (triggers on properties + properties_extension) + one-shot
backfill from property_details.listing_events for pre-trigger history.
Climate risk First Street
- Flood 1/10 Low FEMA zone X (unshaded) · 0% chance over 30 yrs
- Wildfire 1/10 Low
- Heat 5/10 Major 7 d/yr ≥108°F today · 20 d/yr by 30 yrs out
- Wind 3/10 Moderate 8% chance of damaging wind over 30 yrs
- Air quality 2/10 Low 0 unhealthy d/yr today · 1 by 30 yrs out
Nearby sold comps map
Loading sold comps map…
Walkable amenities ~0.75 mi
Loading nearby amenities…
Taxation est. · year 1
- Rental income
- $16,687
- − Mortgage interest
- −$6,156
- − Property taxes
- −$1,648
- − Insurance
- −$550
- − Repairs & maintenance
- −$1,335
- − Management
- −$1,335
- − Depreciation
- −$3,197
- Taxable income
- $2,466
- Est. tax owed @ 24.0%
- −$592
- After-tax cash flow
- $3,477/yr
For passive investors: Depreciation is non-cash, so a rental often shows a tax loss while cash-flowing — sheltering income. Rental losses are passive: they offset passive income freely, and up to $25,000/yr can offset ordinary (W-2) income if you actively participate and your MAGI is under $100k (phasing out to $0 by $150k); unused losses carry forward. On sale, claimed depreciation is recaptured at up to 25%, and gains may owe capital-gains tax (a 1031 exchange can defer both). Figures are a year-1 estimate at your 24.0% rate — not tax advice; consult a CPA.
Schools (NCES district)
- District
- Christian County
- NCES district ID
- 2101150
- Math proficiency
- 30% ▼ -9.00%
- Reading proficiency
- 34% ▼ -10.00%
- Median HH income
- $38,961
- Composite
- 26.8/100
- National rank
- #7118
- State rank
- #93 of 165 in KY
Livability — Hopkinsville
- Score
- 64/100
- State rank
- #305
- US rank
- #14474
Category grades
Schools grade is shown separately in the Schools card above.
Census & demographics
- Census place
- Hopkinsville, KY
- County
- Christian County · 51,080 people
- City population
- 41,415
- Metro
- Clarksville, TN-KY
- Population (ZIP)
- 41,415
- Household income
- $51,534
- Rent vs Own
- Severe rent burden
- 1475.0
Population outlook (Christian County) Hauer SSP2
- Today (2025)
- 67,861 people
- By 2030
- 65,808 · -3.0%
- By 2040
- 60,090 · -11.5%
- By 2050
- 54,561 · -19.6%
- By 2075
- 45,859 · -32.4%
- By 2100
- 38,310 · -43.5%
Race, ethnicity, and origin ACS 2023
- Neighborhood character
- Majority White (65%)
- Race & ethnicity
- White 65% Black 23% Two or more races 7% Hispanic / Latino 4%
- Common ancestry
- Slovak 3% Italian 1% Romanian 1%
- Foreign-born
- 3% · Canada
- Languages at home
- 95% English-only · Spanish 3% German/W. Germanic 1%
Political lean MEDSL · Christian
- 2024 margin
- Solid R (+33.6) · D 32.6% · R 66.1% · Other 1.3%
- 2008→2024 swing
- -12.4pp toward R · 2008: -21.2pp · 2024: -33.6pp
- All cycles
- 2024: R+33.6 2020: R+28.4 2016: R+31.4 2012: R+23.8 2008: R+21.2
Not yet ingested
- Civics
- —
Market trends
- HPI YoY
- ▼ -49.36%
- Current HPI
- 233.3958
- Rent YoY
- ▲ 6.61%
- Metro
- Clarksville, TN-KY
- State GDP YoY
- ▲ 1.81%
- F500 in state
- 4
Industry mix (Fortune 500 HQ in KY)
| Industry | F500 HQs | Revenue |
|---|---|---|
| Healthcare | 1 | $118B |
|
||
| Food / Beverage | 1 | $7B |
|
||
Price history
+1731.7% since first listed7 events — show timeline
- 2026-03-03 Listed $109,900 REALTRACS as Distributed by MLS Grid
- 2026-03-03 Listed $109,900 HCTCBOR
- 2024-07-19 Listing Removed — REALTRACS as Distributed by MLS Grid
- 2024-04-11 Listed $174,900 HCTCBOR
- 2024-04-11 Listed $174,900 REALTRACS as Distributed by MLS Grid
- 2012-09-17 Listed $15,000 HCTCBOR
- 2012-08-31 Sold (MLS) $6,000 HCTCBOR
Property tax history
+15.4%/yrLatest (2025): $217 · -4.4% YoY. Source: county tax records.
Cash-flow waterfall
monthlySold comps — $/sqft
last 12 mo · ≤1 miLoading sold comps…