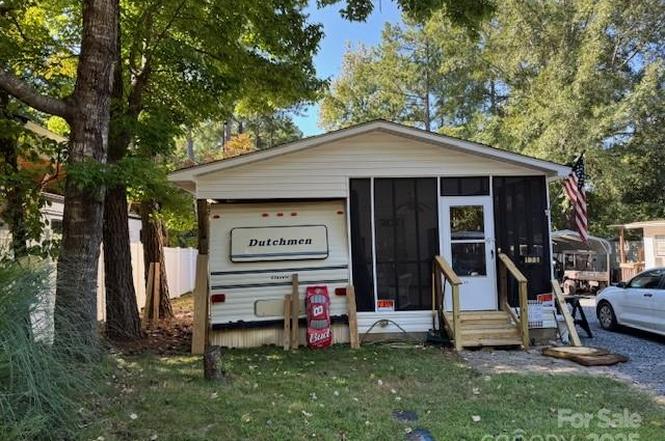
175 Roberts Ridge Rd · Norwood, NC
Flood risk 1/10 · Minimal
- FEMA flood zone
- X (unshaded)
- Chance of flooding over 30 yrs
- 0.0%
- Est. flood insurance / yr
- $473 – $860
Fire risk 3/10 · Minor
- Est. fire insurance / yr
- $906 – $1,684
Heat risk 6/10 · Moderate
- Hot days now (above 108°F)
- 7 days/yr
- Hot days in 30 yrs
- 16 days/yr
Wind risk 6/10 · Moderate
- Chance of severe wind over 30 yrs
- 27.0%
Air-quality risk 2/10 · Minimal
- Unhealthy air days now
- 2 days/yr
- Unhealthy air days in 30 yrs
- 2 days/yr
Risk factors via First Street. Map © Google.
Why this score? — see what drove the B grade
The composite is a weighted blend of 9 inputs, each scored 0–100. Each bar is that input's sub-score; the figure is the points it added to the 100-point composite (weight × sub-score).
- Cash flow +30.0/30.0
- DSCR +10.0/10.0
- 1% rule +7.9/10.0
- ARV discount +7.5/15.0
- Appreciation +4.5/10.0
- Livability +3.2/5.0
- Schools +2.6/10.0
- Rent growth +2.5/5.0
- Condition / age +2.5/5.0
$100,000
🖨 Deal sheet 📄 Offer letter ✓ Due diligence
Listing remarks
New Listing 2 bedroom 3 bunks in 2nd bedroom, room addition offers a spacious living room, screen porch. Storage building has power in back yard. Furnished with appliances.
Key facts
- Power in back yard
- Storage building
- Room addition
Tags
Property features AI
Finance
- HOA & community: Part of Twin Harbor Association; HOA dues $550 annually; Community amenities include gated entry, lake access, outdoor pool, picnic area, playground, recreation area, and street lights
Exterior
- Parking: Driveway; No main-level garage
- Utilities: County water; County sewer
- Home design: Manufactured single-family home; One story; Permanent foundation with pillar/post/pier
- Construction: Aluminum and vinyl exterior; Composition roof; Built as manufactured construction
- Exterior features: Level lot; Porch (screened); Outbuilding; Beach access (public); Community boat ramp; Community pier
Interior
- Kitchen: Gas cooktop; Gas oven
- Bedrooms: 2 bedrooms on the main level
- Flooring: Carpet; Vinyl
- Bathrooms: 1 full bathroom on the main level
- Heating & cooling: Propane heating; Wall-mounted cooling unit(s)
- Interior features: Five total rooms; Gas cooktop and gas oven
- Laundry & utility: No laundry facilities listed
Neighborhood map
What this means for you Summary
Snapshot
- This is a 2-bed/1.0-bath other listed at $100k.
Deal economics
- At list price, monthly cash flow is $382 ($5k/yr) — positive.
- The deal already cash-flows at list — no discount required.
- Meets the 1% rule at list price ($1k rent vs $100k).
- Recommended offer: $88k (12.0% below list) — sets the bar for market timing.
- Cap rate 10.9% vs local median 2.9% in Norwood — top-decile yield for the area; either an underpriced asset or a hidden risk that comps aren't pricing in. Stress-test before assuming the spread holds.
Location & tenants
- Location reads 63/100 on livability (#410 in NC) — a middle-class / working-renter tenant base. Strengths: cost of living A+, housing A+, crime A; Watch: schools F, amenities F, commute F.
- Montgomery County Schools (rural): math 29% / reading 34% proficiency, ranked #143 of 178 in NC (top 80%) — families likely to look elsewhere, expect single-tenant / working-renter base with shorter leases; 66% free/reduced lunch — lower-income household profile, screen leases tightly.
- Market conditions: 113 active listings in the ZIP; 138 units permitted in Montgomery County in 2024 (0 in 5+ unit buildings).
Forward outlook
- Local home prices are declining (-0.9%/yr); year-one equity from $691 of loan paydown is wiped out by about $938 of value loss. Plan a longer hold.
- Montgomery County population projected at -17% by 2050 — secular population decline; favor cash flow + early exit over multi-decade hold.
- At projected returns (-0.9% appreciation + 3.0% rent growth), your $28k cash investment doubles in ~6 years — after that, you're playing with house money.
Negotiation context
- It's been on market 287 days — a 12% lower offer ($88k) is reasonable based on typical stale-listing flexibility.
- Current owner paid $80k; 25% above their basis — modest negotiation headroom, anchor on the comps not their cost.
Risks & watch-outs
- Climate carrying-cost: major wind risk, 27% chance of damaging wind over 30y; extreme-heat days projected 7→16/yr by 2055 (HVAC capex compounding) — expect insurance premiums to compound above CPI over the hold.
Questions for the listing agent
- It's been on market 287 days. Have you received any prior offers? Is the seller open to a 12% concession, seller financing, or rate buy-down credit?
- What does the HOA fee cover, when was the last increase, and are there any pending special assessments or reserve-fund shortfalls?
- Why hasn't it sold? Are there any deal-killer items the seller is aware of (foundation, flood, title, zoning, code violations)?
- Is there a deadline driving the sale (1031 exchange, divorce, estate, relocation)? That informs how much negotiation room exists.
- Schools are F-rated, which usually means shorter tenancies and higher turnover. Who's the typical renter profile here, and what's been the actual vacancy rate?
- What's the average days-on-market for RENTAL listings here right now (not sales)? A rising rental-DOM trend means longer vacancies and softer asking-rent achievability than the comps imply.
- What's the recent tenant-quality profile in this submarket — average credit score on applications, eviction rate, late-payment / NSF rate, and stable-employment percentage? A property-management company in the area should have these aggregated.
- How much new for-sale + rental construction is in the pipeline within 1–3 miles? Heavy new supply typically softens prices + rents 12–24 months out; constrained supply supports both.
Investment metrics
- 1% rule
- 1.29% ✓
- Cap rate
- 10.88%
- Cash-on-cash
- 16.36%
- DSCR
- 1.73
- GRM
- 6.5
CMA / ARV
No comps found within radius.
Projected returns pro-forma
-0.94% appreciation · 3.0% rent growth · sell at horizon
- IRR
- 13.4%
- Equity multiple
- 1.61×
- Total profit
- $17,054
- Equity at exit
- $24,436
- IRR
- 19.3%
- Equity multiple
- 2.95×
- Total profit
- $54,537
- Equity at exit
- $25,914
Cash invested: $28,000 (down + closing). Projections, not guarantees.
Landlord ↔ Tenant lean methodology
- Overall (STATE)
- 85 Strongly Landlord-Friendly
- State North Carolina
- 85 Strongly Landlord-Friendly · R+3
- County
- — inherits STATE
- City
- — inherits STATE
ZIP-level market 27306
- Home prices YoY
- -0.3%
- Active inventory
- 113
- Price-to-rent
- 6.5×
Monthly cashflow live
- Estimated rent
- $1,286 medium interval (Pro) →
- Mortgage (P&I)
- −$524
- Tax from tax record
- −$22 /mo · $265/yr
- Insurance
- −$42
- HOA
- −$46
- Vacancy / Maint / Mgmt
- −$270
- Net cashflow
- $382
Break-even live
UW: 25.0% down · 7.5% · 30yr · 1.5% tax · 5.0% vac · 8.0% maint · 8.0% mgmt
Financing live
Cash to close
- Down payment
- $25,000
- Closing costs
- $3,000
- Reserves months
- —
- Total cash needed
- —
Loan-product check · same deal, 3 products live
Conventional
25% down · 7.5% · 30yr
- Down + closing
- —
- Monthly P&I
- —
- Monthly cashflow
- —
- DSCR
- —
- Eligible?
- —
Personal DTI + credit; lowest rate.
DSCR
20% down · 8.5% · 30yr
- Down + closing
- —
- Monthly P&I
- —
- Monthly cashflow
- —
- DSCR
- —
- Eligible?
- —
No personal income docs; deal must DSCR.
Hard money
10% down · 12.0% · 12mo
- Down + closing
- —
- Monthly P&I
- —
- Monthly cashflow
- —
- DSCR
- —
- Eligible?
- —
Short-term bridge; refi at stabilization.
HOA detail
- Monthly dues
- $46 · $552/yr
Listing history 19 events
-
2026-06-18days on market $100,000 Active 287 DOM
-
2026-06-17days on market $100,000 Active 286 DOM
-
2026-06-16days on market $100,000 Active 285 DOM
-
2026-06-15days on market $100,000 Active 284 DOM
-
2026-06-14days on market $100,000 Active 282 DOM
-
2026-06-13days on market $100,000 Active 281 DOM
-
2026-06-10days on market $100,000 Active 279 DOM
-
2026-06-09days on market $100,000 Active 278 DOM
-
2026-06-08days on market $100,000 Active 277 DOM
-
2026-06-07days on market $100,000 Active 276 DOM
-
2026-06-05days on market $100,000 Active 273 DOM
-
2026-06-03days on market $100,000 Active 272 DOM
-
2026-06-02days on market $100,000 Active 271 DOM
-
2026-06-01days on market $100,000 Active 270 DOM
-
2026-06-01price $100,000 Active 269 DOM
-
2026-05-31days on market $105,900 Active 269 DOM
-
2026-05-31days on market $105,900 Active 268 DOM
-
2025-09-04$105,900 Active
-
2023-09-15soldstatus $80,000
ⓘ Source: listings_history table (triggers on properties + properties_extension) + one-shot
backfill from property_details.listing_events for pre-trigger history.
Tax reassessment forecast NC · Resets to sale price
- Current annual tax
- $265 · $22/mo
- Projected year-2 tax
- $820 · $68/mo
- Expected delta
- +$555/yr (+$46/mo · 209.7%)
ⓘ Screening estimate from a state-policy table — verify with the county assessor before closing.
Climate risk First Street
- Flood 1/10 Low FEMA zone X (unshaded) · 0% chance over 30 yrs
- Wildfire 3/10 Moderate
- Heat 6/10 Major 7 d/yr ≥108°F today · 16 d/yr by 30 yrs out
- Wind 6/10 Major 27% chance of damaging wind over 30 yrs
- Air quality 2/10 Low 2 unhealthy d/yr today · 2 by 30 yrs out
Nearby sold comps map
Loading sold comps map…
Walkable amenities ~0.75 mi
Loading nearby amenities…
Taxation est. · year 1
- Rental income
- $15,433
- − Mortgage interest
- −$5,602
- − Property taxes
- −$265
- − Insurance
- −$500
- − Repairs & maintenance
- −$1,235
- − Management
- −$1,235
- − HOA
- −$552
- − Depreciation
- −$2,909
- Taxable income
- $3,136
- Est. tax owed @ 24.0%
- −$753
- After-tax cash flow
- $3,829/yr
For passive investors: Depreciation is non-cash, so a rental often shows a tax loss while cash-flowing — sheltering income. Rental losses are passive: they offset passive income freely, and up to $25,000/yr can offset ordinary (W-2) income if you actively participate and your MAGI is under $100k (phasing out to $0 by $150k); unused losses carry forward. On sale, claimed depreciation is recaptured at up to 25%, and gains may owe capital-gains tax (a 1031 exchange can defer both). Figures are a year-1 estimate at your 24.0% rate — not tax advice; consult a CPA.
Schools (NCES district)
- District
- Montgomery County Schools
- NCES district ID
- 3703060
- Math proficiency
- 29% ▼ -6.00%
- Reading proficiency
- 34% ▼ -2.00%
- Median HH income
- $34,706
- Composite
- 25.97/100
- National rank
- #7328
- State rank
- #143 of 178 in NC
Livability — Norwood
- Score
- 63/100
- State rank
- #410
- US rank
- #15485
Category grades
Schools grade is shown separately in the Schools card above.
Census & demographics
- Population (ZIP)
- 5,457
Population outlook (Montgomery County) Hauer SSP2
- Today (2025)
- 26,533 people
- By 2030
- 25,724 · -3.0%
- By 2040
- 23,842 · -10.1%
- By 2050
- 22,077 · -16.8%
- By 2075
- 18,754 · -29.3%
- By 2100
- 15,537 · -41.4%
Race, ethnicity, and origin ACS 2023
- Neighborhood character
- Majority White (64%)
- Race & ethnicity
- White 64% Black 26% Asian 6% Hispanic / Latino 2% Two or more races 2%
- Common ancestry
- Slovak 2% Serbian 1% Iranian 1%
- Foreign-born
- 6% · China, Canada, Philippines
- Languages at home
- 92% English-only · Other Asian/Pacific 5% Spanish 2% Chinese 1%
Political lean MEDSL · Montgomery
- 2024 margin
- Solid R (+37.8) · D 30.8% · R 68.6%
- 2008→2024 swing
- -26.9pp toward R · 2008: -11.0pp · 2024: -37.8pp
- All cycles
- 2024: R+37.8 2020: R+31.8 2016: R+25.9 2012: R+15.2 2008: R+11.0
Not yet ingested
- Civics
- —
Market trends
- HPI YoY
- ▼ -0.94%
- Current HPI
- 334.2599
- Rent YoY
- —
- Metro
- —
- State GDP YoY
- ▲ 3.28%
- F500 in state
- 26
Industry mix (Fortune 500 HQ in NC)
| Industry | F500 HQs | Revenue |
|---|---|---|
| Financial Services | 2 | $213B |
|
||
| Retail | 2 | $95B |
|
||
| Industrial Conglomerate | 1 | $38B |
|
||
| Metals / Steel | 1 | $35B |
|
||
| Utilities | 1 | $30B |
|
||
| Industrial Machinery | 1 | $19B |
|
||
Price history
+32.4% since first listed2 events — show timeline
- 2025-09-04 Listed $105,900 CANOPYMLS as Distributed by MLS Grid
- 2023-09-15 Sold (Public Records) $80,000 Public Records
Property tax history
-2.0%/yrLatest (2024): $265 · -3.9% YoY. Source: county tax records.
Cash-flow waterfall
monthlySold comps — $/sqft
last 12 mo · ≤1 miLoading sold comps…