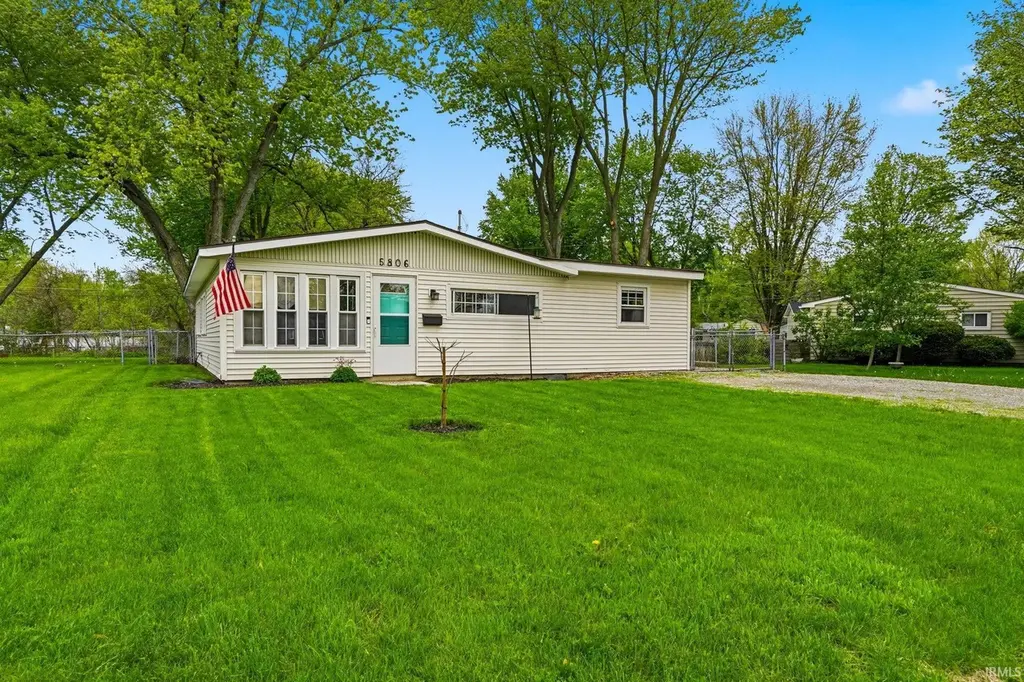
5806 Remington Dr · Fort Wayne, IN
Flood risk 4/10 · Minor
- FEMA flood zone
- X (shaded)
- Chance of flooding over 30 yrs
- 0.22%
- Est. flood insurance / yr
- $507 – $1,088
Fire risk 1/10 · Minimal
- Est. fire insurance / yr
- $717 – $1,331
Heat risk 3/10 · Minor
- Hot days now (above 100°F)
- 7 days/yr
- Hot days in 30 yrs
- 17 days/yr
Wind risk 2/10 · Minimal
- Chance of severe wind over 30 yrs
- —
Air-quality risk 3/10 · Minor
- Unhealthy air days now
- 2 days/yr
- Unhealthy air days in 30 yrs
- 4 days/yr
Risk factors via First Street. Map © Google.
Why this score? — see what drove the D+ grade
The composite is a weighted blend of 9 inputs, each scored 0–100. Each bar is that input's sub-score; the figure is the points it added to the 100-point composite (weight × sub-score).
- Cash flow +14.8/30.0
- ARV discount +12.1/15.0
- DSCR +4.5/10.0
- Livability +4.2/5.0
- 1% rule +3.0/10.0
- Rent growth +2.5/5.0
- Condition / age +2.5/5.0
- Schools +2.2/10.0
- Appreciation +0.0/10.0
$169,900
🖨 Deal sheet (PDF) 📄 Offer letter ✓ Due diligence
Listing remarks
* * Multiple Offers Received. Highest and Best due by 7:30PM, 04/29 * * This well-maintained ranch home offers three bedrooms and one full bathroom, situated in a desirable subdivision near The Clyde Theatre and Foster Park. The home features a spacious layout with two separate living areas, providing flexibility for both everyday living and entertaining. Inside, you’ll find updated flooring throughout the main living spaces along with vinyl replacement windows that enhance efficiency and comfort. Mechanical updates include a furnace, central air conditioning system, and water heater all replaced approximately six years ago. The exterior offers a generously sized fenced-in backyard
Key facts
- Ranch home
- Wood deck
- Updated flooring
Tags
Property features AI
Exterior
- Parking: Detached 2-car garage
- Utilities: Public water; Public sewer
- Home design: Single-family site-built home; One story
- Construction: Vinyl siding; Slab foundation
- Exterior features: Level lot; Lot dimensions approximately 70 x 191; Approximately 0.25 acre lot
Interior
- Kitchen: Includes dishwasher, microwave, refrigerator, gas range
- Bedrooms: Total of 5 rooms (bedrooms included)
- Bathrooms: 1 full bathroom, located on the main level
- Heating & cooling: Forced-air natural gas heating; Central air conditioning
- Interior features: Dishwasher; Microwave; Refrigerator; Gas range
- Laundry & utility: Washer and dryer on the main level
Neighborhood map
What this means for you Summary
Snapshot
- This is a 3-bed/1.0-bath single-family listed at $170k.
Deal economics
- At list price, monthly cash flow is $46 ($553/yr) — positive.
- The deal already cash-flows at list — no discount required.
- To meet the 1% rule (rent ≥ 1% of price), the offer needs to be $136k (19.7% below list).
- Recommended offer: $136k (19.7% below list) — sets the bar for 1% rule.
- Cap rate 6.6% vs local median 4.7% in Fort Wayne — top-decile yield for the area; either an underpriced asset or a hidden risk that comps aren't pricing in. Stress-test before assuming the spread holds.
Location & tenants
- Location reads 84/100 on livability (#6 in IN, #676 nationally) — a professional / high-income tenant draw. Strengths: amenities A+, commute A+, cost of living A+; Watch: crime C-, employment D+.
- Fort Wayne Community Schools (urban): math 22% / reading 29% proficiency, ranked #263 of 301 in IN (top 87%) — low school quality limits family demand, transient renter base, plan for 1-2y turnover; 60% free/reduced lunch — lower-income household profile, screen leases tightly.
- Zoned schools: Waynedale Elementary School (math 22% / reading 22%, grade F, #790 of 994 statewide, top 81%, 383 students, 74% FRL); Portage Middle School (math 8% / reading 18%, grade F, #304 of 330 statewide, top 94%, 436 students, 79% FRL); Wayne High School (math 17% / reading 52%, grade F, #270 of 369 statewide, top 77%, 1,419 students, 68% FRL).
- Market conditions: 36 active listings in the ZIP; 8 comparable units currently listed for rent nearby; rentals at typical pace (median 16d on market — plan ~3-4 weeks tenant-placement turnaround); 1,861 units permitted in Allen County in 2024 (576 in 5+ unit buildings).
- This rent runs 31% of the median local income ($52k/yr) — at the standard rent-burdened threshold; future hikes will face affordability resistance.
Forward outlook
- Local home prices are declining (-3.0%/yr); year-one equity from $1k of loan paydown is wiped out by about $5k of value loss. Plan a longer hold.
- Allen County population projected at +10% by 2050 — modest demand growth; plan on rents tracking national, not racing it.
Negotiation context
- Only 1 days on market — expect competitive offers; lowballing is unlikely to land.
Risks & watch-outs
- Watch-outs: built in 1956 — expect roof / HVAC / electrical / plumbing capex.
Questions for the listing agent
- Built in 1956 — when were the roof, HVAC, electrical panel, plumbing, and water heater last replaced?
- Is there a deadline driving the sale (1031 exchange, divorce, estate, relocation)? That informs how much negotiation room exists.
- Schools are D-rated, which usually means shorter tenancies and higher turnover. Who's the typical renter profile here, and what's been the actual vacancy rate?
- The area grade is low — what's the realistic commute time and amenity access for the typical tenant pool here? Any planned neighborhood developments (good or bad) we should know about?
- What's the average days-on-market for RENTAL listings here right now (not sales)? A rising rental-DOM trend means longer vacancies and softer asking-rent achievability than the comps imply.
- What's the recent tenant-quality profile in this submarket — average credit score on applications, eviction rate, late-payment / NSF rate, and stable-employment percentage? A property-management company in the area should have these aggregated.
- How much new for-sale + rental construction is in the pipeline within 1–3 miles? Heavy new supply typically softens prices + rents 12–24 months out; constrained supply supports both.
Investment metrics
- 1% rule
- 0.80% ✗
- Cap rate
- 6.62%
- Cash-on-cash
- 1.16%
- DSCR
- 1.05
- GRM
- 10.4
CMA / ARV
- ARV (on-the-fly)
- $189,336
- Comps found
- 12
Show comp detail 12 sales within ~0.75 mi
| Address | Dist | Beds/Ba | Sqft | Sold | Price | $/sf | Match |
|---|---|---|---|---|---|---|---|
| 5806 Remington Dr | 0.00mi | 3/1.0 | 1,288 (0%) | 1mo | $176,000 | $137 | 99 |
| 2621 Belle Vista Blvd | 0.14mi | 3/1.0 | 1,248 (-3%) | 2mo | $149,900 | $120 | 87 |
| 2606 Prairie Grove Dr | 0.46mi | 3/1.0 | 1,282 (-0%) | 11mo | $191,000 | $149 | 69 |
| 2817 Prairie Grove Dr | 0.58mi | 3/2.0 | 1,315 (+2%) | 5mo | $224,900 | $171 | 61 |
| 6305 Bluffton Rd | 0.43mi | 4/1.5 (+1) | 1,344 (+4%) | 6mo | $189,000 | $141 | 60 |
| 2814 Prairie Grove Dr | 0.55mi | 3/1.0 | 1,213 (-6%) | 6mo | $169,000 | $139 | 60 |
| 6308 Maywood Cir | 0.45mi | 2/1.0 (-1) | 1,232 (-4%) | 11mo | $190,000 | $154 | 58 |
| 2807 Witchwood Dr | 0.67mi | 2/1.0 (-1) | 1,223 (-5%) | 0mo | $180,000 | $147 | 55 |
| 2515 Fairoak Dr | 0.67mi | 3/1.0 | 1,128 (-12%) | 3mo | $189,000 | $168 | 45 |
| 2904 Pinewood Dr | 0.47mi | 3/2.0 | 1,464 (+14%) | 8mo | $219,000 | $150 | 45 |
| 2701 Prairie Grove Dr | 0.50mi | 2/1.0 (-1) | 1,440 (+12%) | 9mo | $157,000 | $109 | 45 |
| 2710 Waynewood Dr | 0.75mi | 3/1.0 | 1,456 (+13%) | 1mo | $183,900 | $126 | 42 |
Match score weights: distance 35% · size 25% · config 20% · recency 20%. Top-matched comps best support the ARV.
Projected returns pro-forma
-3.0% appreciation · 3.0% rent growth · sell at horizon
- IRR
- -14.5%
- Equity multiple
- 0.48×
- Total profit
- $-24,664
- Equity at exit
- $25,333
- IRR
- -5.9%
- Equity multiple
- 0.62×
- Total profit
- $-17,971
- Equity at exit
- $14,690
Cash invested: $47,572 (down + closing). Projections, not guarantees.
Landlord ↔ Tenant lean methodology
- Overall (STATE)
- 90 Strongly Landlord-Friendly
- State Indiana
- 90 Strongly Landlord-Friendly · R+11
- County
- — inherits STATE
- City
- — inherits STATE
ZIP-level market 46809
- Active inventory
- 36
- Price-to-rent
- 10.4×
Monthly cashflow live
- Estimated rent
- $1,364 high interval (Pro) →
- Mortgage (P&I)
- −$891
- Tax from tax record
- −$69 /mo · $834/yr
- Insurance
- −$71
- HOA
- −$0
- Vacancy / Maint / Mgmt
- −$286
- Net cashflow
- $46
Break-even live
Sensitivity live
| Price | -10% $142 | -5% $94 | +0% $46 | +5% $-2 | +10% $-50 |
|---|---|---|---|---|---|
| Rent | -10% $-62 | -5% $-8 | +0% $46 | +5% $100 | +10% $154 |
| Rate | -1.0pp $132 | -0.5pp $89 | base $46 | +0.5pp $2 | +1.0pp $-43 |
UW: 25.0% down · 7.5% · 30yr · 1.5% tax · 5.0% vac · 8.0% maint · 8.0% mgmt
Financing live
Cash to close
- Down payment
- $42,475
- Closing costs
- $5,097
- Reserves months
- —
- Total cash needed
- —
Loan-product check · same deal, 3 products live
Conventional
25% down · 7.5% · 30yr
- Down + closing
- —
- Monthly P&I
- —
- Monthly cashflow
- —
- DSCR
- —
- Eligible?
- —
Personal DTI + credit; lowest rate.
DSCR
20% down · 8.5% · 30yr
- Down + closing
- —
- Monthly P&I
- —
- Monthly cashflow
- —
- DSCR
- —
- Eligible?
- —
No personal income docs; deal must DSCR.
Hard money
10% down · 12.0% · 12mo
- Down + closing
- —
- Monthly P&I
- —
- Monthly cashflow
- —
- DSCR
- —
- Eligible?
- —
Short-term bridge; refi at stabilization.
Rent comps 8 comps
| Address | Beds | Baths | Sqft | Rent | $/sqft | DOM | Units | Dist |
|---|---|---|---|---|---|---|---|---|
| 1730 Scotsdale Dr Fort Wayne, IN | 3.0 | 1.0 | 1192 | $1,125 | $0.94 | 15d | 1 | 0.39mi |
| 3047 Boardwalk Cir Fort Wayne, IN | 1.0–3.0 | 1.0–2.0 | 893 | $1,425 | $1.59 | 15d | 2 | 0.64mi |
| 1003 Pointe Center Cv Unit 1003 Fort Wayne, IN | 2.0 | 1.5 | 1200 | $1,275 | $1.06 | 46d | 1 | 1.16mi |
| 700 Candlelite Ct Fort Wayne, IN | 2.0–3.0 | 1.0–2.5 | 1388 | $1,399 | $1.01 | 15d | 4 | 1.31mi |
| 522 Pinegrove Ln Fort Wayne, IN | 2.0–3.0 | 1.0–1.5 | 1248 | $1,259 | $1.01 | 15d | 8 | 1.31mi |
| Galahad Cv Fort Wayne, IN | 3.0 | 1.5 | 1352 | $1,475 | $1.09 | 45d | 1 | 1.46mi |
| 6440 Fairfield Ave Fort Wayne, IN | 1.0–2.0 | 1.0–1.5 | 928 | $1,344 | $1.45 | 15d | 10 | 1.47mi |
| 5009 Hoagland Ave Fort Wayne, IN | 2.0 | 1.0 | 1000 | $1,300 | $1.30 | 45d | 1 | 1.49mi |
Listing history 2 events
-
2026-04-29status Pending
-
2026-04-28$169,900 Active
ⓘ Source: listings_history table (triggers on properties + properties_extension) + one-shot
backfill from property_details.listing_events for pre-trigger history.
Tax reassessment forecast IN · Partial reset (capped growth)
- Current annual tax
- $834 · $69/mo
- Projected year-2 tax
- $1,139 · $95/mo
- Expected delta
- +$305/yr (+$25/mo · 36.6%)
ⓘ Screening estimate from a state-policy table — verify with the county assessor before closing.
Climate risk First Street
- Flood 4/10 Moderate FEMA zone X (shaded) · 22% chance over 30 yrs
- Wildfire 1/10 Low
- Heat 3/10 Moderate 7 d/yr ≥100°F today · 17 d/yr by 30 yrs out
- Wind 2/10 Low
- Air quality 3/10 Moderate 2 unhealthy d/yr today · 4 by 30 yrs out
Nearby sold comps map
Loading sold comps map…
Walkable amenities ~0.75 mi
Loading nearby amenities…
Taxation est. · year 1
- Rental income
- $16,365
- − Mortgage interest
- −$9,517
- − Property taxes
- −$834
- − Insurance
- −$850
- − Repairs & maintenance
- −$1,309
- − Management
- −$1,309
- − Depreciation
- −$4,943
- Taxable loss
- −$2,397
- Est. tax savings @ 24.0%
- +$575
- After-tax cash flow
- $1,128/yr
For passive investors: Depreciation is non-cash, so a rental often shows a tax loss while cash-flowing — sheltering income. Rental losses are passive: they offset passive income freely, and up to $25,000/yr can offset ordinary (W-2) income if you actively participate and your MAGI is under $100k (phasing out to $0 by $150k); unused losses carry forward. On sale, claimed depreciation is recaptured at up to 25%, and gains may owe capital-gains tax (a 1031 exchange can defer both). Figures are a year-1 estimate at your 24.0% rate — not tax advice; consult a CPA.
Schools (NCES district)
- District
- Fort Wayne Community Schools
- NCES district ID
- 1803630
- Math proficiency
- 22% ▼ -11.00%
- Reading proficiency
- 29% ▼ -7.00%
- Median HH income
- $41,951
- Composite
- 21.68/100
- National rank
- #8275
- State rank
- #263 of 301 in IN
Livability — Fort Wayne
- Score
- 84/100
- State rank
- #6
- US rank
- #676
Category grades
Schools grade is shown separately in the Schools card above.
Census & demographics
- Census place
- Fort Wayne, IN
- County
- Allen County · 326,813 people
- City population
- 326,813
- Metro
- Fort Wayne, IN
- Population (ZIP)
- 8,589
- Household income
- $52,253
- Rent vs Own
- Severe rent burden
- 367.0
Population outlook (Allen County) Hauer SSP2
- Today (2025)
- 394,020 people
- By 2030
- 405,128 · +2.8%
- By 2040
- 423,476 · +7.5%
- By 2050
- 435,137 · +10.4%
- By 2075
- 450,293 · +14.3%
- By 2100
- 424,101 · +7.6%
Race, ethnicity, and origin ACS 2023
- Neighborhood character
- Predominantly White (73%)
- Race & ethnicity
- White 73% Hispanic / Latino 17% Two or more races 8% Black 6%
- Hispanic origin (detail)
- Mexican 13%
- Common ancestry
- Italian 2% Romanian 2% Lithuanian 2%
- Foreign-born
- 7% · Canada, Jamaica, Philippines
- Languages at home
- 89% English-only · Spanish 10% French/Haitian/Cajun 1% Other Asian/Pacific 1%
Political lean MEDSL · Allen
- 2024 margin
- R (+12.5) · D 42.9% · R 55.4% · Other 1.7%
- 2008→2024 swing
- -8.1pp toward R · 2008: -4.3pp · 2024: -12.5pp
- All cycles
- 2024: R+12.5 2020: R+11.2 2016: R+19.6 2012: R+16.8 2008: R+4.3
Not yet ingested
- Civics
- —
Market trends
- HPI YoY
- ▼ -201.22%
- Current HPI
- 273.9779
- Rent YoY
- —
- Metro
- Fort Wayne, IN
- State GDP YoY
- ▲ 2.90%
- F500 in state
- 18
Industry mix (Fortune 500 HQ in IN)
| Industry | F500 HQs | Revenue |
|---|---|---|
| Industrial Machinery | 2 | $37B |
|
||
| Healthcare | 1 | $177B |
|
||
| Pharmaceuticals | 1 | $45B |
|
||
| Metals / Steel | 1 | $18B |
|
||
| Agriculture | 1 | $17B |
|
||
| Packaging | 1 | $12B |
|
||
Price history
2 events — show timeline
- 2026-04-29 Pending — IRMLS
- 2026-04-28 Listed $169,900 IRMLS
Property tax history
-0.2%/yrLatest (2024): $834 · +16.5% YoY. Source: county tax records.
Cash-flow waterfall
monthlySold comps — $/sqft
last 12 mo · ≤1 miLoading sold comps…