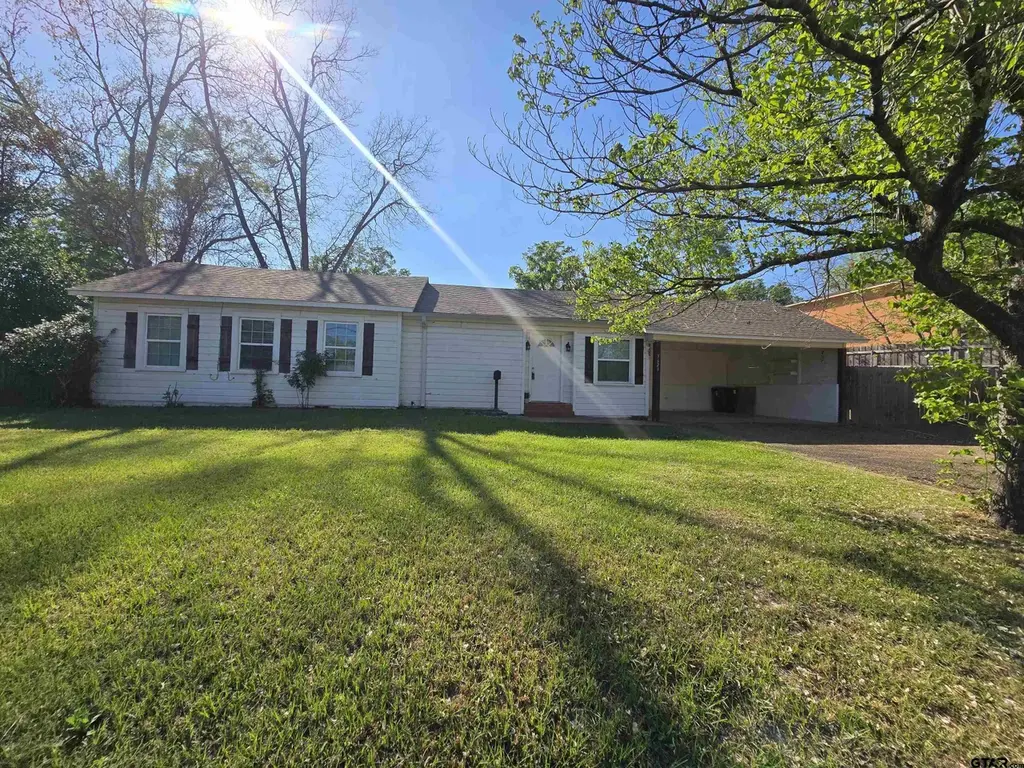
3623 New Copeland Rd · Tyler, TX
Flood risk 1/10 · Minimal
- FEMA flood zone
- X (unshaded)
- Chance of flooding over 30 yrs
- 0.0%
- Est. flood insurance / yr
- $507 – $1,088
Fire risk 1/10 · Minimal
- Est. fire insurance / yr
- $1,222 – $2,270
Heat risk 7/10 · Major
- Hot days now (above 109°F)
- 7 days/yr
- Hot days in 30 yrs
- 26 days/yr
Wind risk 6/10 · Moderate
- Chance of severe wind over 30 yrs
- 61.0%
Air-quality risk 2/10 · Minimal
- Unhealthy air days now
- 0 days/yr
- Unhealthy air days in 30 yrs
- 1 days/yr
Risk factors via First Street. Map © Google.
Why this score? — see what drove the B- grade
The composite is a weighted blend of 9 inputs, each scored 0–100. Each bar is that input's sub-score; the figure is the points it added to the 100-point composite (weight × sub-score).
- Cash flow +25.9/30.0
- ARV discount +15.0/15.0
- DSCR +8.7/10.0
- 1% rule +7.3/10.0
- Livability +3.8/5.0
- Rent growth +3.4/5.0
- Schools +3.3/10.0
- Condition / age +2.5/5.0
- Appreciation +0.0/10.0
$159,999
🖨 Deal sheet 📄 Offer letter ✓ Due diligence
Listing remarks MLS
Price Improvement!! Welcome to 3623 New Copeland Rd in the heart of Tyler! This 3-bedroom, 2-bath home offers a versatile layout with two spacious living areas, a formal dining room, and a desirable split floor plan. Featuring a gas stove, abundant storage throughout, and walk-in closets in two of the bedrooms, this home provides both functionality and comfort. Situated on a generously sized lot, the large backyard offers endless possibilities for outdoor living, entertaining, or future improvements. The property also includes a 2-car carport with an additional washer/dryer hookup located in the storage area—perfect for added convenience or flexible use. Ideally located just minutes from the loop, schools, shopping, and dining, this home sits right in the center of Tyler, making it highly attractive for homeowners and investors alike. With some updates already completed and room for additional improvements, this property presents a fantastic opportunity as a primary residence, rental investment, or flip.
Key facts
- Formal dining room
- Large backyard
- Walk-in closets
Tags
Neighborhood map
What this means for you Summary
Snapshot
- This is a 3-bed/1.0-bath single-family listed at $160k.
Deal economics
- At list price, monthly cash flow is $395 ($5k/yr) — positive.
- The deal already cash-flows at list — no discount required.
- Meets the 1% rule at list price ($2k rent vs $160k).
- Recommended offer: $150k (6.0% below list) — sets the bar for market timing.
- Cap rate 9.3% vs local median 3.6% in Tyler — top-decile yield for the area; either an underpriced asset or a hidden risk that comps aren't pricing in. Stress-test before assuming the spread holds.
Location & tenants
- Location reads 75/100 on livability (#147 in TX, #4,181 nationally) — a middle-class / working-renter tenant base. Strengths: cost of living A+, housing A+, health & safety A+; Watch: employment C-, schools D+, crime D+.
- Tyler ISD (urban): math 39% / reading 38% proficiency, ranked #449 of 826 in TX (top 54%) — families likely to look elsewhere, expect single-tenant / working-renter base with shorter leases; 66% free/reduced lunch — lower-income household profile, screen leases tightly.
- Market conditions: Rents rising (+3.7%/yr); 327 active listings in the ZIP; 19 comparable units currently listed for rent nearby; rentals leasing fast (median 13d on market — plan ~1-2 weeks tenant-placement turnaround); 42% of comp listings sitting > 30 days — soft ceiling on asking rent; 595 units permitted in Smith County in 2024 (45 in 5+ unit buildings).
- This rent runs 36% of the median local income ($66k/yr) — at the standard rent-burdened threshold; future hikes will face affordability resistance.
Forward outlook
- Local home prices are declining (-3.0%/yr); year-one equity from $1k of loan paydown is wiped out by about $5k of value loss. Plan a longer hold.
- Smith County population projected at +24% by 2050 — long-run rental-demand tailwind backs the buy-and-hold thesis.
- At projected returns (-3.0% appreciation + 3.7% rent growth), your $45k cash investment doubles in ~10 years — after that, you're playing with house money.
Negotiation context
- It's been on market 71 days — a 6% lower offer ($150k) is reasonable based on typical stale-listing flexibility.
- 4 sale attempts since 11y ago with the ask held roughly flat each time — persistent listings suggest the price (not the market) is what's stuck; bring a comps-based counter.
Risks & watch-outs
- Watch-outs: built in 1930 — expect roof / HVAC / electrical / plumbing capex.
- Climate carrying-cost: major wind risk, 61% chance of damaging wind over 30y; extreme-heat days projected 7→26/yr by 2055 (HVAC capex compounding) — expect insurance premiums to compound above CPI over the hold.
Questions for the listing agent
- It's been on market 71 days. Have you received any prior offers? Is the seller open to a 6% concession, seller financing, or rate buy-down credit?
- Built in 1930 — when were the roof, HVAC, electrical panel, plumbing, and water heater last replaced?
- Why hasn't it sold? Are there any deal-killer items the seller is aware of (foundation, flood, title, zoning, code violations)?
- Is there a deadline driving the sale (1031 exchange, divorce, estate, relocation)? That informs how much negotiation room exists.
- Schools are D-rated, which usually means shorter tenancies and higher turnover. Who's the typical renter profile here, and what's been the actual vacancy rate?
- Crime grade is D in this area — have there been break-ins, vandalism, or insurance claims at this property in the last 3 years? What carrier currently insures it and at what premium?
- What's the average days-on-market for RENTAL listings here right now (not sales)? A rising rental-DOM trend means longer vacancies and softer asking-rent achievability than the comps imply.
- What's the recent tenant-quality profile in this submarket — average credit score on applications, eviction rate, late-payment / NSF rate, and stable-employment percentage? A property-management company in the area should have these aggregated.
- How much new for-sale + rental construction is in the pipeline within 1–3 miles? Heavy new supply typically softens prices + rents 12–24 months out; constrained supply supports both.
Investment metrics
- 1% rule
- 1.23% ✓
- Cap rate
- 9.25%
- Cash-on-cash
- 10.57%
- DSCR
- 1.47
- GRM
- 6.8
CMA / ARV
- ARV (median comp)
- $234,429
- List price
- $159,999
- Delta
- -31.75%
- Verdict
- UNDERPRICED
- Comps
- 20 within 1.0 mi
Show comp detail 7 sales within ~0.75 mi
| Address | Dist | Beds/Ba | Sqft | Sold | Price | $/sf | Match |
|---|---|---|---|---|---|---|---|
| 3323 S Keaton Ave | 0.34mi | 3/2.0 | 1,668 (+2%) | 8mo | $245,000 | $147 | 70 |
| 3229 Donnybrook | 0.31mi | 3/1.5 | 1,720 (+5%) | 24mo | $239,000 | $139 | 55 |
| 611 E Watkins St | 0.62mi | 3/1.0 | 1,478 (-9%) | 3mo | $229,000 | $155 | 53 |
| 3523 Cameron Ave | 0.52mi | 3/2.0 | 1,826 (+12%) | 4mo | $307,500 | $168 | 48 |
| 213 E Sheridan | 0.46mi | 2/2.0 (-1) | 1,819 (+12%) | 5mo | $185,000 | $102 | 46 |
| 110 Samuel St | 0.46mi | 3/2.0 | 1,870 (+15%) | 14mo | $305,000 | $163 | 39 |
| 1106 Clyde Dr | 0.71mi | 4/2.0 (+1) | 1,719 (+5%) | 13mo | $200,000 | $116 | 38 |
Match score weights: distance 35% · size 25% · config 20% · recency 20%. Top-matched comps best support the ARV.
Projected returns pro-forma
-3.0% appreciation · 3.66% rent growth · sell at horizon
- IRR
- 0.3%
- Equity multiple
- 1.01×
- Total profit
- $579
- Equity at exit
- $23,856
- IRR
- 10.7%
- Equity multiple
- 1.86×
- Total profit
- $38,586
- Equity at exit
- $13,834
Cash invested: $44,800 (down + closing). Projections, not guarantees.
Landlord ↔ Tenant lean methodology
- Overall (STATE)
- 87 Strongly Landlord-Friendly
- State Texas
- 87 Strongly Landlord-Friendly · R+5
- County
- — inherits STATE
- City
- — inherits STATE
ZIP-level market 75701
- Rents YoY
- 3.7%
- Active inventory
- 327
- Price-to-rent
- 6.8×
Monthly cashflow live
- Estimated rent
- $1,968 high interval (Pro) →
- Mortgage (P&I)
- −$839
- Tax from tax record
- −$255 /mo · $3,055/yr
- Insurance
- −$67
- HOA
- −$0
- Vacancy / Maint / Mgmt
- −$413
- Net cashflow
- $395
Break-even live
UW: 25.0% down · 7.5% · 30yr · 1.5% tax · 5.0% vac · 8.0% maint · 8.0% mgmt
Financing live
Cash to close
- Down payment
- $40,000
- Closing costs
- $4,800
- Reserves months
- —
- Total cash needed
- —
Loan-product check · same deal, 3 products live
Conventional
25% down · 7.5% · 30yr
- Down + closing
- —
- Monthly P&I
- —
- Monthly cashflow
- —
- DSCR
- —
- Eligible?
- —
Personal DTI + credit; lowest rate.
DSCR
20% down · 8.5% · 30yr
- Down + closing
- —
- Monthly P&I
- —
- Monthly cashflow
- —
- DSCR
- —
- Eligible?
- —
No personal income docs; deal must DSCR.
Hard money
10% down · 12.0% · 12mo
- Down + closing
- —
- Monthly P&I
- —
- Monthly cashflow
- —
- DSCR
- —
- Eligible?
- —
Short-term bridge; refi at stabilization.
Rent comps 19 comps
| Address | Beds | Baths | Sqft | Rent | $/sqft | DOM | Units | Dist |
|---|---|---|---|---|---|---|---|---|
| 3712 Colony Park Dr Tyler, TX | 3.0 | 2.0 | 1802 | $1,850 | $1.03 | 13d | 1 | 0.05mi |
| 509 Winchester Dr Tyler, TX | 4.0 | 2.0 | 1960 | $2,400 | $1.22 | 13d | 1 | 0.07mi |
| 328 Brookwood Dr Tyler, TX | 4.0 | 2.0 | 1985 | $2,300 | $1.16 | 43d | 1 | 0.21mi |
| 3210 S Donnybrook Ave Tyler, TX | 3.0 | 2.0 | 1584 | $1,945 | $1.23 | 20d | 1 | 0.38mi |
| 3206 Bain Pl Tyler, TX | 3.0 | 2.5 | 1840 | $1,895 | $1.03 | 43d | 1 | 0.48mi |
| 3106 S Donnybrook Ave Tyler, TX | 3.0 | 1.0 | 1251 | $1,525 | $1.22 | 13d | 1 | 0.50mi |
| 117 Ridgecrest Dr Tyler, TX | 3.0 | 2.0 | 1571 | $2,150 | $1.37 | 43d | 1 | 0.62mi |
| 614 Woodland Hills Dr Tyler, TX | 2.0 | 2.0 | 1690 | $2,200 | $1.30 | 43d | 1 | 0.78mi |
| 1101 Balmoral Dr Tyler, TX | 3.0 | 2.0 | 1930 | $1,950 | $1.01 | 43d | 1 | 0.82mi |
| 2720 S Broadway Ave Tyler, TX | 1.0–3.0 | 1.0–2.0 | 1064 | $1,330 | $1.25 | 13d | 14 | 0.87mi |
| 826 Wilma St Tyler, TX | 3.0 | 2.0 | 1210 | $1,800 | $1.49 | 13d | 1 | 0.91mi |
| 1909 Sybil Ln Tyler, TX | 1.0–3.0 | 1.0–2.0 | 1067 | $1,510 | $1.42 | 13d | 9 | 1.06mi |
| 4400 Paluxy Dr Tyler, TX | 1.0–3.0 | 1.0–2.0 | 905 | $1,227 | $1.36 | 13d | 60 | 1.13mi |
| 4118 Southpark Dr Tyler, TX | 3.0 | 2.0 | 1552 | $1,450 | $0.93 | 43d | 1 | 1.15mi |
| 4309 Aberdeen Dr Tyler, TX | 3.0 | 2.0 | 1219 | $1,475 | $1.21 | 43d | 1 | 1.20mi |
| 1717 Shiloh Rd Tyler, TX | 1.0–3.0 | 1.0–2.0 | 1000 | $1,449 | $1.45 | 13d | 10 | 1.22mi |
| 4411 Kinsey Dr Tyler, TX | 1.0–2.0 | 1.0–2.0 | 894 | $1,748 | $1.96 | 13d | 15 | 1.39mi |
| 4418 Edinburgh Dr Tyler, TX | 3.0 | 2.0 | 1407 | $1,750 | $1.24 | 43d | 1 | 1.46mi |
| 5058 Paluxy Dr Tyler, TX | 1.0–3.0 | 1.0–2.0 | 965 | $1,608 | $1.67 | 13d | 11 | 1.47mi |
Listing history 21 events
-
2026-06-13statusdays on market $159,999 Pending 71 DOM
-
2026-06-10days on market $159,999 Active 70 DOM
-
2026-06-09days on market $159,999 Active 69 DOM
-
2026-06-08days on market $159,999 Active 68 DOM
-
2026-06-07days on market $159,999 Active 67 DOM
-
2026-06-05days on market $159,999 Active 64 DOM
-
2026-06-02days on market $159,999 Active 62 DOM
-
2026-06-01days on market $159,999 Active 61 DOM
-
2026-05-31days on market $159,999 Active 60 DOM
-
2026-05-30days on market $159,999 Active 59 DOM
-
2026-05-19status Active 1025-char remark
Show marketing remark (1025 chars)
Price Improvement!! Welcome to 3623 New Copeland Rd in the heart of Tyler! This 3-bedroom, 2-bath home offers a versatile layout with two spacious living areas, a formal dining room, and a desirable split floor plan. Featuring a gas stove, abundant storage throughout, and walk-in closets in two of the bedrooms, this home provides both functionality and comfort. Situated on a generously sized lot, the large backyard offers endless possibilities for outdoor living, entertaining, or future improvements. The property also includes a 2-car carport with an additional washer/dryer hookup located in the storage area—perfect for added convenience or flexible use. Ideally located just minutes from the loop, schools, shopping, and dining, this home sits right in the center of Tyler, making it highly attractive for homeowners and investors alike. With some updates already completed and room for additional improvements, this property presents a fantastic opportunity as a primary residence, rental investment, or flip.
-
2026-05-15status Pending 1025-char remark
Show marketing remark (1025 chars)
Price Improvement!! Welcome to 3623 New Copeland Rd in the heart of Tyler! This 3-bedroom, 2-bath home offers a versatile layout with two spacious living areas, a formal dining room, and a desirable split floor plan. Featuring a gas stove, abundant storage throughout, and walk-in closets in two of the bedrooms, this home provides both functionality and comfort. Situated on a generously sized lot, the large backyard offers endless possibilities for outdoor living, entertaining, or future improvements. The property also includes a 2-car carport with an additional washer/dryer hookup located in the storage area—perfect for added convenience or flexible use. Ideally located just minutes from the loop, schools, shopping, and dining, this home sits right in the center of Tyler, making it highly attractive for homeowners and investors alike. With some updates already completed and room for additional improvements, this property presents a fantastic opportunity as a primary residence, rental investment, or flip.
-
2026-05-07price $159,999 1025-char remark
Show marketing remark (1025 chars)
Price Improvement!! Welcome to 3623 New Copeland Rd in the heart of Tyler! This 3-bedroom, 2-bath home offers a versatile layout with two spacious living areas, a formal dining room, and a desirable split floor plan. Featuring a gas stove, abundant storage throughout, and walk-in closets in two of the bedrooms, this home provides both functionality and comfort. Situated on a generously sized lot, the large backyard offers endless possibilities for outdoor living, entertaining, or future improvements. The property also includes a 2-car carport with an additional washer/dryer hookup located in the storage area—perfect for added convenience or flexible use. Ideally located just minutes from the loop, schools, shopping, and dining, this home sits right in the center of Tyler, making it highly attractive for homeowners and investors alike. With some updates already completed and room for additional improvements, this property presents a fantastic opportunity as a primary residence, rental investment, or flip.
-
2026-03-27$165,000 Active 1025-char remark
Show marketing remark (1025 chars)
Price Improvement!! Welcome to 3623 New Copeland Rd in the heart of Tyler! This 3-bedroom, 2-bath home offers a versatile layout with two spacious living areas, a formal dining room, and a desirable split floor plan. Featuring a gas stove, abundant storage throughout, and walk-in closets in two of the bedrooms, this home provides both functionality and comfort. Situated on a generously sized lot, the large backyard offers endless possibilities for outdoor living, entertaining, or future improvements. The property also includes a 2-car carport with an additional washer/dryer hookup located in the storage area—perfect for added convenience or flexible use. Ideally located just minutes from the loop, schools, shopping, and dining, this home sits right in the center of Tyler, making it highly attractive for homeowners and investors alike. With some updates already completed and room for additional improvements, this property presents a fantastic opportunity as a primary residence, rental investment, or flip.
-
2020-02-07soldstatus
-
2019-09-13soldstatus
-
2019-09-12soldstatus 186-char remark
Show marketing remark (186 chars)
Investor or first time home buyer special. 3/2 in the heart of Tyler. This spacious home offers 2 living areas, fenced backyard and much more. with some TLC the possibilities are endless
-
2019-08-26$75,000 186-char remark
Show marketing remark (186 chars)
Investor or first time home buyer special. 3/2 in the heart of Tyler. This spacious home offers 2 living areas, fenced backyard and much more. with some TLC the possibilities are endless
-
2015-06-26soldstatus
-
2015-05-27$60,000
-
2011-01-05soldstatus
ⓘ Source: listings_history table (triggers on properties + properties_extension) + one-shot
backfill from property_details.listing_events for pre-trigger history.
Tax reassessment forecast TX · Resets to sale price
- Current annual tax
- $3,055 · $255/mo
- Projected year-2 tax
- $3,055 · $255/mo
- Expected delta
- $0/yr ($0/mo · 0.0%)
ⓘ Screening estimate from a state-policy table — verify with the county assessor before closing.
Climate risk First Street
- Flood 1/10 Low FEMA zone X (unshaded) · 0% chance over 30 yrs
- Wildfire 1/10 Low
- Heat 7/10 Severe 7 d/yr ≥109°F today · 26 d/yr by 30 yrs out
- Wind 6/10 Major 61% chance of damaging wind over 30 yrs
- Air quality 2/10 Low 0 unhealthy d/yr today · 1 by 30 yrs out
Nearby sold comps map
Loading sold comps map…
Walkable amenities ~0.75 mi
Loading nearby amenities…
Taxation est. · year 1
- Rental income
- $23,617
- − Mortgage interest
- −$8,962
- − Property taxes
- −$3,055
- − Insurance
- −$800
- − Repairs & maintenance
- −$1,889
- − Management
- −$1,889
- − Depreciation
- −$4,655
- Taxable income
- $2,367
- Est. tax owed @ 24.0%
- −$568
- After-tax cash flow
- $4,166/yr
For passive investors: Depreciation is non-cash, so a rental often shows a tax loss while cash-flowing — sheltering income. Rental losses are passive: they offset passive income freely, and up to $25,000/yr can offset ordinary (W-2) income if you actively participate and your MAGI is under $100k (phasing out to $0 by $150k); unused losses carry forward. On sale, claimed depreciation is recaptured at up to 25%, and gains may owe capital-gains tax (a 1031 exchange can defer both). Figures are a year-1 estimate at your 24.0% rate — not tax advice; consult a CPA.
Schools (NCES district)
- District
- Tyler ISD
- NCES district ID
- 4843470
- Math proficiency
- 39% ▼ -4.00%
- Reading proficiency
- 38% ▼ -1.00%
- Median HH income
- $44,090
- Composite
- 32.69/100
- National rank
- #5650
- State rank
- #449 of 826 in TX
Livability — Tyler
- Score
- 75/100
- State rank
- #147
- US rank
- #4181
Category grades
Schools grade is shown separately in the Schools card above.
Census & demographics
- Census place
- Tyler, TX
- County
- Smith County · 180,570 people
- City population
- 127,842
- Metro
- Tyler, TX
- Population (ZIP)
- 36,344
- Household income
- $66,401
- Rent vs Own
- Severe rent burden
- 1116.0
Population outlook (Smith County) Hauer SSP2
- Today (2025)
- 248,890 people
- By 2030
- 261,665 · +5.1%
- By 2040
- 286,114 · +15.0%
- By 2050
- 308,006 · +23.8%
- By 2075
- 354,171 · +42.3%
- By 2100
- 372,828 · +49.8%
Race, ethnicity, and origin ACS 2023
- Neighborhood character
- Diverse neighborhood (Simpson 0.64)
- Race & ethnicity
- White 53% Black 21% Hispanic / Latino 19% Two or more races 8% Asian 2%
- Hispanic origin (detail)
- Mexican 17%
- Common ancestry
- Slovak 2% Italian 1% Lithuanian 1%
- Foreign-born
- 8% · Canada
- Languages at home
- 84% English-only · Spanish 14% Other Indo-European 1%
Political lean MEDSL · Smith
- 2024 margin
- Solid R (+45.1) · D 27.0% · R 72.1%
- 2008→2024 swing
- -5.6pp toward R · 2008: -39.5pp · 2024: -45.1pp
- All cycles
- 2024: R+45.1 2020: R+39.4 2016: R+43.9 2012: R+46.9 2008: R+39.5
Not yet ingested
- Civics
- —
Market trends
- HPI YoY
- ▼ -299.78%
- Current HPI
- 207.238
- Rent YoY
- ▲ 3.66%
- Metro
- Tyler, TX
- State GDP YoY
- ▲ 3.95%
- F500 in state
- 110
Industry mix (Fortune 500 HQ in TX)
| Industry | F500 HQs | Revenue |
|---|---|---|
| Energy | 16 | $1,198B |
|
||
| Technology | 5 | $198B |
|
||
| Engineering / Construction | 4 | $72B |
|
||
| Energy Services | 3 | $60B |
|
||
| Utilities | 3 | $41B |
|
||
| Healthcare | 2 | $330B |
|
||
Price history
+166.7% since first listed11 events — show timeline
- 2026-05-19 Relisted — GTAR
- 2026-05-15 Pending — GTAR
- 2026-05-07 Price Changed $159,999 GTAR
- 2026-03-27 Listed $165,000 GTAR
- 2020-02-07 Sold (Public Records) — Public Records
- 2019-09-13 Sold (Public Records) — Public Records
- 2019-09-12 Sold (MLS) — LAAR
- 2019-08-26 Listed $75,000 LAAR
- 2015-06-26 Sold (MLS) — GTAR
- 2015-05-27 Listed $60,000 GTAR
- 2011-01-05 Sold (Public Records) — Public Records
Property tax history
+11.4%/yrLatest (2024): $3,055 · +17.1% YoY. Source: county tax records.
Cash-flow waterfall
monthlySold comps — $/sqft
last 12 mo · ≤1 miLoading sold comps…