488 S 10000w Rd · Bonfield, IL
Flood risk 1/10 · Minimal
- FEMA flood zone
- X (unshaded)
- Chance of flooding over 30 yrs
- 0.0%
- Est. flood insurance / yr
- $473 – $860
Fire risk 1/10 · Minimal
- Est. fire insurance / yr
- $804 – $1,492
Heat risk 3/10 · Minor
- Hot days now (above 103°F)
- 7 days/yr
- Hot days in 30 yrs
- 16 days/yr
Wind risk 2/10 · Minimal
- Chance of severe wind over 30 yrs
- 2.0%
Air-quality risk 2/10 · Minimal
- Unhealthy air days now
- 1 days/yr
- Unhealthy air days in 30 yrs
- 2 days/yr
Risk factors via First Street. Map © Google.
Why this score? — see what drove the D grade
The composite is a weighted blend of 9 inputs, each scored 0–100. Each bar is that input's sub-score; the figure is the points it added to the 100-point composite (weight × sub-score).
- Cash flow +16.0/30.0
- ARV discount +7.5/15.0
- DSCR +4.9/10.0
- 1% rule +4.0/10.0
- Livability +3.2/5.0
- Schools +3.0/10.0
- Rent growth +2.5/5.0
- Condition / age +2.5/5.0
- Appreciation +0.0/10.0
$119,900
🖨 Deal sheet (PDF) 📄 Offer letter ✓ Due diligence
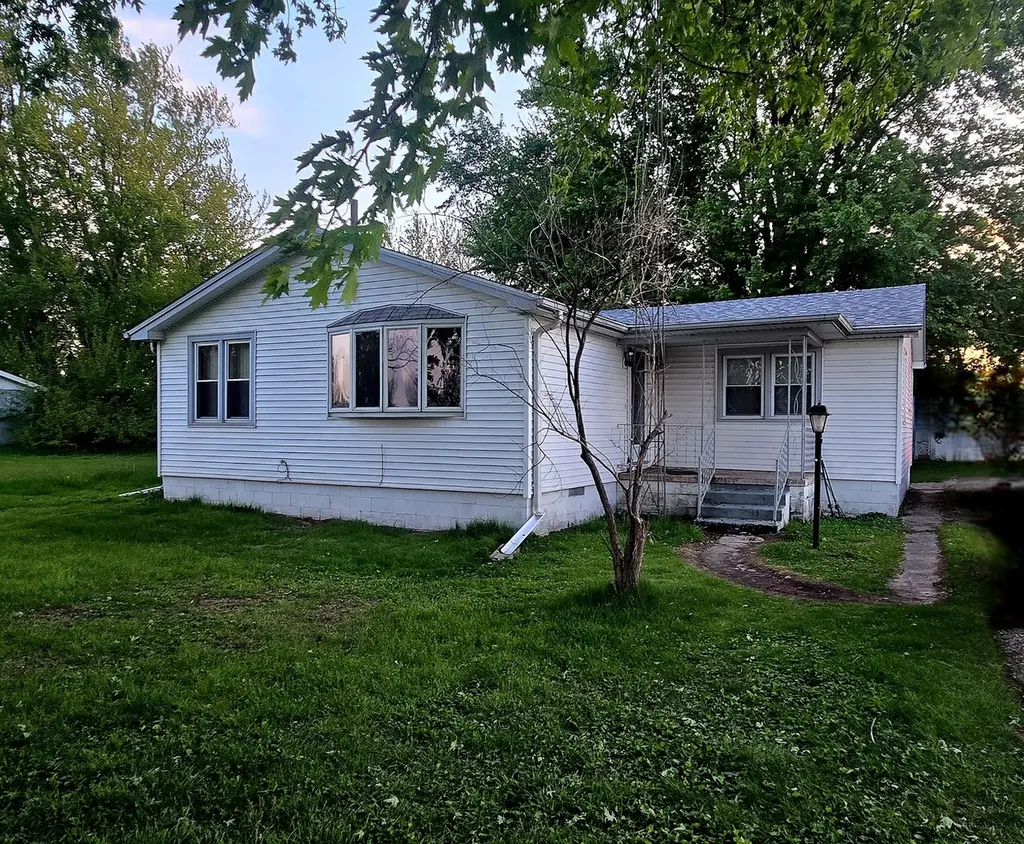
Listing remarks
Country Living with endless potential! This charming 2-bedroom, 1 bath home is situated on a nearly 1-acre country lot offering peaceful surroundings, open space, and the opportunity to make it your own. Inside, you'll find a spacious living room, an eat-in kitchen perfect for gathering and a separate laundry room. Outside features include a 2.5-car detached garage, large garden beds ready for your seasonal planting, and mature fruit trees that add to the property's country charm. Whether you're looking for a starter home, investment opportunity, or quiet rural retreat, this property offers great possibilities with a little TLC and vision. Sold strictly AS-IS/No Repairs. HVAC 2024/water h
Key facts
- 0.89 acre lot
- 2 garage spots
- Listed 11 days
Property features AI
Finance
- Other: Lot size approximately 0.5–0.99 acre; Lot dimensions listed as 38332; Zoned single-family
- HOA & community: No master association fee required
Exterior
- Parking: Approximately 2.5 garage spaces (detached garage); About 6.5 total parking spaces; Gravel driveway and off-street parking; Garage with door opener, garage owned/owned
- Utilities: Well water; Septic sewer
- Home design: Detached single-family home; One-story; Fee simple ownership; School bus service available
- Construction: Aluminum siding; Asphalt roof; Block foundation; Built before 1978
- Exterior features: Mature trees; Level lot; Street paved
Interior
- Kitchen: Kitchen with eating area/table space (main level) 14 x 11, carpet
- Bedrooms: 2 bedrooms total; Bedroom (main level) 14 x 11, carpet; Master bedroom (main level) 11 x 20, carpet
- Flooring: Carpet in living areas, bedrooms, dining and kitchen; Linoleum in laundry
- Bathrooms: 1 full bathroom
- Heating & cooling: Natural gas heating; Central air conditioning
- Interior features: First-floor bedroom; First-floor full bathroom; Dining room separate (dining combo); Drapes on windows; 5 total rooms; Attic unfinished; Crawl space basement
- Laundry & utility: Main-level laundry in unit (11 x 10, linoleum)
Neighborhood map
What this means for you Summary
Snapshot
- This is a 2-bed/1.0-bath single-family listed at $120k.
Deal economics
- At list price, monthly cash flow is $60 ($716/yr) — positive.
- The deal already cash-flows at list — no discount required.
- To meet the 1% rule (rent ≥ 1% of price), the offer needs to be $108k (9.7% below list).
- Recommended offer: $108k (9.7% below list) — sets the bar for 1% rule.
Location & tenants
- Location reads 65/100 on livability (#654 in IL) — a middle-class / working-renter tenant base. Strengths: cost of living A+, housing A+, employment B; Watch: health & safety C-, amenities F, commute F.
- Herscher CUSD 2 (rural): math 32% / reading 32% proficiency, ranked #202 of 620 in IL (top 33%) — families likely to look elsewhere, expect single-tenant / working-renter base with shorter leases.
- Zoned schools: Bonfield Grade School (323 students, 0% FRL); Limestone Middle Sch (math 27% / reading 30%, grade F, #277 of 665 statewide, top 42%, 501 students, 0% FRL); Herscher High School (math 37% / reading 27%, grade F, #157 of 693 statewide, top 25%, 502 students, 0% FRL) — zoned schools average 0% FRL vs 23% district-wide (23 pts lower); this property's tenant base skews higher-income than the district average.
- Market conditions: 7 active listings in the ZIP; 145 units permitted in Kankakee County in 2024 (5 in 5+ unit buildings).
Forward outlook
- Local home prices are declining (-3.0%/yr); year-one equity from $829 of loan paydown is wiped out by about $4k of value loss. Plan a longer hold.
- Kankakee County population projected at -19% by 2050 — secular population decline; favor cash flow + early exit over multi-decade hold.
Negotiation context
- Only 11 days on market — expect competitive offers; lowballing is unlikely to land.
- Current owner paid $58k; list at $120k implies a 107% gain — meaningful room to come down on a strong offer.
Questions for the listing agent
- Is there a deadline driving the sale (1031 exchange, divorce, estate, relocation)? That informs how much negotiation room exists.
- The area grade is low — what's the realistic commute time and amenity access for the typical tenant pool here? Any planned neighborhood developments (good or bad) we should know about?
- What's the average days-on-market for RENTAL listings here right now (not sales)? A rising rental-DOM trend means longer vacancies and softer asking-rent achievability than the comps imply.
- What's the recent tenant-quality profile in this submarket — average credit score on applications, eviction rate, late-payment / NSF rate, and stable-employment percentage? A property-management company in the area should have these aggregated.
- How much new for-sale + rental construction is in the pipeline within 1–3 miles? Heavy new supply typically softens prices + rents 12–24 months out; constrained supply supports both.
Investment metrics
- 1% rule
- 0.90% ✗
- Cap rate
- 6.89%
- Cash-on-cash
- 2.13%
- DSCR
- 1.09
- GRM
- 9.2
CMA / ARV
No comps found within radius.
Projected returns pro-forma
-3.0% appreciation · 3.0% rent growth · sell at horizon
- IRR
- -12.9%
- Equity multiple
- 0.53×
- Total profit
- $-15,633
- Equity at exit
- $17,877
- IRR
- -3.9%
- Equity multiple
- 0.74×
- Total profit
- $-8,736
- Equity at exit
- $10,367
Cash invested: $33,572 (down + closing). Projections, not guarantees.
Landlord ↔ Tenant lean methodology
- Overall (STATE)
- 43 Moderately Tenant-Leaning
- State Illinois
- 43 Moderately Tenant-Leaning · D+7
- County
- — inherits STATE
- City
- — inherits STATE
ZIP-level market 60913
- Home prices YoY
- -17.7%
- Active inventory
- 7
- Price-to-rent
- 9.2×
Monthly cashflow live
- Estimated rent
- $1,083 medium interval (Pro) →
- Mortgage (P&I)
- −$629
- Tax from tax record
- −$117 /mo · $1,405/yr
- Insurance
- −$50
- HOA
- −$0
- Vacancy / Maint / Mgmt
- −$227
- Net cashflow
- $60
Break-even live
Sensitivity live
| Price | -10% $128 | -5% $94 | +0% $60 | +5% $26 | +10% $-8 |
|---|---|---|---|---|---|
| Rent | -10% $-26 | -5% $17 | +0% $60 | +5% $102 | +10% $145 |
| Rate | -1.0pp $120 | -0.5pp $90 | base $60 | +0.5pp $29 | +1.0pp $-3 |
UW: 25.0% down · 7.5% · 30yr · 1.5% tax · 5.0% vac · 8.0% maint · 8.0% mgmt
Financing live
Cash to close
- Down payment
- $29,975
- Closing costs
- $3,597
- Reserves months
- —
- Total cash needed
- —
Loan-product check · same deal, 3 products live
Conventional
25% down · 7.5% · 30yr
- Down + closing
- —
- Monthly P&I
- —
- Monthly cashflow
- —
- DSCR
- —
- Eligible?
- —
Personal DTI + credit; lowest rate.
DSCR
20% down · 8.5% · 30yr
- Down + closing
- —
- Monthly P&I
- —
- Monthly cashflow
- —
- DSCR
- —
- Eligible?
- —
No personal income docs; deal must DSCR.
Hard money
10% down · 12.0% · 12mo
- Down + closing
- —
- Monthly P&I
- —
- Monthly cashflow
- —
- DSCR
- —
- Eligible?
- —
Short-term bridge; refi at stabilization.
Listing history 6 events
-
2026-06-02status $119,900 Pending 11 DOM
-
2026-06-01days on market $119,900 Active 11 DOM
-
2026-05-31days on market $119,900 Active 10 DOM
-
2026-05-30days on market $119,900 Active 9 DOM
-
2026-05-21price $119,900
-
2016-06-22soldstatus $58,000
ⓘ Source: listings_history table (triggers on properties + properties_extension) + one-shot
backfill from property_details.listing_events for pre-trigger history.
Tax reassessment forecast IL · Partial reset (capped growth)
- Current annual tax
- $1,405 · $117/mo
- Projected year-2 tax
- $2,063 · $172/mo
- Expected delta
- +$658/yr (+$55/mo · 46.9%)
ⓘ Screening estimate from a state-policy table — verify with the county assessor before closing.
Climate risk First Street
- Flood 1/10 Low FEMA zone X (unshaded) · 0% chance over 30 yrs
- Wildfire 1/10 Low
- Heat 3/10 Moderate 7 d/yr ≥103°F today · 16 d/yr by 30 yrs out
- Wind 2/10 Low 2% chance of damaging wind over 30 yrs
- Air quality 2/10 Low 1 unhealthy d/yr today · 2 by 30 yrs out
Nearby sold comps map
Loading sold comps map…
Walkable amenities ~0.75 mi
Loading nearby amenities…
Taxation est. · year 1
- Rental income
- $12,994
- − Mortgage interest
- −$6,716
- − Property taxes
- −$1,405
- − Insurance
- −$600
- − Repairs & maintenance
- −$1,040
- − Management
- −$1,040
- − Depreciation
- −$3,488
- Taxable loss
- −$1,293
- Est. tax savings @ 24.0%
- +$310
- After-tax cash flow
- $1,026/yr
For passive investors: Depreciation is non-cash, so a rental often shows a tax loss while cash-flowing — sheltering income. Rental losses are passive: they offset passive income freely, and up to $25,000/yr can offset ordinary (W-2) income if you actively participate and your MAGI is under $100k (phasing out to $0 by $150k); unused losses carry forward. On sale, claimed depreciation is recaptured at up to 25%, and gains may owe capital-gains tax (a 1031 exchange can defer both). Figures are a year-1 estimate at your 24.0% rate — not tax advice; consult a CPA.
Schools (NCES district)
- District
- Herscher CUSD 2
- NCES district ID
- 1718840
- Math proficiency
- 32% ▲ 2.00%
- Reading proficiency
- 32% ▼ -10.00%
- Median HH income
- $69,778
- Composite
- 29.76/100
- National rank
- #6435
- State rank
- #202 of 620 in IL
Livability — Bonfield
- Score
- 65/100
- State rank
- #654
- US rank
- #13427
Category grades
Schools grade is shown separately in the Schools card above.
Census & demographics
- City population
- 1,597
- Population (ZIP)
- 1,597
Population outlook (Kankakee County) Hauer SSP2
- Today (2025)
- 105,479 people
- By 2030
- 101,792 · -3.5%
- By 2040
- 93,479 · -11.4%
- By 2050
- 85,061 · -19.4%
- By 2075
- 67,314 · -36.2%
- By 2100
- 52,439 · -50.3%
Race, ethnicity, and origin ACS 2023
- Neighborhood character
- Predominantly White (91%)
- Race & ethnicity
- White 91% Two or more races 5% Hispanic / Latino 2%
- Common ancestry
- Lithuanian 5% Romanian 3% Portuguese 2%
- Languages at home
- 97% English-only · Spanish 3%
Political lean MEDSL · Kankakee
- 2024 margin
- Strong R (+20.8) · D 38.7% · R 59.5% · Other 1.8%
- 2008→2024 swing
- -25.4pp toward R · 2008: 4.6pp · 2024: -20.8pp
- All cycles
- 2024: R+20.8 2020: R+16.5 2016: R+13.3 2012: R+3.4 2008: D+4.6
Not yet ingested
- Civics
- —
Market trends
- HPI YoY
- ▼ -44.11%
- Current HPI
- 205.0994
- Rent YoY
- —
- Metro
- —
- State GDP YoY
- ▲ 1.59%
- F500 in state
- 60
Industry mix (Fortune 500 HQ in IL)
| Industry | F500 HQs | Revenue |
|---|---|---|
| Insurance | 4 | $201B |
|
||
| Consumer Goods | 4 | $87B |
|
||
| Industrial Machinery | 3 | $64B |
|
||
| Healthcare | 2 | $55B |
|
||
| Retail / Pharmacy | 1 | $148B |
|
||
| Agriculture / Food | 1 | $86B |
|
||
Price history
+106.7% since first listed2 events — show timeline
- 2026-05-21 Price Changed $119,900 MRED as Distributed by MLS Grid
- 2016-06-22 Sold (Public Records) $58,000 Public Records
Property tax history
+2.0%/yrLatest (2024): $1,405 · +8.8% YoY. Source: county tax records.
Cash-flow waterfall
monthlySold comps — $/sqft
last 12 mo · ≤1 miLoading sold comps…