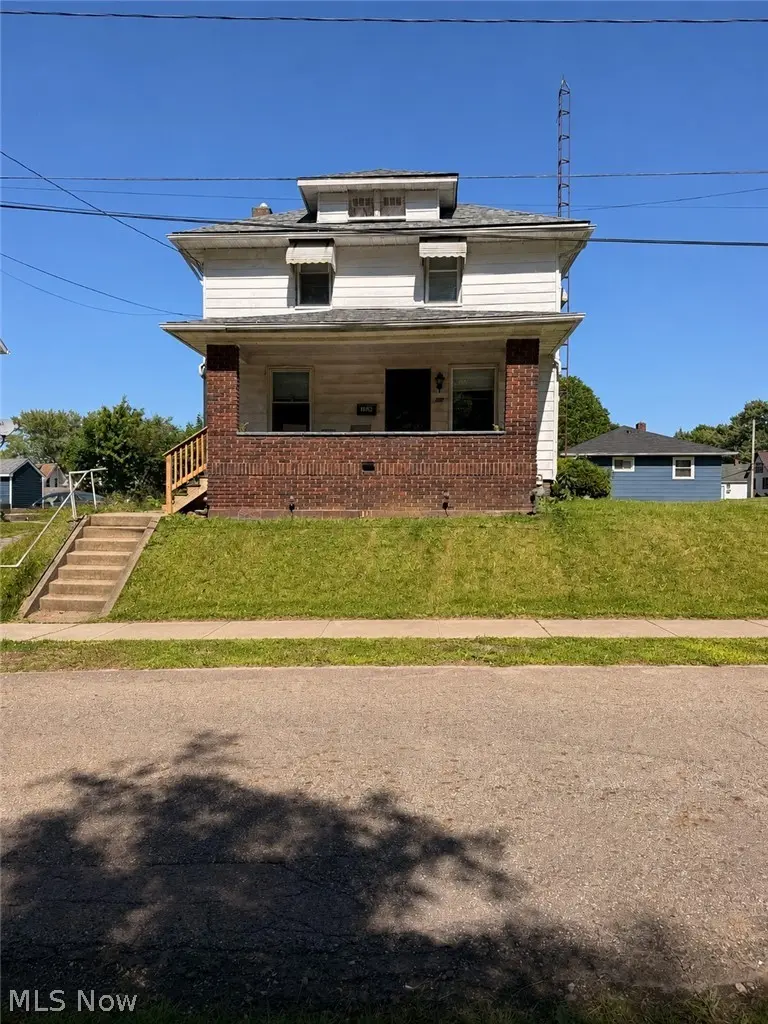
1150 Forest Ave · Alliance, OH
Flood risk 1/10 · Minimal
- FEMA flood zone
- X (unshaded)
- Chance of flooding over 30 yrs
- 0.0%
- Est. flood insurance / yr
- $473 – $860
Fire risk 1/10 · Minimal
- Est. fire insurance / yr
- $713 – $1,323
Heat risk 3/10 · Minor
- Hot days now (above 97°F)
- 7 days/yr
- Hot days in 30 yrs
- 17 days/yr
Wind risk 1/10 · Minimal
- Chance of severe wind over 30 yrs
- —
Air-quality risk 2/10 · Minimal
- Unhealthy air days now
- 1 days/yr
- Unhealthy air days in 30 yrs
- 2 days/yr
Risk factors via First Street. Map © Google.
Why this score? — see what drove the B- grade
The composite is a weighted blend of 9 inputs, each scored 0–100. Each bar is that input's sub-score; the figure is the points it added to the 100-point composite (weight × sub-score).
- Cash flow +26.8/30.0
- ARV discount +15.0/15.0
- DSCR +9.2/10.0
- 1% rule +6.5/10.0
- Livability +3.9/5.0
- Schools +3.5/10.0
- Rent growth +2.5/5.0
- Condition / age +2.5/5.0
- Appreciation +0.0/10.0
$79,500
🖨 Deal sheet (PDF) 📄 Offer letter ✓ Due diligence
Listing remarks MLS
Why rent when you can own for less!! Welcome to this spacious 2 bedroom, 1 bath colonial home that is move in ready and a blank canvas to make your own. Featuring central air and mostly all replacement windows. Updates include kitchen, flooring throughout and bathroom. Looks bigger than pictures. So close to shopping, restaurants and more, don't miss this one to add to your portfolio. Selling AS-IS.
Key facts
- Newer vinyl windows
- Key updates
- Central air
Tags
Property features AI
Finance
- Other: Above-grade finished area 912 (per assessor); Lot size approximately 0.0478 acres
Exterior
- Parking: On-street parking
- Utilities: Public water; Public sewer
- Home design: Two-story house; Aluminum siding; Asphalt/fiberglass roof; Block foundation
- Construction: Built (year per public records); Aluminum siding; Asphalt/Fiberglass roof; Block foundation
- Exterior features: Covered front porch
Interior
- Kitchen: Range; Refrigerator
- Bedrooms: Two second-floor bedrooms (both carpeted)
- Flooring: Carpet (bedrooms and living room)
- Bathrooms: One full bathroom (located on second floor)
- Heating & cooling: Central air conditioning; Forced air heating (gas)
- Interior features: Double-pane windows; Ceiling fan(s); Has basement
- Laundry & utility: Washer and dryer in basement
Neighborhood map
What this means for you Summary
Snapshot
- This is a 2-bed/1.0-bath single-family listed at $80k.
Deal economics
- At list price, monthly cash flow is $219 ($3k/yr) — positive.
- The deal already cash-flows at list — no discount required.
- Meets the 1% rule at list price ($914 rent vs $80k).
- Recommended offer: $78k (1.5% below list) — sets the bar for market timing.
- Cap rate 9.6% vs local median 4.8% in Alliance — top-decile yield for the area; either an underpriced asset or a hidden risk that comps aren't pricing in. Stress-test before assuming the spread holds.
Location & tenants
- Location reads 78/100 on livability (#175 in OH, #2,737 nationally) — a middle-class / working-renter tenant base. Strengths: commute A+, cost of living A+, housing A+; Watch: amenities F, employment F.
- Alliance City (town): math 39% / reading 45% proficiency, ranked #536 of 656 in OH (top 82%) — families likely to look elsewhere, expect single-tenant / working-renter base with shorter leases; 71% free/reduced lunch — lower-income household profile, screen leases tightly.
- Zoned schools: Alliance Elementary School At Rockhill (math 47% / reading 47%, grade D-, #942 of 1,584 statewide, top 61%, 407 students, 0% FRL); Alliance Middle School (math 33% / reading 40%, grade F, #539 of 654 statewide, top 83%, 602 students, 0% FRL); Alliance High School (math 22% / reading 45%, grade F, #598 of 781 statewide, top 77%, 973 students, 0% FRL) — zoned schools average 0% FRL vs 71% district-wide (71 pts lower); this property's tenant base skews higher-income than the district average.
- Market conditions: 168 active listings in the ZIP; 6 comparable units currently listed for rent nearby; rentals at typical pace (median 15d on market — plan ~3-4 weeks tenant-placement turnaround); 528 units permitted in Stark County in 2024 (84 in 5+ unit buildings).
- This rent is only 18% of the median local income ($62k/yr) — well below the 30% rent-burden line; pricing power to push rent on renewal without tenant pushback.
Forward outlook
- Local home prices are declining (-3.0%/yr); year-one equity from $550 of loan paydown is wiped out by about $2k of value loss. Plan a longer hold.
- Stark County population projected to shrink 8% by 2050 — rents likely to lag national; underwrite the cash flow, not the appreciation.
- At projected returns (-3.0% appreciation + 3.0% rent growth), your $22k cash investment doubles in ~10 years — after that, you're playing with house money.
Negotiation context
- It's been on market 17 days — a 2% lower offer ($78k) is reasonable based on typical stale-listing flexibility.
- 2 sale attempts since 4y ago; this cycle's ask has dropped $8k (10%) from the opening price — seller is motivated, your offer sets the floor, not the list.
- Current owner paid $56k; 42% above their basis — modest negotiation headroom, anchor on the comps not their cost.
Risks & watch-outs
- Watch-outs: built in 1916 — expect roof / HVAC / electrical / plumbing capex.
Questions for the listing agent
- Built in 1916 — when were the roof, HVAC, electrical panel, plumbing, and water heater last replaced?
- Is there a deadline driving the sale (1031 exchange, divorce, estate, relocation)? That informs how much negotiation room exists.
- Schools are B-rated — typically a magnet for longer-tenancy family renters. What's the average tenant stay here, and is there a school-zone premium baked into asking?
- What's the average days-on-market for RENTAL listings here right now (not sales)? A rising rental-DOM trend means longer vacancies and softer asking-rent achievability than the comps imply.
- What's the recent tenant-quality profile in this submarket — average credit score on applications, eviction rate, late-payment / NSF rate, and stable-employment percentage? A property-management company in the area should have these aggregated.
- How much new for-sale + rental construction is in the pipeline within 1–3 miles? Heavy new supply typically softens prices + rents 12–24 months out; constrained supply supports both.
Investment metrics
- 1% rule
- 1.15% ✓
- Cap rate
- 9.59%
- Cash-on-cash
- 11.78%
- DSCR
- 1.52
- GRM
- 7.2
CMA / ARV
- ARV (on-the-fly)
- $100,320
- Comps found
- 10
Show comp detail 10 sales within ~0.75 mi
| Address | Dist | Beds/Ba | Sqft | Sold | Price | $/sf | Match |
|---|---|---|---|---|---|---|---|
| 1522 Wade Ave | 0.23mi | 2/1.0 | 936 (+3%) | 1mo | $87,500 | $93 | 84 |
| 729 Waugh St | 0.30mi | 2/1.0 | 936 (+3%) | 8mo | $115,000 | $123 | 75 |
| 823 Devine St | 0.34mi | 2/1.0 | 936 (+3%) | 14mo | $129,900 | $139 | 68 |
| 1511 Grace St | 0.33mi | 2/1.5 | 986 (+8%) | 2mo | $78,000 | $79 | 67 |
| 842 Grace St | 0.28mi | 2/1.0 | 936 (+3%) | 20mo | $73,000 | $78 | 66 |
| 1406 Wade Ave | 0.17mi | 2/2.0 | 816 (-10%) | 13mo | $105,000 | $129 | 60 |
| 812 E Summit St | 0.44mi | 2/1.0 | 988 (+8%) | 12mo | $114,900 | $116 | 55 |
| 1745 S Linden Ave | 0.67mi | 3/1.0 (+1) | 866 (-5%) | 5mo | $95,000 | $110 | 51 |
| 22752 Alden Ave | 0.45mi | 2/1.0 | 1,032 (+13%) | 12mo | $52,000 | $50 | 46 |
| 22841 Lake Park Blvd | 0.43mi | 3/1.5 (+1) | 1,040 (+14%) | 12mo | $24,000 | $23 | 39 |
Match score weights: distance 35% · size 25% · config 20% · recency 20%. Top-matched comps best support the ARV.
Projected returns pro-forma
-3.0% appreciation · 3.0% rent growth · sell at horizon
- IRR
- 1.2%
- Equity multiple
- 1.05×
- Total profit
- $1,020
- Equity at exit
- $11,854
- IRR
- 10.8%
- Equity multiple
- 1.84×
- Total profit
- $18,750
- Equity at exit
- $6,874
Cash invested: $22,260 (down + closing). Projections, not guarantees.
Landlord ↔ Tenant lean methodology
- Overall (STATE)
- 73 Landlord-Friendly
- State Ohio
- 73 Landlord-Friendly · R+6
- County
- — inherits STATE
- City
- — inherits STATE
ZIP-level market 44601
- Active inventory
- 168
- Price-to-rent
- 7.2×
Monthly cashflow live
- Estimated rent
- $914 high interval (Pro) →
- Mortgage (P&I)
- −$417
- Tax from tax record
- −$54 /mo · $642/yr
- Insurance
- −$33
- HOA
- −$0
- Vacancy / Maint / Mgmt
- −$192
- Net cashflow
- $219
Break-even live
Sensitivity live
| Price | -10% $264 | -5% $241 | +0% $219 | +5% $196 | +10% $174 |
|---|---|---|---|---|---|
| Rent | -10% $146 | -5% $182 | +0% $219 | +5% $255 | +10% $291 |
| Rate | -1.0pp $259 | -0.5pp $239 | base $219 | +0.5pp $198 | +1.0pp $177 |
UW: 25.0% down · 7.5% · 30yr · 1.5% tax · 5.0% vac · 8.0% maint · 8.0% mgmt
Financing live
Cash to close
- Down payment
- $19,875
- Closing costs
- $2,385
- Reserves months
- —
- Total cash needed
- —
Loan-product check · same deal, 3 products live
Conventional
25% down · 7.5% · 30yr
- Down + closing
- —
- Monthly P&I
- —
- Monthly cashflow
- —
- DSCR
- —
- Eligible?
- —
Personal DTI + credit; lowest rate.
DSCR
20% down · 8.5% · 30yr
- Down + closing
- —
- Monthly P&I
- —
- Monthly cashflow
- —
- DSCR
- —
- Eligible?
- —
No personal income docs; deal must DSCR.
Hard money
10% down · 12.0% · 12mo
- Down + closing
- —
- Monthly P&I
- —
- Monthly cashflow
- —
- DSCR
- —
- Eligible?
- —
Short-term bridge; refi at stabilization.
Rent comps 6 comps
| Address | Beds | Baths | Sqft | Rent | $/sqft | DOM | Units | Dist |
|---|---|---|---|---|---|---|---|---|
| 1329 Auld St Alliance, OH | 2.0 | 2.0 | 900 | $895 | $0.99 | 15d | 1 | 0.11mi |
| 1329 Auld St Unit 1329 Alliance, OH | 2.0 | 2.0 | 900 | $925 | $1.03 | 15d | 1 | 0.11mi |
| 734 Mill Cir Alliance, OH | 1.0–2.0 | 1.0 | 724 | $940 | $1.30 | 15d | 1 | 0.76mi |
| 245 E Main St Alliance, OH | 1.0 | 1.0 | 950 | $900 | $0.95 | 45d | 1 | 1.01mi |
| 245 E Main St Alliance, OH | 1.0 | 1.0 | 850 | $1,025 | $1.21 | 15d | 1 | 1.01mi |
| 199 W Main St Alliance, OH | 2.0 | 1.0 | 600 | $860 | $1.43 | 15d | 1 | 1.33mi |
Listing history 12 events
-
2026-06-22days on market $79,500 Active 17 DOM
-
2026-06-18days on market $79,500 Active 14 DOM
-
2026-06-17days on market $79,500 Active 13 DOM
-
2026-06-16days on market $79,500 Active 12 DOM
-
2026-06-15days on market $79,500 Active 11 DOM
-
2026-06-14days on market $79,500 Active 9 DOM
-
2026-06-13pricedays on market $79,500 Active 8 DOM
-
2026-06-10days on market $88,000 Active 6 DOM
-
2026-06-09days on market $88,000 Active 5 DOM
-
2026-06-08days on market $88,000 Active 4 DOM
-
2026-06-07remarks 699-char remark
-
2026-06-07$88,000 Active 3 DOM
ⓘ Source: listings_history table (triggers on properties + properties_extension) + one-shot
backfill from property_details.listing_events for pre-trigger history.
Tax reassessment forecast OH · Partial reset (capped growth)
- Current annual tax
- $642 · $54/mo
- Projected year-2 tax
- $941 · $78/mo
- Expected delta
- +$299/yr (+$25/mo · 46.6%)
ⓘ Screening estimate from a state-policy table — verify with the county assessor before closing.
Climate risk First Street
- Flood 1/10 Low FEMA zone X (unshaded) · 0% chance over 30 yrs
- Wildfire 1/10 Low
- Heat 3/10 Moderate 7 d/yr ≥97°F today · 17 d/yr by 30 yrs out
- Wind 1/10 Low
- Air quality 2/10 Low 1 unhealthy d/yr today · 2 by 30 yrs out
Nearby sold comps map
Loading sold comps map…
Walkable amenities ~0.75 mi
Loading nearby amenities…
Taxation est. · year 1
- Rental income
- $10,968
- − Mortgage interest
- −$4,453
- − Property taxes
- −$642
- − Insurance
- −$398
- − Repairs & maintenance
- −$877
- − Management
- −$877
- − Depreciation
- −$2,313
- Taxable income
- $1,407
- Est. tax owed @ 24.0%
- −$338
- After-tax cash flow
- $2,284/yr
For passive investors: Depreciation is non-cash, so a rental often shows a tax loss while cash-flowing — sheltering income. Rental losses are passive: they offset passive income freely, and up to $25,000/yr can offset ordinary (W-2) income if you actively participate and your MAGI is under $100k (phasing out to $0 by $150k); unused losses carry forward. On sale, claimed depreciation is recaptured at up to 25%, and gains may owe capital-gains tax (a 1031 exchange can defer both). Figures are a year-1 estimate at your 24.0% rate — not tax advice; consult a CPA.
Schools (NCES district)
- District
- Alliance City
- NCES district ID
- 3904349
- Math proficiency
- 39% ▼ -9.00%
- Reading proficiency
- 45% ▼ -5.00%
- Median HH income
- $33,326
- Composite
- 34.54/100
- National rank
- #5176
- State rank
- #536 of 656 in OH
Livability — Alliance
- Score
- 78/100
- State rank
- #175
- US rank
- #2737
Category grades
Schools grade is shown separately in the Schools card above.
Census & demographics
- Census place
- Alliance, OH
- County
- Stark County · 272,865 people
- City population
- 32,696
- Metro
- Canton-Massillon, OH
- Population (ZIP)
- 32,696
- Household income
- $61,965
- Rent vs Own
- Severe rent burden
- 780.0
Population outlook (Stark County) Hauer SSP2
- Today (2025)
- 373,708 people
- By 2030
- 371,245 · -0.7%
- By 2040
- 361,331 · -3.3%
- By 2050
- 345,290 · -7.6%
- By 2075
- 302,669 · -19.0%
- By 2100
- 238,870 · -36.1%
Race, ethnicity, and origin ACS 2023
- Neighborhood character
- Predominantly White (87%)
- Race & ethnicity
- White 87% Black 6% Two or more races 5% Hispanic / Latino 1%
- Common ancestry
- Italian 3% Lithuanian 2% Slovak 2%
- Foreign-born
- 1%
- Languages at home
- 98% English-only · Spanish 1%
Political lean MEDSL · Stark
- 2024 margin
- Strong R (+21.9) · D 38.6% · R 60.5%
- 2008→2024 swing
- -27.4pp toward R · 2008: 5.5pp · 2024: -21.9pp
- All cycles
- 2024: R+21.9 2020: R+18.5 2016: R+17.4 2012: R+0.4 2008: D+5.5
Not yet ingested
- Civics
- —
Market trends
- HPI YoY
- ▼ -174.62%
- Current HPI
- 224.9507
- Rent YoY
- —
- Metro
- Canton-Massillon, OH
- State GDP YoY
- ▲ 1.98%
- F500 in state
- 48
Industry mix (Fortune 500 HQ in OH)
| Industry | F500 HQs | Revenue |
|---|---|---|
| Insurance | 3 | $145B |
|
||
| Industrial Machinery | 3 | $49B |
|
||
| Financial Services | 3 | $24B |
|
||
| Consumer Goods | 2 | $93B |
|
||
| Aerospace / Defense | 2 | $47B |
|
||
| Utilities | 2 | $33B |
|
||
Price history
+960.2% since first listed12 events — show timeline
- 2026-06-04 Listed $88,000 MLSNOW
- 2022-12-05 Pending — MLSNOW
- 2022-12-01 Sold (Public Records) $56,000 Public Records
- 2022-12-01 Sold (MLS) $56,000 MLSNOW
- 2022-11-01 Contingent — MLSNOW
- 2022-09-21 Price Changed $69,500 MLSNOW
- 2022-09-05 Price Changed $72,500 MLSNOW
- 2022-08-19 Listed $77,500 MLSNOW
- 2017-09-11 Sold (Public Records) $20,000 Public Records
- 1990-01-17 Sold (Public Records) $8,000 Public Records
- 1987-03-16 Sold (Public Records) $5,600 Public Records
- 1987-02-23 Sold (Public Records) $8,300 Public Records
Property tax history
+8.3%/yrLatest (2024): $642 · +0.6% YoY. Source: county tax records.
Cash-flow waterfall
monthlySold comps — $/sqft
last 12 mo · ≤1 miLoading sold comps…