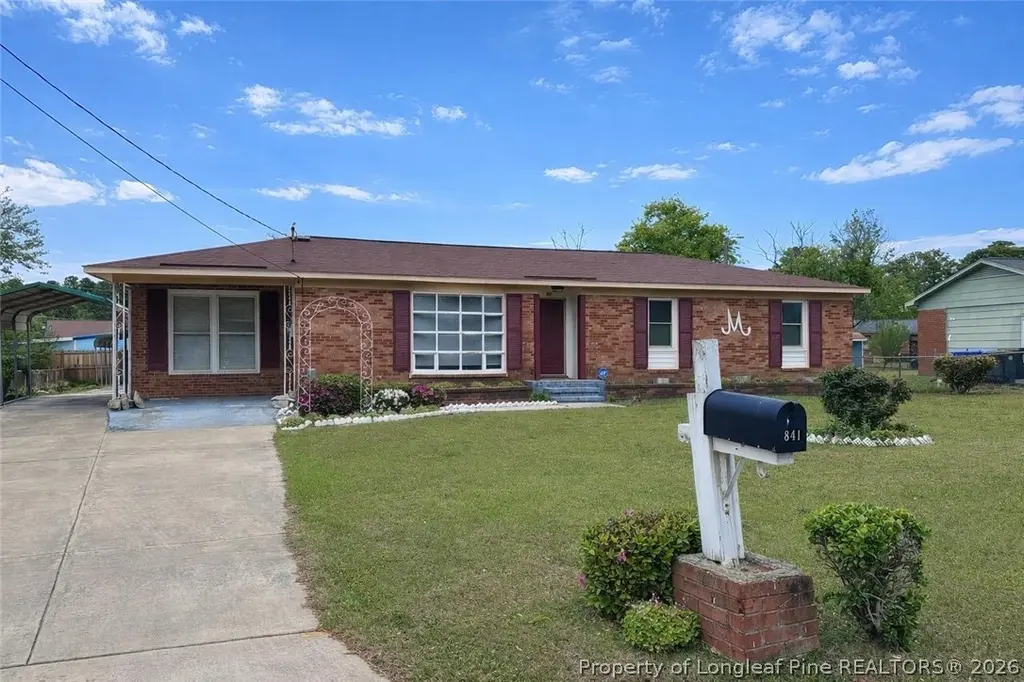
841 Fresno Dr · Fayetteville, NC
Flood risk 1/10 · Minimal
- FEMA flood zone
- X (unshaded)
- Chance of flooding over 30 yrs
- 0.0%
- Est. flood insurance / yr
- $473 – $860
Fire risk 1/10 · Minimal
- Est. fire insurance / yr
- $906 – $1,684
Heat risk 7/10 · Major
- Hot days now (above 106°F)
- 7 days/yr
- Hot days in 30 yrs
- 16 days/yr
Wind risk 7/10 · Major
- Chance of severe wind over 30 yrs
- 78.0%
Air-quality risk 2/10 · Minimal
- Unhealthy air days now
- 0 days/yr
- Unhealthy air days in 30 yrs
- 1 days/yr
Risk factors via First Street. Map © Google.
Why this score? — see what drove the D+ grade
The composite is a weighted blend of 9 inputs, each scored 0–100. Each bar is that input's sub-score; the figure is the points it added to the 100-point composite (weight × sub-score).
- ARV discount +13.8/15.0
- Cash flow +12.0/30.0
- Livability +3.8/5.0
- DSCR +3.5/10.0
- 1% rule +3.3/10.0
- Rent growth +3.3/5.0
- Schools +3.1/10.0
- Condition / age +2.5/5.0
- Appreciation +0.0/10.0
$180,000
🖨 Deal sheet (PDF) 📄 Offer letter ✓ Due diligence
Listing remarks
Welcome to 841 Fresno Drive in Fayetteville, NC—a 3 bedroom, 3 bathroom property with over 1,600 square feet of potential. Whether you're an investor looking to maximize returns or a buyer eager to build equity through improvements, with a little TLC and vision, this home is a perfect opportunity. Outside, you'll find multiple carports providing ample covered parking, along with a spacious backyard shed—perfect for storage, a workshop, or additional utility space. Conveniently located just minutes from Fort Bragg, as well as a variety of shopping and dining options, this home combines location and opportunity. With the right updates, this property will truly shine! Don’t m
Key facts
- Multiple carports
- 3 parking spots
- Built 1972
Tags
Neighborhood map
What this means for you Summary
Snapshot
- This is a 3-bed/2.0-bath single-family listed at $180k.
Deal economics
- At list price, monthly cash flow is $-43 ($-511/yr) — negative.
- To cash-flow at today's rent, offer at most $172k (4.2% below list).
- To meet the 1% rule (rent ≥ 1% of price), the offer needs to be $150k (16.6% below list).
- Recommended offer: $150k (16.6% below list) — sets the bar for 1% rule.
- Cap rate 6.0% vs local median 4.8% in Fayetteville — meaningfully above typical; check what's discounted (condition, days-on-market, listing class) to confirm the premium yield is real.
Location & tenants
- Location reads 75/100 on livability (#45 in NC, #4,031 nationally) — a middle-class / working-renter tenant base. Strengths: commute A+, cost of living A+, housing A+; Watch: crime F, employment D-.
- Cumberland County Schools (urban): math 32% / reading 41% proficiency, ranked #126 of 178 in NC (top 71%) — families likely to look elsewhere, expect single-tenant / working-renter base with shorter leases.
- Zoned schools: Ponderosa Elementary (math 17% / reading 22%, grade F, #1,242 of 1,410 statewide, top 90%, 366 students, 99% FRL); Westover Middle (math 20% / reading 30%, grade F, #396 of 475 statewide, top 84%, 784 students, 100% FRL); Westover High (math 42% / reading 39%, grade F, #387 of 535 statewide, top 73%, 1,202 students, 100% FRL) — zoned schools average 100% FRL vs 55% district-wide (45 pts higher); higher-poverty schools than district average — tighter screening recommended.
- Market conditions: Rents rising (+3.0%/yr); 285 active listings in the ZIP; 40 comparable units currently listed for rent nearby; rentals at typical pace (median 26d on market — plan ~3-4 weeks tenant-placement turnaround); 1,125 units permitted in Cumberland County in 2024 (104 in 5+ unit buildings).
- This rent runs 31% of the median local income ($58k/yr) — at the standard rent-burdened threshold; future hikes will face affordability resistance.
Forward outlook
- Local home prices are declining (-3.0%/yr); year-one equity from $1k of loan paydown is wiped out by about $5k of value loss. Plan a longer hold.
Negotiation context
- Only 10 days on market — expect competitive offers; lowballing is unlikely to land.
- Current owner paid $155k; 16% above their basis — modest negotiation headroom, anchor on the comps not their cost.
Risks & watch-outs
- Climate carrying-cost: major wind risk, 78% chance of damaging wind over 30y; extreme-heat days projected 7→16/yr by 2055 (HVAC capex compounding) — expect insurance premiums to compound above CPI over the hold.
Questions for the listing agent
- What do current leases actually rent for vs. the listed asking? Can we see a recent rent roll and the last 12 months of T-12 income?
- Built in 1972 — when were the roof, HVAC, electrical panel, plumbing, and water heater last replaced?
- Is there a deadline driving the sale (1031 exchange, divorce, estate, relocation)? That informs how much negotiation room exists.
- Crime grade is F in this area — have there been break-ins, vandalism, or insurance claims at this property in the last 3 years? What carrier currently insures it and at what premium?
- The area grade is low — what's the realistic commute time and amenity access for the typical tenant pool here? Any planned neighborhood developments (good or bad) we should know about?
- What's the average days-on-market for RENTAL listings here right now (not sales)? A rising rental-DOM trend means longer vacancies and softer asking-rent achievability than the comps imply.
- What's the recent tenant-quality profile in this submarket — average credit score on applications, eviction rate, late-payment / NSF rate, and stable-employment percentage? A property-management company in the area should have these aggregated.
- How much new for-sale + rental construction is in the pipeline within 1–3 miles? Heavy new supply typically softens prices + rents 12–24 months out; constrained supply supports both.
Investment metrics
- 1% rule
- 0.83% ✗
- Cap rate
- 6.01%
- Cash-on-cash
- -1.01%
- DSCR
- 0.95
- GRM
- 10.0
CMA / ARV
- ARV (on-the-fly)
- $209,562
- Comps found
- 12
Show comp detail 12 sales within ~0.75 mi
| Address | Dist | Beds/Ba | Sqft | Sold | Price | $/sf | Match |
|---|---|---|---|---|---|---|---|
| 843 Bedrock Dr | 0.03mi | 3/2.0 | 1,370 (+4%) | 1mo | $180,000 | $131 | 91 |
| 301 Summer Hill Rd | 0.45mi | 3/2.0 | 1,316 (-0%) | 3mo | $217,900 | $166 | 77 |
| 714 Bronco Ln | 0.29mi | 3/1.5 | 1,380 (+5%) | 0mo | $199,900 | $145 | 76 |
| 814 Maverick Ct | 0.06mi | 3/1.5 | 1,188 (-10%) | 7mo | $177,500 | $149 | 73 |
| 5512 Mesa Dr | 0.61mi | 3/2.0 | 1,328 (+1%) | 3mo | $140,000 | $105 | 68 |
| 342 Summer Hill Rd | 0.47mi | 3/1.5 | 1,409 (+7%) | 2mo | $210,000 | $149 | 63 |
| 834 Abilene Rd | 0.28mi | 4/2.0 (+1) | 1,476 (+12%) | 3mo | $235,000 | $159 | 60 |
| 5701 Comstock Ct | 0.61mi | 3/2.0 | 1,400 (+6%) | 6mo | $227,500 | $163 | 56 |
| 284 Bonanza Dr | 0.53mi | 3/1.5 | 1,164 (-12%) | 1mo | $184,800 | $159 | 53 |
| 6345 Hawfield Dr | 0.69mi | 3/2.0 | 1,230 (-7%) | 6mo | $201,000 | $163 | 51 |
| 321 Summer Hill Rd | 0.47mi | 4/2.0 (+1) | 1,482 (+12%) | 3mo | $215,000 | $145 | 50 |
| 524 Killeen Rd | 0.72mi | 3/2.0 | 1,473 (+12%) | 1mo | $262,000 | $178 | 46 |
Match score weights: distance 35% · size 25% · config 20% · recency 20%. Top-matched comps best support the ARV.
Projected returns pro-forma
-3.0% appreciation · 3.01% rent growth · sell at horizon
- IRR
- -17.9%
- Equity multiple
- 0.37×
- Total profit
- $-31,853
- Equity at exit
- $26,839
- IRR
- -10.1%
- Equity multiple
- 0.38×
- Total profit
- $-31,116
- Equity at exit
- $15,563
Cash invested: $50,400 (down + closing). Projections, not guarantees.
Landlord ↔ Tenant lean methodology
- Overall (STATE)
- 85 Strongly Landlord-Friendly
- State North Carolina
- 85 Strongly Landlord-Friendly · R+3
- County
- — inherits STATE
- City
- — inherits STATE
ZIP-level market 28303
- Home prices YoY
- -25.4%
- Rents YoY
- 3.0%
- Active inventory
- 285
- Price-to-rent
- 10.0×
Monthly cashflow live
- Estimated rent
- $1,501 high interval (Pro) →
- Mortgage (P&I)
- −$944
- Tax from tax record
- −$209 /mo · $2,510/yr
- Insurance
- −$75
- HOA
- −$0
- Vacancy / Maint / Mgmt
- −$315
- Net cashflow
- $-43
Break-even live
Sensitivity live
| Price | -10% $59 | -5% $8 | +0% $-43 | +5% $-94 | +10% $-144 |
|---|---|---|---|---|---|
| Rent | -10% $-161 | -5% $-102 | +0% $-43 | +5% $17 | +10% $76 |
| Rate | -1.0pp $48 | -0.5pp $3 | base $-43 | +0.5pp $-89 | +1.0pp $-137 |
UW: 25.0% down · 7.5% · 30yr · 1.5% tax · 5.0% vac · 8.0% maint · 8.0% mgmt
Financing live
Cash to close
- Down payment
- $45,000
- Closing costs
- $5,400
- Reserves months
- —
- Total cash needed
- —
Loan-product check · same deal, 3 products live
Conventional
25% down · 7.5% · 30yr
- Down + closing
- —
- Monthly P&I
- —
- Monthly cashflow
- —
- DSCR
- —
- Eligible?
- —
Personal DTI + credit; lowest rate.
DSCR
20% down · 8.5% · 30yr
- Down + closing
- —
- Monthly P&I
- —
- Monthly cashflow
- —
- DSCR
- —
- Eligible?
- —
No personal income docs; deal must DSCR.
Hard money
10% down · 12.0% · 12mo
- Down + closing
- —
- Monthly P&I
- —
- Monthly cashflow
- —
- DSCR
- —
- Eligible?
- —
Short-term bridge; refi at stabilization.
Rent comps 40 comps
| Address | Beds | Baths | Sqft | Rent | $/sqft | DOM | Units | Dist |
|---|---|---|---|---|---|---|---|---|
| 833 Fresno Dr Fayetteville, NC | 3.0 | 1.5 | 1512 | $1,300 | $0.86 | 25d | 1 | 0.04mi |
| 6033 Santa Fe Dr Fayetteville, NC | 3.0 | 1.5 | 1325 | $1,500 | $1.13 | 25d | 1 | 0.21mi |
| 890 Bedrock Dr Fayetteville, NC | 4.0 | 2.5 | 1484 | $1,650 | $1.11 | 25d | 1 | 0.24mi |
| 6213 Sabine Dr Fayetteville, NC | 3.0 | 1.5 | 1092 | $1,175 | $1.08 | 25d | 1 | 0.33mi |
| 338 Summer Hill Rd Fayetteville, NC | 4.0 | 2.0 | 1474 | $1,550 | $1.05 | 25d | 1 | 0.47mi |
| 390 Summer Hill Rd Fayetteville, NC | 3.0 | 2.5 | 1535 | $1,990 | $1.30 | 25d | 1 | 0.65mi |
| 425 Dunmore Rd Fayetteville, NC | 3.0 | 2.0 | 1724 | $1,800 | $1.04 | 25d | 1 | 0.66mi |
| 3639 Dornoch Dr Fayetteville, NC | 2.0 | 2.0 | 1000 | $1,025 | $1.02 | 25d | 1 | 0.71mi |
| 3633 Dornoch Dr Apt E Fayetteville, NC | 2.0 | 2.0 | 1000 | $1,025 | $1.02 | 25d | 1 | 0.73mi |
| 513 Roundtree Dr Fayetteville, NC | 3.0 | 2.0 | 1337 | $1,775 | $1.33 | 25d | 1 | 0.74mi |
| 3627 Dornoch Dr Apt A Fayetteville, NC | 2.0 | 2.0 | 1000 | $1,025 | $1.02 | 25d | 1 | 0.75mi |
| 3627 Dornoch Dr Apt E Fayetteville, NC | 2.0 | 2.0 | 1000 | $950 | $0.95 | 25d | 1 | 0.75mi |
| 3619 Dornoch Dr Apt A Fayetteville, NC | 2.0 | 2.0 | 1000 | $1,025 | $1.02 | 16d | 1 | 0.78mi |
| 726 Windy Hill Cir Unit 726-C Fayetteville, NC | 2.0 | 1.5 | 1100 | $1,099 | $1.00 | 25d | 1 | 0.79mi |
| 5408 Cardigan Ct Fayetteville, NC | 4.0 | 2.0 | 1700 | $1,800 | $1.06 | 25d | 1 | 0.79mi |
| 709 Windy Hill Cir Unit 709-D Fayetteville, NC | 2.0 | 1.5 | 1100 | $1,099 | $1.00 | 25d | 1 | 0.81mi |
| 716 Windy Hill Cir Unit 716-A Fayetteville, NC | 2.0 | 1.5 | 1100 | $1,025 | $0.93 | 25d | 1 | 0.85mi |
| 718 Windy Hill Cir Unit 718-B Fayetteville, NC | 2.0 | 1.5 | 1100 | $1,099 | $1.00 | 16d | 1 | 0.85mi |
| 5414 Plateau Rd Fayetteville, NC | 3.0 | 2.0 | 1116 | $1,595 | $1.43 | 25d | 1 | 0.87mi |
| 111 Grande Oaks Dr Fayetteville, NC | 1.0–3.0 | 1.0–2.0 | 1205 | $1,645 | $1.37 | 16d | 46 | 0.92mi |
| 422 Jamestown Ave Fayetteville, NC | 3.0 | 2.5 | 1409 | $1,650 | $1.17 | 16d | 1 | 0.92mi |
| 422 Jamestown Ave Fayetteville, NC | 3.0 | 2.5 | 1409 | $2,000 | $1.42 | 25d | 1 | 0.92mi |
| 6471 Yadkin Rd Fayetteville, NC | 2.0 | 1.5 | 900 | $750 | $0.83 | 25d | 1 | 0.92mi |
| 6467 Yadkin Rd Fayetteville, NC | 2.0 | 1.5 | 900 | $850 | $0.94 | 25d | 1 | 0.94mi |
| 5410 Laramie Ct Fayetteville, NC | 3.0 | 2.0 | 1446 | $1,600 | $1.11 | 16d | 1 | 0.96mi |
| 5650 Netherfield Pl Fayetteville, NC | 1.0–3.0 | 1.0–2.0 | 1025 | $1,410 | $1.37 | 16d | 38 | 0.97mi |
| 1429 Bozeman Loop Fayetteville, NC | 1.0–3.0 | 1.0–2.0 | 1001 | $1,500 | $1.50 | 16d | 24 | 1.01mi |
| 246 Partners Way Fayetteville, NC | 2.0 | 2.0 | 1100 | $1,295 | $1.18 | 25d | 1 | 1.02mi |
| 230 Sawtooth Dr Fayetteville, NC | 1.0–3.0 | 1.0–2.0 | 1040 | $1,550 | $1.49 | 16d | 14 | 1.05mi |
| 824 Danish Dr Fayetteville, NC | 3.0 | 2.5 | 1310 | $1,400 | $1.07 | 25d | 1 | 1.05mi |
| 3050 Plantation Garden Blvd Fayetteville, NC | 1.0–3.0 | 1.0–2.0 | 1158 | $1,781 | $1.54 | 16d | 58 | 1.10mi |
| 6445 Independence Pl Dr Fayetteville, NC | 1.0–3.0 | 1.0–3.0 | 1106 | $1,779 | $1.61 | 16d | 18 | 1.11mi |
| 643 Wakefield Dr Fayetteville, NC | 3.0 | 2.0 | 1794 | $1,575 | $0.88 | 16d | 1 | 1.12mi |
| 7115 Enfield Dr Fayetteville, NC | 3.0 | 2.0 | 1700 | $1,500 | $0.88 | 23d | 1 | 1.13mi |
| 307 Family Lodge Dr Unit 5 Fayetteville, NC | 2.0 | 2.5 | 1200 | $1,100 | $0.92 | 16d | 1 | 1.15mi |
| 6466 Kelmscot Ct Fayetteville, NC | 3.0 | 3.0 | 1409 | $1,635 | $1.16 | 25d | 1 | 1.16mi |
| 1000 Antietam Crk Dr Fayetteville, NC | 3.0 | 1.0–2.0 | 1059 | $1,700 | $1.61 | 25d | 14 | 1.18mi |
| 6510 Cissna Dr Fayetteville, NC | 3.0 | 1.5 | 1100 | $1,095 | $1.00 | 16d | 1 | 1.20mi |
| 513 Lumberly Ln Fayetteville, NC | 2.0 | 2.0 | 1124 | $1,295 | $1.15 | 25d | 1 | 1.23mi |
| 7176 Fillyaw Rd Fayetteville, NC | 2.0 | 2.0 | 900 | $925 | $1.03 | 25d | 1 | 1.23mi |
Listing history 3 events
-
2026-05-05soldstatus $155,000
-
2026-04-17status Pending
-
2026-04-07$180,000 Active
ⓘ Source: listings_history table (triggers on properties + properties_extension) + one-shot
backfill from property_details.listing_events for pre-trigger history.
Tax reassessment forecast NC · Resets to sale price
- Current annual tax
- $2,510 · $209/mo
- Projected year-2 tax
- $2,510 · $209/mo
- Expected delta
- $0/yr ($0/mo · 0.0%)
ⓘ Screening estimate from a state-policy table — verify with the county assessor before closing.
Climate risk First Street
- Flood 1/10 Low FEMA zone X (unshaded) · 0% chance over 30 yrs
- Wildfire 1/10 Low
- Heat 7/10 Severe 7 d/yr ≥106°F today · 16 d/yr by 30 yrs out
- Wind 7/10 Severe 78% chance of damaging wind over 30 yrs
- Air quality 2/10 Low 0 unhealthy d/yr today · 1 by 30 yrs out
Nearby sold comps map
Loading sold comps map…
Walkable amenities ~0.75 mi
Loading nearby amenities…
Taxation est. · year 1
- Rental income
- $18,008
- − Mortgage interest
- −$10,083
- − Property taxes
- −$2,510
- − Insurance
- −$900
- − Repairs & maintenance
- −$1,441
- − Management
- −$1,441
- − Depreciation
- −$5,236
- Taxable loss
- −$3,603
- Est. tax savings @ 24.0%
- +$865
- After-tax cash flow
- $353/yr
For passive investors: Depreciation is non-cash, so a rental often shows a tax loss while cash-flowing — sheltering income. Rental losses are passive: they offset passive income freely, and up to $25,000/yr can offset ordinary (W-2) income if you actively participate and your MAGI is under $100k (phasing out to $0 by $150k); unused losses carry forward. On sale, claimed depreciation is recaptured at up to 25%, and gains may owe capital-gains tax (a 1031 exchange can defer both). Figures are a year-1 estimate at your 24.0% rate — not tax advice; consult a CPA.
Schools (NCES district)
- District
- Cumberland County Schools
- NCES district ID
- 3700011
- Math proficiency
- 32% ▼ -2.00%
- Reading proficiency
- 41% ▼ -1.00%
- Median HH income
- $44,168
- Composite
- 31.0/100
- National rank
- #6096
- State rank
- #126 of 178 in NC
Livability — Fayetteville
- Score
- 75/100
- State rank
- #45
- US rank
- #4031
Category grades
Schools grade is shown separately in the Schools card above.
Census & demographics
- Census place
- Fayetteville, NC
- County
- Cumberland County · 265,314 people
- City population
- 226,118
- Metro
- Fayetteville, NC
- Population (ZIP)
- 30,965
- Household income
- $58,223
- Rent vs Own
- Severe rent burden
- 1370.0
Population outlook (Cumberland County) Hauer SSP2
- Today (2025)
- 330,855 people
- By 2030
- 333,523 · +0.8%
- By 2040
- 335,583 · +1.4%
- By 2050
- 335,325 · +1.4%
- By 2075
- 342,853 · +3.6%
- By 2100
- 340,698 · +3.0%
Race, ethnicity, and origin ACS 2023
- Neighborhood character
- Diverse neighborhood (Simpson 0.70)
- Race & ethnicity
- White 39% Black 37% Two or more races 11% Hispanic / Latino 10% Asian 4% Pacific Islander 1%
- Hispanic origin (detail)
- Mexican 2% Puerto Rican 3%
- Common ancestry
- Slovak 3% Serbian 1% Lithuanian 1%
- Foreign-born
- 9% · Canada, South Korea, Vietnam
- Languages at home
- 86% English-only · Spanish 7% Other Asian/Pacific 2% Korean 1%
Political lean MEDSL · Cumberland
- 2024 margin
- D (+13.4) · D 56.1% · R 42.7% · Other 1.2%
- 2008→2024 swing
- -4.3pp toward R · 2008: 17.7pp · 2024: 13.4pp
- All cycles
- 2024: D+13.4 2020: D+16.6 2016: D+16.0 2012: D+19.7 2008: D+17.7
Not yet ingested
- Civics
- —
Market trends
- HPI YoY
- ▼ -77.14%
- Current HPI
- 226.5097
- Rent YoY
- ▲ 3.01%
- Metro
- Fayetteville, NC
- State GDP YoY
- ▲ 3.28%
- F500 in state
- 26
Industry mix (Fortune 500 HQ in NC)
| Industry | F500 HQs | Revenue |
|---|---|---|
| Financial Services | 2 | $213B |
|
||
| Retail | 2 | $95B |
|
||
| Industrial Conglomerate | 1 | $38B |
|
||
| Metals / Steel | 1 | $35B |
|
||
| Utilities | 1 | $30B |
|
||
| Industrial Machinery | 1 | $19B |
|
||
Price history
-13.9% since first listed3 events — show timeline
- 2026-05-05 Sold (Public Records) $155,000 Public Records
- 2026-04-17 Pending — LPRMLS
- 2026-04-07 Listed $180,000 LPRMLS
Property tax history
+5.4%/yrLatest (2025): $2,510 · +36.8% YoY. Source: county tax records.
Cash-flow waterfall
monthlySold comps — $/sqft
last 12 mo · ≤1 miLoading sold comps…