5870 SE 194th St · Inglis, FL
Flood risk 8/10 · Major
- FEMA flood zone
- A
- Chance of flooding over 30 yrs
- 0.93%
- Est. flood insurance / yr
- $1,009 – $1,996
Fire risk 6/10 · Moderate
- Est. fire insurance / yr
- $947 – $1,759
Heat risk 9/10 · Severe
- Hot days now (above 108°F)
- 7 days/yr
- Hot days in 30 yrs
- 25 days/yr
Wind risk 9/10 · Severe
- Chance of severe wind over 30 yrs
- 99.0%
Air-quality risk 1/10 · Minimal
- Unhealthy air days now
- 0 days/yr
- Unhealthy air days in 30 yrs
- 0 days/yr
Risk factors via First Street. Map © Google.
Why this score? — see what drove the B- grade
The composite is a weighted blend of 9 inputs, each scored 0–100. Each bar is that input's sub-score; the figure is the points it added to the 100-point composite (weight × sub-score).
- Cash flow +25.5/30.0
- DSCR +8.4/10.0
- ARV discount +7.5/15.0
- Appreciation +7.0/10.0
- 1% rule +6.4/10.0
- Schools +3.6/10.0
- Livability +3.1/5.0
- Rent growth +2.5/5.0
- Condition / age +2.5/5.0
$99,000
🖨 Deal sheet 📄 Offer letter ✓ Due diligence
Listing remarks
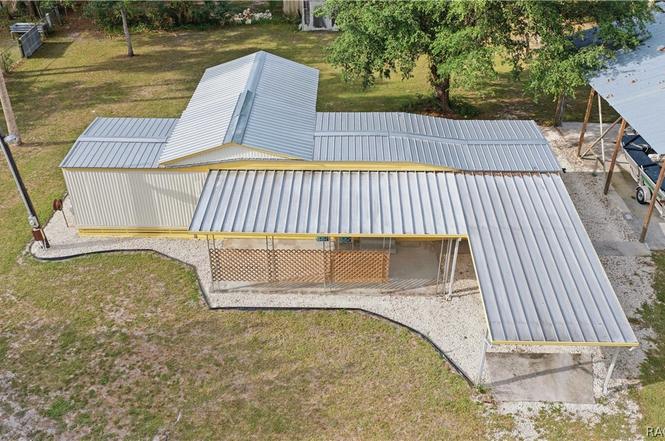
Schedule your appointment right away. This property will not last. Can be a full time resident or weekend getaway. Mobile home on half an acre. New metel roof, new floors, new front and back doors. This is one of the cleanest homes you will ever go in. Huge pole barn. Inglewood Estates has their own water plant. Easy access to boat launches, the Withlacoochee River and the Gulf of Mexico, Withlacoochee Gulf Preserve, Crsytal River, Ocala, Gainesville, The Suncoast Parkway for access to Tampa. Near shopping, dining, doctors, hospital, boating, kayaking and fishing.
Key facts
- New floors
- New metal roof
- Own water plant
Tags
Property features AI
Finance
- Other: Out of county zoning
Exterior
- Parking: Attached carport; Driveway parking; RV access/parking; Unpaved parking available; 1 total parking space
- Utilities: Public water; Septic sewer
- Home design: Manufactured single-wide home; Residential property
- Construction: Aluminum siding
- Exterior features: Metal roof; Storage building; Workshop; Rectangular lot; Paved road access
Interior
- Kitchen: Electric oven; Electric range; Microwave; Refrigerator
- Bedrooms:
- Flooring: Laminate flooring
- Bathrooms: 1 full bathroom
- Heating & cooling: Wall/window air conditioning unit
- Interior features: Drapes and window coverings; Window treatments
- Laundry & utility: Water heater
Neighborhood map
What this means for you Summary
Snapshot
- This is a 2-bed/1.0-bath manufactured listed at $99k.
Deal economics
- At list price, monthly cash flow is $105 ($1k/yr) — positive.
- The deal already cash-flows at list — no discount required.
- Meets the 1% rule at list price ($1k rent vs $99k).
- Cap rate 9.1% vs local median 5.1% in Inglis — top-decile yield for the area; either an underpriced asset or a hidden risk that comps aren't pricing in. Stress-test before assuming the spread holds.
Location & tenants
- Location reads 61/100 on livability (#796 in FL) — a middle-class / working-renter tenant base. Strengths: crime A+, cost of living A+, housing A+; Watch: health & safety C-, amenities F, commute F.
- Levy (rural): math 45% / reading 43% proficiency, ranked #54 of 73 in FL (top 74%) — families likely to look elsewhere, expect single-tenant / working-renter base with shorter leases; 62% free/reduced lunch — lower-income household profile, screen leases tightly.
- Zoned schools: Yankeetown School (math 37% / reading 42%, grade F, #1,513 of 2,144 statewide, top 73%, 265 students, 80% FRL) — zoned schools average 80% FRL vs 62% district-wide (18 pts higher); higher-poverty schools than district average — tighter screening recommended.
- Market conditions: 81 active listings in the ZIP; 199 units permitted in Levy County in 2024 (0 in 5+ unit buildings).
Forward outlook
- In year one you build about $5k of equity ($684 loan paydown + $4k appreciation (4.0% local appreciation)).
- Levy County population projected at -28% by 2050 — secular population decline; favor cash flow + early exit over multi-decade hold.
- At projected returns (4.0% appreciation + 3.0% rent growth), your $28k cash investment doubles in ~5 years — after that, you're playing with house money.
- By year 8, paydown + projected appreciation supports a ~$35k cash-out refi (75% LTV) — recoverable capital for the next deal without selling this one.
Negotiation context
- Only 1 days on market — expect competitive offers; lowballing is unlikely to land.
- 2 sale attempts since 3y ago with the ask held roughly flat each time — persistent listings suggest the price (not the market) is what's stuck; bring a comps-based counter.
Risks & watch-outs
- Watch-outs: flood insurance adds $125/mo.
- Climate carrying-cost: in FEMA flood zone A (mandatory federal flood insurance); severe wind risk, 99% chance of damaging wind over 30y; major wildfire risk; extreme-heat days projected 7→25/yr by 2055 (HVAC capex compounding) — expect insurance premiums to compound above CPI over the hold.
Questions for the listing agent
- Built in 1973 — when were the roof, HVAC, electrical panel, plumbing, and water heater last replaced?
- What's the actual annual flood-insurance premium (NFIP or private), and is the property in a SFHA with mandatory coverage?
- Is there a deadline driving the sale (1031 exchange, divorce, estate, relocation)? That informs how much negotiation room exists.
- Schools are F-rated, which usually means shorter tenancies and higher turnover. Who's the typical renter profile here, and what's been the actual vacancy rate?
- What's the average days-on-market for RENTAL listings here right now (not sales)? A rising rental-DOM trend means longer vacancies and softer asking-rent achievability than the comps imply.
- What's the recent tenant-quality profile in this submarket — average credit score on applications, eviction rate, late-payment / NSF rate, and stable-employment percentage? A property-management company in the area should have these aggregated.
- How much new for-sale + rental construction is in the pipeline within 1–3 miles? Heavy new supply typically softens prices + rents 12–24 months out; constrained supply supports both.
Investment metrics
- 1% rule
- 1.14% ✓
- Cap rate
- 9.08%
- Cash-on-cash
- 9.96%
- DSCR
- 1.44
- GRM
- 7.3
CMA / ARV
No comps found within radius.
Projected returns pro-forma
4.03% appreciation · 3.0% rent growth · sell at horizon
- IRR
- 14.4%
- Equity multiple
- 1.87×
- Total profit
- $24,193
- Equity at exit
- $50,367
- IRR
- 15.6%
- Equity multiple
- 3.54×
- Total profit
- $70,380
- Equity at exit
- $82,517
Cash invested: $27,720 (down + closing). Projections, not guarantees.
Landlord ↔ Tenant lean methodology
- Overall (STATE)
- 87 Strongly Landlord-Friendly
- State Florida
- 87 Strongly Landlord-Friendly · R+3
- County
- — inherits STATE
- City
- — inherits STATE
ZIP-level market 34449
- Home prices YoY
- 1.3%
- Active inventory
- 81
- Price-to-rent
- 7.3×
Monthly cashflow live
- Estimated rent
- $1,132 medium interval (Pro) →
- Mortgage (P&I)
- −$519
- Tax from tax record
- −$104 /mo · $1,243/yr
- Insurance
- −$41
- Flood insurance flood zone
- −$125 /mo · $1,502/yr
- HOA
- −$0
- Vacancy / Maint / Mgmt
- −$238
- Net cashflow
- $105
Break-even live
UW: 25.0% down · 7.5% · 30yr · 1.5% tax · 5.0% vac · 8.0% maint · 8.0% mgmt
Financing live
Cash to close
- Down payment
- $24,750
- Closing costs
- $2,970
- Reserves months
- —
- Total cash needed
- —
Loan-product check · same deal, 3 products live
Conventional
25% down · 7.5% · 30yr
- Down + closing
- —
- Monthly P&I
- —
- Monthly cashflow
- —
- DSCR
- —
- Eligible?
- —
Personal DTI + credit; lowest rate.
DSCR
20% down · 8.5% · 30yr
- Down + closing
- —
- Monthly P&I
- —
- Monthly cashflow
- —
- DSCR
- —
- Eligible?
- —
No personal income docs; deal must DSCR.
Hard money
10% down · 12.0% · 12mo
- Down + closing
- —
- Monthly P&I
- —
- Monthly cashflow
- —
- DSCR
- —
- Eligible?
- —
Short-term bridge; refi at stabilization.
Listing history 2 events
-
2026-06-19remarks 570-char remark
-
2026-06-19$99,000 Active 1 DOM
ⓘ Source: listings_history table (triggers on properties + properties_extension) + one-shot
backfill from property_details.listing_events for pre-trigger history.
Tax reassessment forecast FL · Resets to sale price
- Current annual tax
- $1,243 · $104/mo
- Projected year-2 tax
- $1,243 · $104/mo
- Expected delta
- $0/yr ($0/mo · 0.0%)
ⓘ Screening estimate from a state-policy table — verify with the county assessor before closing.
Climate risk First Street
- Flood 8/10 Severe FEMA zone A · 93% chance over 30 yrs
- Wildfire 6/10 Major
- Heat 9/10 Extreme 7 d/yr ≥108°F today · 25 d/yr by 30 yrs out
- Wind 9/10 Extreme 99% chance of damaging wind over 30 yrs
- Air quality 1/10 Low 0 unhealthy d/yr today · 0 by 30 yrs out
Nearby sold comps map
Loading sold comps map…
Walkable amenities ~0.75 mi
Loading nearby amenities…
Taxation est. · year 1
- Rental income
- $13,583
- − Mortgage interest
- −$5,546
- − Property taxes
- −$1,243
- − Insurance
- −$1,997
- − Repairs & maintenance
- −$1,087
- − Management
- −$1,087
- − Depreciation
- −$2,880
- Taxable loss
- −$257
- Est. tax savings @ 24.0%
- +$62
- After-tax cash flow
- $1,321/yr
For passive investors: Depreciation is non-cash, so a rental often shows a tax loss while cash-flowing — sheltering income. Rental losses are passive: they offset passive income freely, and up to $25,000/yr can offset ordinary (W-2) income if you actively participate and your MAGI is under $100k (phasing out to $0 by $150k); unused losses carry forward. On sale, claimed depreciation is recaptured at up to 25%, and gains may owe capital-gains tax (a 1031 exchange can defer both). Figures are a year-1 estimate at your 24.0% rate — not tax advice; consult a CPA.
Schools (NCES district)
- District
- Levy
- NCES district ID
- 1201140
- Math proficiency
- 45% ▼ -8.00%
- Reading proficiency
- 43% ▼ -3.00%
- Median HH income
- $35,254
- Composite
- 36.42/100
- National rank
- #4673
- State rank
- #54 of 73 in FL
Livability — Inglis
- Score
- 61/100
- State rank
- #796
- US rank
- #18314
Category grades
Schools grade is shown separately in the Schools card above.
Census & demographics
- Population (ZIP)
- 3,508
Population outlook (Levy County) Hauer SSP2
- Today (2025)
- 36,536 people
- By 2030
- 34,498 · -5.6%
- By 2040
- 30,294 · -17.1%
- By 2050
- 26,368 · -27.8%
- By 2075
- 19,003 · -48.0%
- By 2100
- 13,169 · -64.0%
Race, ethnicity, and origin ACS 2023
- Neighborhood character
- Predominantly White (93%)
- Race & ethnicity
- White 93% Two or more races 5% Hispanic / Latino 3%
- Common ancestry
- Lithuanian 2% Slovak 2% Serbian 2%
- Foreign-born
- 2% · Canada, Guatemala
- Languages at home
- 98% English-only · Spanish 2%
Political lean MEDSL · Levy
- 2024 margin
- Solid R (+50.3) · D 24.6% · R 74.8%
- 2008→2024 swing
- -23.3pp toward R · 2008: -26.9pp · 2024: -50.3pp
- All cycles
- 2024: R+50.3 2020: R+45.6 2016: R+44.8 2012: R+32.2 2008: R+26.9
Not yet ingested
- Civics
- —
Market trends
- HPI YoY
- ▲ 4.03%
- Current HPI
- 319.0929
- Rent YoY
- —
- Metro
- —
- State GDP YoY
- ▲ 3.28%
- F500 in state
- 36
Industry mix (Fortune 500 HQ in FL)
| Industry | F500 HQs | Revenue |
|---|---|---|
| Industrial Technology | 2 | $29B |
|
||
| Insurance | 2 | $17B |
|
||
| Retail | 1 | $60B |
|
||
| Technology Distribution | 1 | $58B |
|
||
| Homebuilding | 1 | $35B |
|
||
| Technology Manufacturing | 1 | $35B |
|
||
Price history
+67.8% since first listed3 events — show timeline
- 2026-06-18 Listed $99,000 RACC
- 2023-09-08 Listing Removed — Stellar MLS as Distributed by MLS Grid
- 2023-08-29 Listed $59,000 Stellar MLS as Distributed by MLS Grid
Property tax history
+8.8%/yrLatest (2025): $1,243 · +21.6% YoY. Source: county tax records.
Cash-flow waterfall
monthlySold comps — $/sqft
last 12 mo · ≤1 miLoading sold comps…