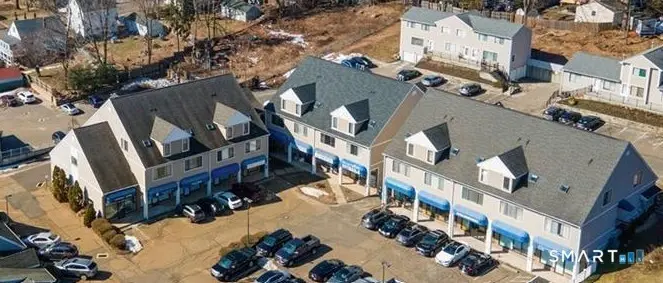
1690 Dixwell Ave #5 · Hamden, CT
Flood risk 1/10 · Minimal
- FEMA flood zone
- X (unshaded)
- Chance of flooding over 30 yrs
- 0.0%
- Est. flood insurance / yr
- $507 – $1,088
Fire risk 1/10 · Minimal
- Est. fire insurance / yr
- $829 – $1,539
Heat risk 7/10 · Major
- Hot days now (above 98°F)
- 7 days/yr
- Hot days in 30 yrs
- 17 days/yr
Wind risk 6/10 · Moderate
- Chance of severe wind over 30 yrs
- 53.0%
Air-quality risk 4/10 · Minor
- Unhealthy air days now
- 4 days/yr
- Unhealthy air days in 30 yrs
- 6 days/yr
Risk factors via First Street. Map © Google.
Why this score? — see what drove the B- grade
The composite is a weighted blend of 9 inputs, each scored 0–100. Each bar is that input's sub-score; the figure is the points it added to the 100-point composite (weight × sub-score).
- Cash flow +25.3/30.0
- ARV discount +14.0/15.0
- DSCR +8.4/10.0
- 1% rule +8.2/10.0
- Condition / age +4.0/5.0
- Rent growth +3.7/5.0
- Schools +3.3/10.0
- Livability +2.5/5.0
- Appreciation +0.0/10.0
$144,900
🖨 Deal sheet 📄 Offer letter ✓ Due diligence
Listing remarks
Unique design, one bedroom loft unit with in unit w/ d, private storage unit, Low HOA fees. In excellent condition near all amenities including SCSU, Quinnipiac and yale Universities, shopping and outdoor activities. 1/2 mile +/- to the entrance of the Merritt Parkway. Renting is allowed. Pets not allowed, agent related to owner.
Key facts
- In unit w d
- Low hoa fees
- Near all amenities
Tags
Property features AI
Finance
- Other: Part of a 32-unit building
- HOA & community: Homeowners association with monthly fee of $178; HOA covers grounds maintenance, trash pickup, snow removal, water, sewer, property management, pest control, and insurance; Professional off-site property management; No pets allowed
Exterior
- Parking: Paved off-street assigned parking (1 space)
- Utilities: Public water; Public sewer; Natural gas
- Home design: Condominium; Condo/Co‑op for sale; Unit with two levels
- Construction: Frame construction
- Exterior features: Vinyl siding; Sloping lot
Interior
- Kitchen: Gas range; Range hood; Refrigerator
- Bedrooms: 1 bedroom (upper level)
- Bathrooms: 1 full bathroom
- Heating & cooling: Central air conditioning; Natural gas hot water; Hot air heating (natural gas)
- Interior features: Pre-wired for cable; Intercom
- Laundry & utility: Stacked washer/dryer in upper-level bathroom
Neighborhood map
What this means for you Summary
Snapshot
- This is a 1-bed/1.0-bath condo listed at $145k. Condition is rated good.
Deal economics
- At list price, monthly cash flow is $331 ($4k/yr) — positive.
- The deal already cash-flows at list — no discount required.
- Meets the 1% rule at list price ($2k rent vs $145k).
- Recommended offer: $141k (3.0% below list) — sets the bar for market timing.
Location & tenants
- Location reads: area grade B — affects rentability + tenant quality, not the cash-flow math above.
- Hamden School District (suburban): math 30% / reading 43% proficiency, ranked #106 of 153 in CT (top 69%) — families likely to look elsewhere, expect single-tenant / working-renter base with shorter leases.
- Zoned schools: Dunbar Hill School (math 17% / reading 27%, grade F, #433 of 553 statewide, top 80%, 272 students, 49% FRL); Hamden High School (math 21% / reading 44%, grade F, #125 of 194 statewide, top 66%, 1,672 students, 39% FRL).
- Market conditions: Rents rising fast (+4.6%/yr); 107 active listings in the ZIP; 12 comparable units currently listed for rent nearby; rentals leasing fast (median 3d on market — plan ~1-2 weeks tenant-placement turnaround); solid renter incomes; 1,059 units permitted in South Central Connecticut Planning Region in 2024 (779 in 5+ unit buildings).
Forward outlook
- Local home prices are declining (-3.0%/yr); year-one equity from $1k of loan paydown is wiped out by about $4k of value loss. Plan a longer hold.
- At projected returns (-3.0% appreciation + 4.6% rent growth), your $41k cash investment doubles in ~9 years — after that, you're playing with house money.
Negotiation context
- It's been on market 45 days — a 3% lower offer ($141k) is reasonable based on typical stale-listing flexibility.
Risks & watch-outs
- Climate carrying-cost: major wind risk, 53% chance of damaging wind over 30y; extreme-heat days projected 7→17/yr by 2055 (HVAC capex compounding) — expect insurance premiums to compound above CPI over the hold.
Questions for the listing agent
- It's been on market 45 days. Have you received any prior offers? Is the seller open to a 3% concession, seller financing, or rate buy-down credit?
- What does the HOA fee cover, when was the last increase, and are there any pending special assessments or reserve-fund shortfalls?
- Any open or pending special assessments — roof, HVAC, plumbing, elevator, façade? What's the per-unit balance and payoff schedule, and is the seller paying it off at close or rolling it to the buyer?
- Is there a deadline driving the sale (1031 exchange, divorce, estate, relocation)? That informs how much negotiation room exists.
- What's the average days-on-market for RENTAL listings here right now (not sales)? A rising rental-DOM trend means longer vacancies and softer asking-rent achievability than the comps imply.
- What's the recent tenant-quality profile in this submarket — average credit score on applications, eviction rate, late-payment / NSF rate, and stable-employment percentage? A property-management company in the area should have these aggregated.
- How much new apartment / multifamily construction is in the pipeline within 1–3 miles? Heavy new supply (>2% of stock underway) typically softens rents 12–24 months out; light construction supports rent growth.
Investment metrics
- 1% rule
- 1.32% ✓
- Cap rate
- 9.03%
- Cash-on-cash
- 9.79%
- DSCR
- 1.44
- GRM
- 6.3
CMA / ARV
- ARV (median comp)
- $169,335
- List price
- $144,900
- Delta
- -14.43%
- Verdict
- UNDERPRICED
- Comps
- 20 within 1.0 mi
Projected returns pro-forma
-3.0% appreciation · 4.61% rent growth · sell at horizon
- IRR
- 0.6%
- Equity multiple
- 1.02×
- Total profit
- $882
- Equity at exit
- $21,605
- IRR
- 12.0%
- Equity multiple
- 2.03×
- Total profit
- $41,813
- Equity at exit
- $12,528
Cash invested: $40,572 (down + closing). Projections, not guarantees.
Landlord ↔ Tenant lean methodology
- Overall (STATE)
- 27 Tenant-Leaning
- State Connecticut
- 27 Tenant-Leaning · D+7
- County
- — inherits STATE
- City
- — inherits STATE
ZIP-level market 06514
- Rents YoY
- 4.6%
- Active inventory
- 107
- Price-to-rent
- 6.3×
Monthly cashflow live
- Estimated rent
- $1,912 high interval (Pro) →
- Mortgage (P&I)
- −$760
- Tax est. 1.5%
- −$181 /mo · $2,174/yr
- Insurance
- −$60
- HOA
- −$178
- Vacancy / Maint / Mgmt
- −$401
- Net cashflow
- $331
Break-even live
UW: 25.0% down · 7.5% · 30yr · 1.5% tax · 5.0% vac · 8.0% maint · 8.0% mgmt
Financing live
Cash to close
- Down payment
- $36,225
- Closing costs
- $4,347
- Reserves months
- —
- Total cash needed
- —
Loan-product check · same deal, 3 products live
Conventional
25% down · 7.5% · 30yr
- Down + closing
- —
- Monthly P&I
- —
- Monthly cashflow
- —
- DSCR
- —
- Eligible?
- —
Personal DTI + credit; lowest rate.
DSCR
20% down · 8.5% · 30yr
- Down + closing
- —
- Monthly P&I
- —
- Monthly cashflow
- —
- DSCR
- —
- Eligible?
- —
No personal income docs; deal must DSCR.
Hard money
10% down · 12.0% · 12mo
- Down + closing
- —
- Monthly P&I
- —
- Monthly cashflow
- —
- DSCR
- —
- Eligible?
- —
Short-term bridge; refi at stabilization.
Rent comps 12 comps
| Address | Beds | Baths | Sqft | Rent | $/sqft | DOM | Units | Dist |
|---|---|---|---|---|---|---|---|---|
| 380 Mather St Hamden, CT | 2.0 | 1.0–2.0 | 867 | $2,635 | $3.04 | 43d | 16 | 0.25mi |
| 1901 Dixwell Ave Hamden, CT | 2.0 | 1.0 | 660 | $1,550 | $2.35 | 2d | 1 | 0.41mi |
| 5 Manila Ave Apt 6 Hamden, CT | 1.0 | 1.0 | 620 | $1,600 | $2.58 | 43d | 1 | 0.52mi |
| 1 Kaye Plz Hamden, CT | 1.0 | 1.0 | 660 | $1,750 | $2.65 | 2d | 1 | 0.80mi |
| 676 Mix Ave Hamden, CT | 2.0 | 1.0–2.0 | 810 | $1,838 | $2.27 | 2d | 1 | 0.85mi |
| 1572 Whitney Ave Hamden, CT | 1.0 | 1.0 | 725 | $2,000 | $2.76 | 23d | 1 | 0.90mi |
| 1204 Whitney Ave #208 Hamden, CT | 1.0 | 1.0 | 637 | $1,775 | $2.79 | 2d | 1 | 1.26mi |
| 1204 Whitney Ave Hamden, CT | 1.0 | 1.0 | 641 | $1,900 | $2.96 | 43d | 2 | 1.26mi |
| 165 Towne House Rd Unit 165 Hamden, CT | 1.0 | 1.0 | 631 | $1,650 | $2.61 | 43d | 1 | 1.26mi |
| 1199 Whitney Ave Hamden, CT | 1.0 | 1.0 | 586 | $1,945 | $3.32 | 2d | 5 | 1.28mi |
| 925 Mix Ave Hamden, CT | 2.0 | 1.0–1.5 | 830 | $2,460 | $2.96 | 2d | 3 | 1.35mi |
| 134 Gorham Dr Unit 1 Hamden, CT | 1.0 | 1.0 | 750 | $1,800 | $2.40 | 2d | 1 | 1.49mi |
HOA detail condo
- Monthly dues
- $178 · $2,136/yr
- Assessments
- None detected in remarks — confirm with the listing agent.
Listing history 17 events
-
2026-06-18days on market $144,900 Active 45 DOM
-
2026-06-17days on market $144,900 Active 44 DOM
-
2026-06-16days on market $144,900 Active 43 DOM
-
2026-06-15days on market $144,900 Active 42 DOM
-
2026-06-14days on market $144,900 Active 40 DOM
-
2026-06-13days on market $144,900 Active 39 DOM
-
2026-06-10days on market $144,900 Active 37 DOM
-
2026-06-09days on market $144,900 Active 36 DOM
-
2026-06-08days on market $144,900 Active 35 DOM
-
2026-06-07pricedays on market $144,900 Active 34 DOM
-
2026-06-05days on market $149,900 Active 31 DOM
-
2026-06-03days on market $149,900 Active 30 DOM
-
2026-06-03days on market $149,900 Active 29 DOM
-
2026-06-01days on market $149,900 Active 28 DOM
-
2026-05-31days on market $149,900 Active 27 DOM
-
2026-05-14price $154,900 330-char remark
-
2026-05-04$159,900 Active 330-char remark
ⓘ Source: listings_history table (triggers on properties + properties_extension) + one-shot
backfill from property_details.listing_events for pre-trigger history.
Climate risk First Street
- Flood 1/10 Low FEMA zone X (unshaded) · 0% chance over 30 yrs
- Wildfire 1/10 Low
- Heat 7/10 Severe 7 d/yr ≥98°F today · 17 d/yr by 30 yrs out
- Wind 6/10 Major 53% chance of damaging wind over 30 yrs
- Air quality 4/10 Moderate 4 unhealthy d/yr today · 6 by 30 yrs out
Nearby sold comps map
Loading sold comps map…
Walkable amenities ~0.75 mi
Loading nearby amenities…
Taxation est. · year 1
- Rental income
- $22,941
- − Mortgage interest
- −$8,117
- − Property taxes
- −$2,174
- − Insurance
- −$724
- − Repairs & maintenance
- −$1,835
- − Management
- −$1,835
- − HOA
- −$2,136
- − Depreciation
- −$4,215
- Taxable income
- $1,905
- Est. tax owed @ 24.0%
- −$457
- After-tax cash flow
- $3,514/yr
For passive investors: Depreciation is non-cash, so a rental often shows a tax loss while cash-flowing — sheltering income. Rental losses are passive: they offset passive income freely, and up to $25,000/yr can offset ordinary (W-2) income if you actively participate and your MAGI is under $100k (phasing out to $0 by $150k); unused losses carry forward. On sale, claimed depreciation is recaptured at up to 25%, and gains may owe capital-gains tax (a 1031 exchange can defer both). Figures are a year-1 estimate at your 24.0% rate — not tax advice; consult a CPA.
Condition & rehab AI · 12 photos
This townhouse is in good condition with a good condition score of 80. It has a cosmetic rehab level and requires minor repairs and maintenance. The highest-ROI updates would be painting, new flooring, and updating the kitchen and bathroom.
Repairs flagged
- Minor Kitchen backsplash — No backsplash visible
- Minor Bathroom vanity — No specific issues noted
Value-add opportunities
- Both Painting — Fresh paint can enhance curb appeal and interior aesthetics
- Both New flooring — Replacing carpet with hardwood or tile can increase both resale and rental value
- Both Kitchen backsplash — Adding a backsplash can improve functionality and aesthetics
- Both Bathroom vanity — Upgrading the vanity can enhance the bathroom's functionality and appearance
Renovation cost estimate screening
| Repair item | Severity | Est. cost |
|---|---|---|
| Kitchen backsplash · No backsplash visible | Minor | $500–3,000 |
| Bathroom vanity · No specific issues noted | Minor | $500–3,000 |
| Total estimated repair cost · 2 items | $1,000–6,000 |
Value-add ROI direction
- Both Painting — Fresh paint can enhance curb appeal and interior aesthetics ↑
- Both New flooring — Replacing carpet with hardwood or tile can increase both resale and rental value ↑
- Both Kitchen backsplash — Adding a backsplash can improve functionality and aesthetics ↑
- Both Bathroom vanity — Upgrading the vanity can enhance the bathroom's functionality and appearance ↑
ⓘ Cost ranges are severity-bucket heuristics (US national rule-of-thumb). Get contractor quotes + a written scope before underwriting a rehab budget.
Schools (NCES district)
- District
- Hamden School District
- NCES district ID
- 0901860
- Math proficiency
- 30% ▼ -13.00%
- Reading proficiency
- 43% ▼ -7.00%
- Median HH income
- $68,821
- Composite
- 33.34/100
- National rank
- #5490
- State rank
- #106 of 153 in CT
Livability — Hamden
No livability data for this city. (Only ~50 U.S. cities are tracked.)
Census & demographics
- County
- New Haven County · 688,236 people
- City population
- 61,150
- Metro
- New Haven-Milford, CT
- Population (ZIP)
- 26,803
- Household income
- $88,900
- Rent vs Own
- Severe rent burden
- 1228.0
Population outlook (South Central Connecticut County) Hauer SSP2
- By 2040
- 608,362
Race, ethnicity, and origin ACS 2023
- Neighborhood character
- Diverse neighborhood (Simpson 0.68)
- Race & ethnicity
- White 43% Black 33% Hispanic / Latino 16% Two or more races 10% Asian 3%
- Hispanic origin (detail)
- Mexican 2% Puerto Rican 7% Dominican 2%
- Common ancestry
- Romanian 5% German 2% Lithuanian 2%
- Foreign-born
- 15% · Canada, Jamaica, China
- Languages at home
- 80% English-only · Spanish 10% Arabic 2% Other Indo-European 1%
Political lean MEDSL · South Central Connecticut
- 2024 margin
- Strong D (+20.1) · D 59.0% · R 38.9% · Other 2.1%
- All cycles
- 2024: D+20.1
Not yet ingested
- Civics
- —
Market trends
- HPI YoY
- ▼ -222.59%
- Current HPI
- 251.556
- Rent YoY
- ▲ 4.61%
- Metro
- New Haven-Milford, CT
- State GDP YoY
- ▲ 1.06%
- F500 in state
- 38
Industry mix (Fortune 500 HQ in CT)
| Industry | F500 HQs | Revenue |
|---|---|---|
| Industrial Machinery | 4 | $38B |
|
||
| Insurance | 3 | $71B |
|
||
| Financial Services | 2 | $25B |
|
||
| Transportation / Logistics | 2 | $18B |
|
||
| Healthcare | 1 | $247B |
|
||
| Telecommunications | 1 | $55B |
|
||
Price history
-9.4% since first listed4 events — show timeline
- 2026-06-05 Price Changed $144,900 Smart MLS
- 2026-05-20 Price Changed $149,900 Smart MLS
- 2026-05-14 Price Changed $154,900 Smart MLS
- 2026-05-04 Listed $159,900 Smart MLS
Cash-flow waterfall
monthlySold comps — $/sqft
last 12 mo · ≤1 miLoading sold comps…