 Triplex
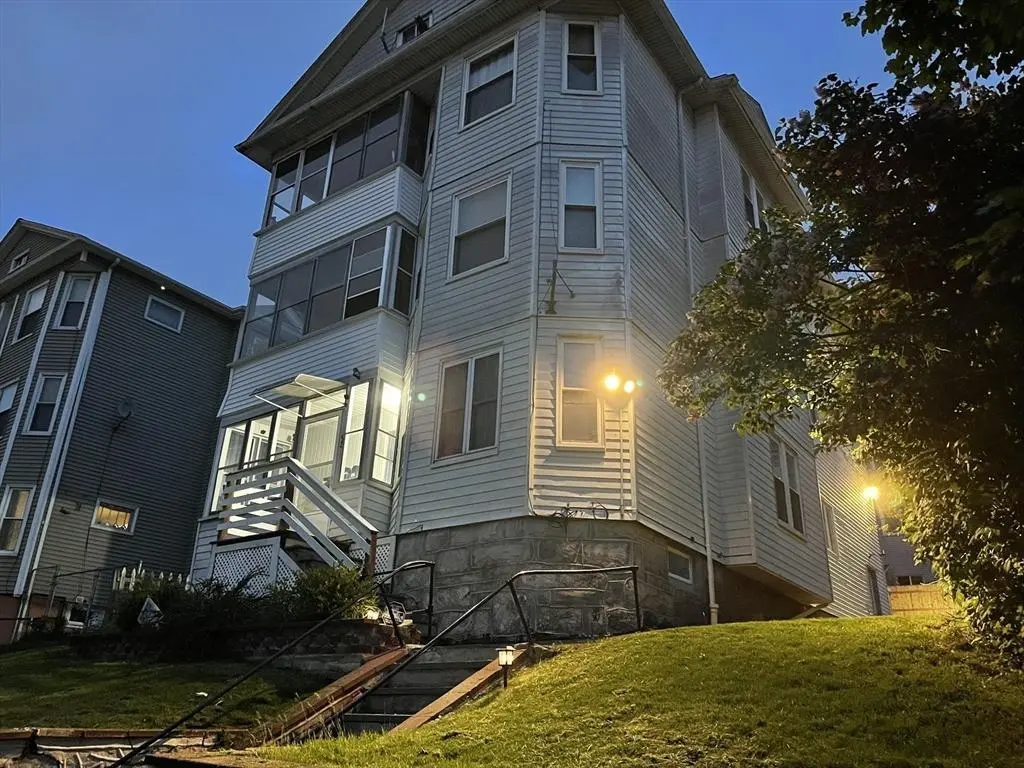
93 Sterling St · Worcester, MA
Flood risk 1/10 · Minimal
- FEMA flood zone
- X (unshaded)
- Chance of flooding over 30 yrs
- 0.0%
- Est. flood insurance / yr
- $473 – $860
Fire risk 1/10 · Minimal
- Est. fire insurance / yr
- $915 – $1,699
Heat risk 4/10 · Minor
- Hot days now (above 93°F)
- 7 days/yr
- Hot days in 30 yrs
- 16 days/yr
Wind risk 6/10 · Moderate
- Chance of severe wind over 30 yrs
- 27.0%
Air-quality risk 2/10 · Minimal
- Unhealthy air days now
- 1 days/yr
- Unhealthy air days in 30 yrs
- 2 days/yr
Risk factors via First Street. Map © Google.
Why this score? — see what drove the C grade
The composite is a weighted blend of 9 inputs, each scored 0–100. Each bar is that input's sub-score; the figure is the points it added to the 100-point composite (weight × sub-score).
- Cash flow +20.5/30.0
- ARV discount +7.8/15.0
- DSCR +6.5/10.0
- 1% rule +4.9/10.0
- Appreciation +4.6/10.0
- Livability +4.4/5.0
- Condition / age +2.5/5.0
- Schools +2.0/10.0
- Rent growth +1.9/5.0
$639,000
🖨 Deal sheet 📄 Offer letter ✓ Due diligence
Multi-family units
County records classify this as Multi-Family (2-4 Unit). Listing-text estimate: 3 units. confirmed
Listing remarks MLS
Fully Occupied Home with tons of updates over the years is ready for new owners! This 3 unit home was gutted to the studs in 2001-2 including all new plumbing and electrical. Additional Updates include: Replacement windows,Two Gas Furnaces 2001-2, Insulation 2002, Three Gas Hot Water Heaters all under 5 yrs old,and Rebuilt front porches 2014.Plus All three units have large rooms, high ceilings, hardwood floors in living room, dining room, and all bedrooms. Each Unit has separate washer/dryer hookups. Plenty of living space,storage area in back halls, and nice grassy back yard. Easy access to major routes, schools, downtown, and shopping. Parking on street and house side during winter months. First and Second Floors TAW long term tenants. Make this house your new home or investment property!
Key facts
- Range hoods
- Bathroom vents
- 2020 roof
Tags
Property features AI
Finance
- HOA & community: Not a senior community
Exterior
- Parking: Open parking available
- Utilities: Public water; Public sewer; 110-volt electric with individual meters
- Home design: 3-family property; 3 stories
- Construction: Frame construction; Stone and granite foundation; Grey exterior; Lead paint certified treated; Built year per public records
- Exterior features: Sloped lot with city views; Public road frontage; Shingle roof
Interior
- Bathrooms: 3 full bathrooms
- Interior features: Total of 18 rooms; Dirt floor and concrete unfinished basement
Neighborhood map
What this means for you Summary
Snapshot
- This is a 3 × 2-bed/1.0-bath units multifamily listed at $639k.
Deal economics
- At list price, monthly cash flow is $837 ($10k/yr) — positive. Per door: $279/mo.
- The deal already cash-flows at list — no discount required.
- To meet the 1% rule (rent ≥ 1% of price), the offer needs to be $632k (1.1% below list).
- Recommended offer: $632k (1.1% below list) — sets the bar for 1% rule.
- Cap rate 7.9% vs local median 4.1% in Worcester — top-decile yield for the area; either an underpriced asset or a hidden risk that comps aren't pricing in. Stress-test before assuming the spread holds.
Location & tenants
- Location reads 87/100 on livability (#9 in MA, #312 nationally) — a professional / high-income tenant draw. Strengths: crime A+, amenities A+, commute A+; Watch: schools C-, cost of living D.
- Worcester (urban): math 17% / reading 30% proficiency, ranked #280 of 302 in MA (top 93%) — low school quality limits family demand, transient renter base, plan for 1-2y turnover; 66% free/reduced lunch — lower-income household profile, screen leases tightly.
- Market conditions: Rents soft (-2.2%/yr); 25 active listings in the ZIP; 2,293 units permitted in Worcester County in 2024 (1,205 in 5+ unit buildings).
- At $6,322/mo this rent would consume 147% of the median local household income ($51k/yr) (locally 2517% of renters already pay >50% of income on rent) — very limited rent-growth headroom before tenants either downsize or default.
Forward outlook
- Local home prices are declining (-0.7%/yr); year-one equity from $4k of loan paydown is wiped out by about $5k of value loss. Plan a longer hold.
Negotiation context
- Only 9 days on market — expect competitive offers; lowballing is unlikely to land.
- 5 sale attempts since 26y ago with the ask held roughly flat each time — persistent listings suggest the price (not the market) is what's stuck; bring a comps-based counter.
- Current owner paid $321k; list at $639k implies a 99% gain — meaningful room to come down on a strong offer.
Risks & watch-outs
- Watch-outs: built in 1915 — expect roof / HVAC / electrical / plumbing capex.
- Climate carrying-cost: major wind risk, 27% chance of damaging wind over 30y — expect insurance premiums to compound above CPI over the hold.
Questions for the listing agent
- Can we see the unit-by-unit rent roll, current vacancy, and any below-market leases? What's the average tenancy length?
- What capital expenditures (roof, boiler, parking lot, exteriors) have been made in the last 5 years, and what's planned in the next 2?
- Built in 1915 — when were the roof, HVAC, electrical panel, plumbing, and water heater last replaced?
- Is there a deadline driving the sale (1031 exchange, divorce, estate, relocation)? That informs how much negotiation room exists.
- What's the average days-on-market for RENTAL listings here right now (not sales)? A rising rental-DOM trend means longer vacancies and softer asking-rent achievability than the comps imply.
- What's the recent tenant-quality profile in this submarket — average credit score on applications, eviction rate, late-payment / NSF rate, and stable-employment percentage? A property-management company in the area should have these aggregated.
- How much new apartment / multifamily construction is in the pipeline within 1–3 miles? Heavy new supply (>2% of stock underway) typically softens rents 12–24 months out; light construction supports rent growth.
Investment metrics
- 1% rule
- 0.99% ✗
- Cap rate
- 7.87%
- Cash-on-cash
- 5.62%
- DSCR
- 1.25
- GRM
- 8.4
CMA / ARV
- ARV (on-the-fly)
- $643,860
- Comps found
- 12
Show comp detail 12 sales within ~0.75 mi
| Address | Dist | Beds/Ba | Sqft | Sold | Price | $/sf | Match |
|---|---|---|---|---|---|---|---|
| 101 Sterling St | 0.02mi | 6/3.0 | 3,231 (-2%) | 10mo | $575,000 | $178 | 88 |
| 184 Vernon St | 0.18mi | 6/3.0 | 3,257 (-1%) | 8mo | $620,000 | $190 | 84 |
| 56 Fairfax Rd | 0.17mi | 6/3.0 | 3,387 (+3%) | 10mo | $650,000 | $192 | 79 |
| 6 Lund St | 0.33mi | 6/3.0 | 3,369 (+3%) | 3mo | $680,000 | $202 | 78 |
| 17 5th Ave | 0.22mi | 6/3.0 | 3,481 (+6%) | 14mo | $725,000 | $208 | 68 |
| 9 Montrose St | 0.16mi | 6/3.0 | 3,540 (+8%) | 17mo | $695,000 | $196 | 66 |
| 32 Granite | 0.52mi | 6/3.0 | 3,711 (+13%) | 2mo | $705,000 | $190 | 52 |
| 17 H Ward St | 0.56mi | 7/4.0 (+1) | 3,388 (+3%) | 14mo | $840,000 | $248 | 48 |
| 12 Butler St | 0.68mi | 6/3.0 | 3,432 (+4%) | 20mo | $535,000 | $156 | 44 |
| 59 Barclay St | 0.73mi | 5/3.0 (-1) | 3,000 (-9%) | 3mo | $550,000 | $183 | 44 |
| 661 Millbury St | 0.40mi | 6/3.0 | 2,838 (-14%) | 20mo | $583,000 | $205 | 42 |
| 49 Granite St | 0.56mi | 6/3.0 | 3,750 (+14%) | 15mo | $782,895 | $209 | 38 |
Match score weights: distance 35% · size 25% · config 20% · recency 20%. Top-matched comps best support the ARV.
Projected returns pro-forma
-0.73% appreciation · 0.0% rent growth · sell at horizon
- IRR
- -0.7%
- Equity multiple
- 0.97×
- Total profit
- $-5,448
- Equity at exit
- $162,675
- IRR
- 3.2%
- Equity multiple
- 1.29×
- Total profit
- $52,396
- Equity at exit
- $178,112
Cash invested: $178,920 (down + closing). Projections, not guarantees.
Landlord ↔ Tenant lean methodology
- Overall (STATE)
- 20 Strongly Tenant-Friendly
- State Massachusetts
- 20 Strongly Tenant-Friendly · D+15
- County
- — inherits STATE
- City
- — inherits STATE
ZIP-level market 01610
- Home prices YoY
- -0.1%
- Rents YoY
- -2.2%
- Active inventory
- 25
- Price-to-rent
- 25.3×
Monthly cashflow live
- Estimated rent
- $6,322 high interval (Pro) →
- Mortgage (P&I)
- −$3,351
- Tax from tax record
- −$540 /mo · $6,477/yr
- Insurance
- −$266
- HOA
- −$0
- Vacancy / Maint / Mgmt
- −$1,328
- Net cashflow
- $837
Break-even live
3-unit breakdown (identical units grouped — click to expand)
| Units | Beds | Baths | Est. rent |
|---|---|---|---|
| 3× units | 2 | 1 | $6,321 |
| #1 | 2 | 1 | $2,107 |
| #2 | 2 | 1 | $2,107 |
| #3 | 2 | 1 | $2,107 |
| Total (3 units) | $6,322 | ||
UW: 25.0% down · 7.5% · 30yr · 1.5% tax · 5.0% vac · 8.0% maint · 8.0% mgmt
Financing live
Cash to close
- Down payment
- $159,750
- Closing costs
- $19,170
- Reserves months
- —
- Total cash needed
- —
Loan-product check · same deal, 3 products live
Conventional
25% down · 7.5% · 30yr
- Down + closing
- —
- Monthly P&I
- —
- Monthly cashflow
- —
- DSCR
- —
- Eligible?
- —
Personal DTI + credit; lowest rate.
DSCR
20% down · 8.5% · 30yr
- Down + closing
- —
- Monthly P&I
- —
- Monthly cashflow
- —
- DSCR
- —
- Eligible?
- —
No personal income docs; deal must DSCR.
Hard money
10% down · 12.0% · 12mo
- Down + closing
- —
- Monthly P&I
- —
- Monthly cashflow
- —
- DSCR
- —
- Eligible?
- —
Short-term bridge; refi at stabilization.
Listing history 7 events
-
2026-06-18days on market $639,000 Active 9 DOM
-
2026-06-17days on market $639,000 Active 8 DOM
-
2026-06-16days on market $639,000 Active 7 DOM
-
2026-06-15days on market $639,000 Active 6 DOM
-
2026-06-14statusdays on market $639,000 Active 4 DOM
-
2026-06-09remarks 442-char remark
-
2026-06-09$639,000 New 1 DOM
ⓘ Source: listings_history table (triggers on properties + properties_extension) + one-shot
backfill from property_details.listing_events for pre-trigger history.
Tax reassessment forecast MA · Partial reset (capped growth)
- Current annual tax
- $6,477 · $540/mo
- Projected year-2 tax
- $7,168 · $597/mo
- Expected delta
- +$691/yr (+$58/mo · 10.7%)
ⓘ Screening estimate from a state-policy table — verify with the county assessor before closing.
Climate risk First Street
- Flood 1/10 Low FEMA zone X (unshaded) · 0% chance over 30 yrs
- Wildfire 1/10 Low
- Heat 4/10 Moderate 7 d/yr ≥93°F today · 16 d/yr by 30 yrs out
- Wind 6/10 Major 27% chance of damaging wind over 30 yrs
- Air quality 2/10 Low 1 unhealthy d/yr today · 2 by 30 yrs out
Nearby sold comps map
Loading sold comps map…
Walkable amenities ~0.75 mi
Loading nearby amenities…
Taxation est. · year 1
- Rental income
- $75,864
- − Mortgage interest
- −$35,794
- − Property taxes
- −$6,477
- − Insurance
- −$3,195
- − Repairs & maintenance
- −$6,069
- − Management
- −$6,069
- − Depreciation
- −$18,589
- Taxable loss
- −$329
- Est. tax savings @ 24.0%
- +$79
- After-tax cash flow
- $10,128/yr
For passive investors: Depreciation is non-cash, so a rental often shows a tax loss while cash-flowing — sheltering income. Rental losses are passive: they offset passive income freely, and up to $25,000/yr can offset ordinary (W-2) income if you actively participate and your MAGI is under $100k (phasing out to $0 by $150k); unused losses carry forward. On sale, claimed depreciation is recaptured at up to 25%, and gains may owe capital-gains tax (a 1031 exchange can defer both). Figures are a year-1 estimate at your 24.0% rate — not tax advice; consult a CPA.
Schools (NCES district)
- District
- Worcester
- NCES district ID
- 2513230
- Math proficiency
- 17% ▼ -15.00%
- Reading proficiency
- 30% ▼ -8.00%
- Median HH income
- $45,063
- Composite
- 20.3/100
- National rank
- #8615
- State rank
- #280 of 302 in MA
Livability — Worcester
- Score
- 87/100
- State rank
- #9
- US rank
- #312
Category grades
Schools grade is shown separately in the Schools card above.
Census & demographics
- Census place
- Worcester, MA
- County
- Worcester County · 487,911 people
- City population
- 207,324
- Metro
- Worcester, MA-CT
- Population (ZIP)
- 30,444
- Household income
- $51,472
- Rent vs Own
- Severe rent burden
- 2517.0
Population outlook (Worcester County) Hauer SSP2
- Today (2025)
- 850,858 people
- By 2030
- 860,403 · +1.1%
- By 2040
- 869,902 · +2.2%
- By 2050
- 869,110 · +2.1%
- By 2075
- 870,120 · +2.3%
- By 2100
- 829,703 · -2.5%
Race, ethnicity, and origin ACS 2023
- Neighborhood character
- Diverse neighborhood (Simpson 0.69)
- Race & ethnicity
- Hispanic / Latino 42% White 34% Two or more races 21% Black 13% Asian 6%
- Hispanic origin (detail)
- Mexican 1% Puerto Rican 21% Dominican 8%
- Common ancestry
- Romanian 4% Lithuanian 3% Hispanic 2%
- Foreign-born
- 27% · Canada, Vietnam, China
- Languages at home
- 48% English-only · Spanish 35% Other Indo-European 4% Vietnamese 2%
Political lean MEDSL · Worcester
- 2024 margin
- D (+10.0) · D 53.9% · R 43.9% · Other 2.2%
- 2008→2024 swing
- -3.8pp toward R · 2008: 13.8pp · 2024: 10.0pp
- All cycles
- 2024: D+10.0 2020: D+17.8 2016: D+10.5 2012: D+9.2 2008: D+13.8
Not yet ingested
- Civics
- —
Market trends
- HPI YoY
- ▼ -0.73%
- Current HPI
- 485.4378
- Rent YoY
- ▼ -2.22%
- Metro
- Worcester, MA-CT
- State GDP YoY
- ▲ 2.28%
- F500 in state
- 38
Industry mix (Fortune 500 HQ in MA)
| Industry | F500 HQs | Revenue |
|---|---|---|
| Technology | 3 | $17B |
|
||
| Insurance | 2 | $84B |
|
||
| Retail | 2 | $76B |
|
||
| Life Sciences | 1 | $43B |
|
||
| Energy Technology | 1 | $31B |
|
||
| Aerospace / Defense | 1 | $18B |
|
||
Price history
+606.9% since first listed15 events — show timeline
- 2026-06-09 Listed $639,000 MLS PIN
- 2019-03-04 Sold (MLS) $321,000 MLS PIN
- 2019-01-15 Pending — MLS PIN
- 2018-12-26 Relisted — MLS PIN
- 2018-12-17 Pending — MLS PIN
- 2018-10-24 Listed $330,000 MLS PIN
- 2004-08-17 Sold (Public Records) $300,000 Public Records
- 2004-08-17 Sold (MLS) $300,000 MLS PIN
- 2004-06-19 Listing Removed — MLS PIN
- 2004-05-18 Listed $304,900 MLS PIN
- 2000-09-22 Sold (Public Records) $110,000 Public Records
- 2000-09-21 Sold (MLS) $110,000 MLS PIN
- 2000-07-31 Listing Removed — MLS PIN
- 2000-01-03 Listed $99,900 MLS PIN
- 1985-08-13 Sold (Public Records) $90,400 Public Records
Property tax history
+4.2%/yrLatest (2023): $6,477 · +15.0% YoY. Source: county tax records.
Cash-flow waterfall
monthlySold comps — $/sqft
last 12 mo · ≤1 miLoading sold comps…